Dense phase sliding bed flow
Ordinary Portland cement has been selected as being representative of materials conveyed in dense phase in a sliding bed mode of flow and the conveying characteristics
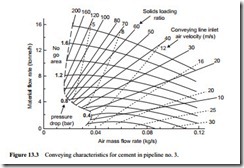
are presented in Figure 13.3. These were presented earlier in Figure 11.7a, where the air pressure was taken to 4 bar gauge. In Figure 13.3 they are shown with the inclusion of lines of constant conveying line inlet air velocity and are limited to a conveying line pressure drop of 1.8 bar for direct comparison with the other materials being considered here.
The first thing to emphasize here is that there is no abrupt transition between dilute and dense phase conveying. It is a little difficult to identify where the division might come, but if a conveying line inlet air velocity of about 10–12 m/s is taken it will pro- vide an approximate location. Due to the lower velocity and the better conveying cap- ability than the sugar the solids loading ratio for the cement is about 40–50 with a conveying line pressure drop of 1.8 bar, compared with about 15 for the sugar.
With the capability of conveying the cement with conveying line inlet air velocities down to 3 m/s much higher material flow rates are possible, because there is little change in the slope of the constant pressure drop curves with reduction in air flow rate. With lower air flow rates there is also a considerable reduction in power requirements. The only problematic area in conveying this type of material is in the transitional region between dilute and dense phase conveying at low values of pressure drop [1].
Transitional conveying limit
In Figure 13.3 the conveying limit is defined by a minimum conveying air velocity of about 11 m/s for the dilute phase conveying region and 3 m/s for the dense phase region. In between the two it is a function of solids loading ratio as defined by the relationship in Figure 11.7b. Due to its importance this is presented in more detail below. A very much longer pipeline is used for this purpose in order to magnify the extent of
the transitional region. The pipeline was 101 m long, of 53 mm bore and incorporated 17 numbers of 90° bends. A sketch is given in Figure 13.4 for reference.
The relationship between solids loading ratio and minimum conveying air velocity that has been used is presented in Figure 13.5. This clearly identifies the transitional relationship between the dilute and dense phase conveying mode limits.
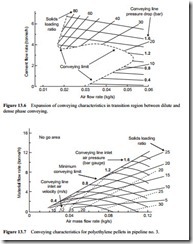
Plotting the locus of the conveying limit onto the conveying characteristics is a straightforward mathematical process. To illustrate the resulting curve only that part of the conveying characteristics in the area involved are presented so that the area could be magnified. This is presented in Figure 13.6 [1].
From Figure 3.6 it will be seen that the conveying limit can cut across constant pressure drop conveying lines of low value. The main point, however, is that most conveying systems generally operate with a constant value of air flow rate and so if a reduction in material flow rate should be required it is possible to block the pipeline by dropping
into the no go area. Due to the form of the dilute phase conveying characteristics, this is never a possibility in dilute phase conveying.


