Component pressure drop relationships
In order to determine the influence of vertical sections in a pipeline it is generally necessary to use pressure tappings along the length of the section to be considered. By this means, data can be obtained for vertical sections in isolation from the rest of the pipeline. In horizontal pipelines pressure tappings are not required since there is no change in orientation. The data obtained, however, will be in a different form, but if tests are carried out over a range of conveying conditions, the results can be presented in a similar way to those of the conveying characteristics for the pipeline.
Data obtained from a PhD programme [1] on vertical pneumatic conveying, super- vised by the author, is included here to illustrate the nature of the relationships. A sketch of the pipeline specifically built for the test work, together with typical pressure gradient results are presented in Figure 11.12 [2]. Two pipelines were built, one of 53 and another
of 81 mm bore, both with essentially the same geometry as that in Figure 11.12a. In the vertically down sections of pipeline, there were seven sets of pressure tappings and in the vertically up sections there were eight sets. A ring of four pressure tappings was provided at every location and these were inter connected. Every pressure tapping was fitted with a filter pad and provided with a high pressure air purging facility, which was routinely operated after each and every test run.
Two typical sets of pressure measurement data for the vertically down and vertically up sections of pipeline are presented in Figure 11.12b. This shows the location of the pressure tappings and their proximity to the various bends in the pipeline. The data relates to the pneumatic conveying of a fine grade of pulverized fuel ash, and many other materials were tested [2].
Conveying vertically down
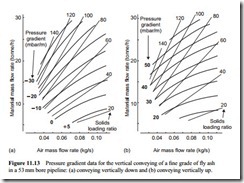
Results for the vertically downward conveying of a fine grade of pulverized fuel ash through the 53 mm bore pipeline are presented in Figure 11.13a. The same axes have been employed, as for the conveying characteristics, but lines of constant pressure gradient in mbar/m have been drawn from the experimental data. Solids loading ratio values of well over 100 were achieved for the flow of material.
The negative values of line pressure gradient on Figure 11.13a indicate that there is an increase in pressure through the pipeline. From Figure 11.13a, it will be seen that at a solids loading ratio of about 35 the fly ash could be conveyed through this pipeline with zero pressure drop. At lower values of solids loading ratio there will be a pressure
loss, but at higher solids loading ratios there will be an increase in pressure along the length of the pipeline. With a line pressure gradient of -25 mbar/m this would amount to a gain in pressure of about 1.0 bar for a 40 m length of vertical pipeline when conveying downwards.
If a pipeline having a significant proportion of the routing vertically downwards has to be designed, data such as that in Figure 11.13a is essential. This would be the case in situations where materials have to be conveyed down mine shafts. With a large vertical fall a very high pressure could result if the material was conveyed at a high value of solid loading ratio. It is possible that the pressure generated in this way could be used to con- vey the material to mine workings some distance from the bottom of the shaft. Such a system would have to be carefully designed, with due consideration to conveying air velocities in horizontal sections following vertical falls, but it is possible that it could operate with a low air supply pressure and require little power [3].
Conveying vertically up
Results for the vertically upward conveying of a fine grade of fly ash are presented in Figure 11.13b. Similar data for the vertically upward conveying of cement is presented in Figure 11.14. In Figure 11.14a the data if for a 53 mm bore pipeline and in Figure 11.14b the data is for an 81 mm bore pipeline. In all three cases, values of solids loading ratios well in excess of one hundred were achieved for the flows.
A comparison of these figures will show the influence of the two materials and the two pipeline bores on the relationships. A further comparison of these figures with
those for a total pipeline system (including bends) in Figures 11.5b, 11.7a and 11.8 will show that the slope of the lines of constant pressure are totally different from those of constant pressure gradient drawn on Figures 11.13 and 14. Figures 11.13 and 14 show that material flow rate will increase with increase in air flow rate for a constant line pressure gradient.
Lines of constant conveying line pressure gradient will ultimately reach the horizontal axis and so the slope must, at some point, reverse. In the area appropriate to pneumatic conveying, however, it would appear that a significant increase in material flow rate can be obtained by increasing the air flow rate. This is possibly a feature of straight pipeline lengths as it applies to both vertically up and vertically down lines. An increase in air flow rate at a constant line pressure gradient will result in a correspond- ing increase in power requirements, but it does mean that much of the extra power is being used to convey additional material. This point is considered further in relation to both horizontal pipeline and bends that follows.
Horizontal pipelines
In work carried out to determine scaling parameters for horizontal conveying distance, tests were carried out on pipelines of various lengths but with each having the same number of bends. From an analysis of the results obtained the influence of the bends was isolated. The results for barytes in a 53 mm bore pipeline are presented in Figure 11.15. This is a similar plot to that for the vertical lines in Figures 11.13 and 11.14. It will be noticed that, although these pressure gradient values are much lower than those presented for the vertically up lines, the trend of the curves is very similar. Despite the fact that barytes has a particle density of about 4200 kg/m3, solids loading ratios in excess of 100 were obtained once again. In terms of dense phase conveying capability it is the air retention property that is the dominating parameter.
Figure 11.15 shows once again that for straight pipeline sections there will be an increase in material flow rate with increase in air flow rate, in the area of the conveying
characteristics appropriate to dense phase conveying. With the horizontal pipeline sec- tion and both vertical sections showing the same trend, it must be the bends that have the over-riding effect on the total pipeline conveying characteristics.
Pipeline bends
In work carried out to determine scaling parameters for pipeline bends, tests were carried out on two lines of approximately the same length but having a different number of bends. From an analysis of the results obtained from these two pipelines, the influence of the bends was determined. By using the results of this analysis, it is possible to separate the effects of bends from the straight horizontal conveying, without having to use pressure tappings.
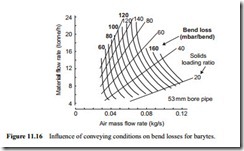
A plot similar to those presented in Figures 11.13 to 15 is given in Figure 11.16 for the pipeline bends. The data in this case is presented in terms of a pressure loss in mbar/bend, and relates to bends having a bend diameter to pipe bore ratio of about 24:1. It can be seen from Figure 11.16 why the conveying characteristics for a pipeline sys- tem are so different from those of the straight sections of pipeline.
In terms of pipeline conveying performance, therefore, bends can have a very significant effect. Losses associated with bends are expressed as either a pressure drop or an equivalent length of straight horizontal pipeline. The number of bends, their geometry and their location in the pipeline are all important. It is also possible that the type of conveyed material has a significant effect, as well as conveying parameters. These issues are considered further in Chapter 14.
Part of the problem lies in the complexity of the flow in the region of a bend. The conveyed particles approaching a bend, if fully accelerated, will have a velocity of about 80 per cent of that of the air. The velocity, of course, will depend upon the particle shape, size and density, and the pipeline orientation. At outlet from a bend the velocity of the particles will be reduced and so they will have to be re-accelerated back to their terminal velocity in the straight length of pipeline following the bend.


