High pressure conveying – Part II
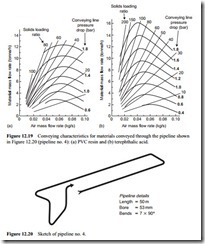
Two different materials that exhibit very distinct pressure minimum effects are illustrated in Figure 12.19. They were both conveyed through the pipeline as shown in Figure This was another high pressure test facility and fed by a different high pressure top discharge blow tank, also having a fluidizing membrane. One of the materials was a PVC resin and is shown in Figure 12.19a. The other was terephthalic acid and this is shown in Figure 12.19b.
PVC resin
The PVC resin could be conveyed with air velocities below 2 m/s and still show no sign of imminent pipeline blockage. At low air velocity, however, the lines of constant pressure drop have a positive slope and point approximately towards the origin of the graph. This, perhaps, is what might be expected, with the material flow rate being zero at zero air flow rate. This is also the form of the conveying characteristics for the individual elements of straight pipeline presented in Figures 11.13–11.15.
At high velocities, in the dense phase conveying area of the conveying characteris- tics the constant pressure drop curves slope towards the horizontal axis in a similar manner to all the other materials presented. The transition of the slope of the constant pressure drop lines occurs at a value of conveying air velocity that is approximately
equal to the minimum conveying air velocity for the dilute phase conveying of the material, being in the region of 9–12 m/s.
With the constant pressure drop curves changing slope there is clearly an optimum value of air flow rate at which the material flow rate is a maximum. If this data were to be plotted on a graph of pressure drop drawn against air flow rate, such as Figures 11.3 and 11.6a, there would be an optimum value of air flow rate at which a given material flow rate could be conveyed at a minimum value of pressure drop. This transition, therefore, is generally referred to as a ‘pressure minimum point’.
Terephthalic acid
The purified terephthalic acid (PTA) shown in Figure 12.19b was also conveyed through pipeline no. 4 (Figure 12.20). This shows very similar conveying characteristics to those of the PVC resin, but the slope reversal of the constant pressure drop curves occurs at much lower values of air flow rate, and hence conveying air velocity. As a result very much higher values of solids loading ratio are achieved with the PTA than with the PVC. Very much higher material flow rates are also achieved for given conveying conditions and so this has also contributed to the higher solids loading ratios.
The conveying characteristics for both of the Figure 12.19 materials are very different from those of the polyethylene pellets shown in Figure 12.11c. In Figure 12.11c the lines of constant pressure drop tend to merge together at low values of air flow rate and so conveying can be very unstable in this area. The pressure drop curves in Figure 12.19 materials are well separated and so there is no instability in the flow at low air flow rates.
