Relative humidity
Relative humidity, 4>, is the ratio of the partial pressure of the vapour actually present, to the partial pressure of the vapour when the air is saturated at the same temperature:
where pv is the partial pressure of vapour and pg, the partial pressure of vapour at saturation.
This is usually expressed as a percentage.
This situation can be best represented with lines of constant pressure superimposed on a temperature vs. entropy plot for H2O. Such a plot is given in Figure 25.6. This also shows the saturation lines for both liquid and vapour and how these separate the various phases or regions. Air saturated with water vapour, and having a relative humidity of 100 per cent, will lie on the saturated vapour line, g. The vapour in air having a relative humidity less than 100 per cent is effectively superheated steam and so the point will lie in the vapour region.
Point A represents the actual condition of the vapour in the air and it will be seen that it is in the superheated steam region. On the saturation line for the vapour, at the same temperature (point B), the pressure is p1. If the air is cooled from point A it will follow the p2 curve to the saturation line at C, which is the dew point at this pressure. From Figure 25.6 the relative humidity is given as:
The pressures p1 and p2 can be obtained from Figure 25.1, knowing the corresponding saturation temperatures TB and TC.
Psychrometric chart
The above expression, in terms of pressures, and other equations that can be derived from the Ideal Gas Law are however of little practical use in the process of determining relative humidity. For this we generally use wet- and dry-bulb thermometers or a hygrometer. The actual, or dry-bulb temperature, of the air is represented by point B on Figure 25.6 and point D represents the approximate location of the wet-bulb tempera- ture for unsaturated air.
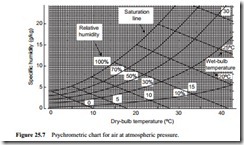
Since this method depends upon equilibrium between heat and mass transfer rates, the equations are rather complicated, and so data is given in charts and tables. The information is usually presented in a psychrometric chart. Such a chart, for air at atmospheric pressure, is shown in Figure 25.7. This is a graph of specific humidity plotted against dry-bulb temperature.
The saturation line is presented on this chart and this represents a relative humidity of 100 per cent. This is the same line as that drawn on Figure 25.2. Dry air, or air with a relative humidity below 100 per cent, is represented in the area to the right of the sat- uration line. Lines of both constant wet-bulb temperature and relative humidity are superimposed on the chart. Thus, if the wet- and dry-bulb temperatures are known, for a given sample of air, both relative humidity and specific humidity can be determined quite simply.
On some psychrometric charts lines of constant specific enthalpy and specific volume are also superimposed so that this data can also be obtained quickly if required.
Thus, with relative humidity, 4>, obtained from a hygrometer, the pressure, p, obtained from a barometer or pressure gauge, and the saturation pressure, pg, obtained from Figure 25.1 or an appropriate set of tables, the specific humidity of any sample of air can be readily evaluated.


