Moisture and condensation
Introduction
Atmospheric air naturally contains a certain amount of water vapour. The amount of water vapour that air can contain depends upon both temperature and pressure. A decrease in temperature or an increase in pressure can result in condensation occur- ring when the air passes through the saturation point. The problem with condensation, however, is that it can sometimes be very difficult to predict. The presence of moisture may even be unknown if it cannot be seen, although its effects will certainly be evident.
The addition of water to a bulk solid can have a significant effect on its flowability. Condensation usually occurs on the walls of containing vessels and surfaces such as hoppers, silos and pipelines. Although the effect might be localized, the material/ surface interface is critical to the smooth operation of most bulk solids handling plants. Some materials are hygroscopic and will naturally absorb moisture from the air with- out condensation occurring. For these materials it is generally necessary to dry the air that comes into contact with the material, to a value of relative humidity below that at which the material is capable of absorbing atmospheric moisture.
Humidity
The amount of water vapour that air can support is not constant but varies with both temperature and pressure. Once air is saturated, a change in either temperature or pressure can result in condensation occurring. The terms used here are relative humid- ity and specific humidity, and the Ideal Gas Law, commonly used for air, provides the basis for modelling moist air.
Specific humidity is the ratio of the mass of water vapour to the mass of dry air in any given volume, or volumetric flow rate, of the mixture. It is usually expressed in terms of grams of water per kg of dry air, and so it is strictly not a dimensionless quantity. Relative humidity is the ratio of the partial pressure of the vapour actually present to the partial pressure of the vapour when the air is saturated at the same temperature. It is usually expressed as a percentage, with 100 per cent representing saturated air.
Thus, specific humidity is a measure of the moisture content of the air, and relative humidity is a measure of the ease with which the atmosphere will take up moisture. Relative humidity is usually obtained by means of wet- and dry-bulb thermometers or some other form of hygrometer and specific humidity can be calculated.
Specific humidity
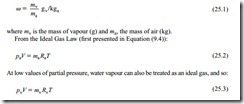
Specific humidity, w, is the ratio of the mass of water vapour to the mass of dry air in any given volume of the mixture:
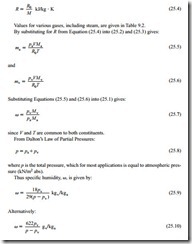
where pa is the partial pressure of air; pv, the partial pressure of water vapour; V, the volume of mixture; Ra, the characteristic gas constant for air; Rv, the characteristic gas constant for vapour and T, the absolute temperature of mixture.
And note that V and T will be the same, for both the air and the vapour, since the two constituents are intimately mixed.
The partial pressure of water vapour, pv, varies with temperature. For reference, values are given on Figure 25.1. The partial pressure of water vapour increases exponentially with increase in temperature and so the partial pressure axis on Figure 25.1 is split in two. The axis on the right hand side, for high temperature air, is magnified by a factor of ten, compared with that on the left hand side for low temperature air. It will also be seen that at 0°C, the freezing point for water, that a significant quantity of
vapour still exists in the air. At temperatures below 0°C, therefore, water vapour will precipitate as ice onto cold surfaces, without passing through the liquid phase. By the same reasoning, wet surfaces that are frozen can be dried, for the ice evaporates directly into vapour, without the surface becoming wet.
The characteristic gas constants for the two constituents can be obtained from Equation (9.9) and is included here as Equation (25.4):
The influence of temperature
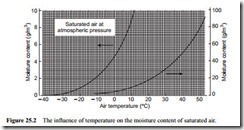
A graphical representation of this equation is given in Figure 25.2. This is a graph of moisture content of air, in grams of water per cubic metre of air, plotted against air temperature. This graph is also plotted with a split moisture content axis in a similar manner to Figure 25.1, with the two sections covering cold and warm air. It will be seen from these that the capability of air for absorbing moisture increases very consider- ably with increase in temperature. Figure 25.2 is drawn for saturated air at atmospheric pressure.
The moisture content, in volumetric terms, is obtained by multiplying Equation (25.10) by the density of air, which, for air at free air conditions, is 1.225 kg/m3. The density of air, however, varies with temperature and so this is not a very convenient parameter to use for process calculations. Specific humidity is better for this purpose since the mass flow rate of air will remain constant. The moisture content of air can also be expressed in flow rate terms. This is done simply by using the flow rate form of the Ideal Gas Law, rather than the static form in Equations (25.2) and (25.3). Figure 25.3 is such a plot and shows the magnitude of the potential moisture problem, of water associated with air, very well.
Figure 25.3 is also drawn for saturated air at standard atmospheric pressure and shows how the quantity of water in the air is influenced by both the volumetric flow rate of the air and its temperature. The influence of the volumetric air flow rate is lin- ear, of course, but that of temperature is not, as illustrated with Figure 25.2. Air tem- peratures down to minus 20°C have been included on Figure 25.3 to reinforce the point that significant quantities of moisture can be associated with air at temperatures below 0°C.
The influence of pressure
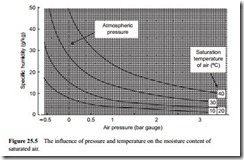
Two further graphical representations of Equation (25.10) are given in Figures 25.4 and 25.5. These are graphs of moisture content of air, in grams of water per kg of air,
drawn to illustrate the influence of air pressure. Figure 25.4 is a graph of specific humidity plotted against temperature, with lines of constant pressure drawn. The pressures cover a range from -0.5 to 3 bar gauge and so are appropriate to both positive and negative pressure conveying systems.
Figure 25.5 is a similar plot, but with the x-axis and the family of curves inter- changed. Both plots are for saturated air. These show that pressure also has a significant effect on the amount of water vapour that air can absorb, decreasing with increase in pressure. Figure 25.5 shows the influence of pressure on the moisture content cap- ability of air very well, particularly at low pressures and under vacuum conditions.


