The influence of pressure
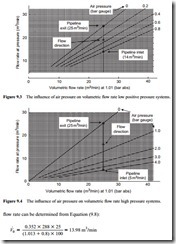
The influence that air pressure has on volumetric flow rate is shown graphically in Figures 9.3–9.5. These are plots of volumetric flow rate, at the reference atmospheric pressure of 1.013 bar absolute, against actual volumetric flow rate. To simplify the problem an isothermal situation has been assumed in order to isolate the influence of pressure, that is: T1 T0. Once again this is a linear relationship.
A series of lines representing the relationship for different air pressures is given on each graph, and each one illustrates the relationship for a different type of system. One is a low positive pressure system, another is for the use of high pressure air, and the third relates to vacuum conveying.
System influences
In Figure 9.3 the pressure ranges from 0 (atmospheric) to 0.8 bar gauge and so is appropriate to low pressure, typically dilute phase, conveying systems. If an air flow rate of 25 m3/min at free air conditions is considered it can be seen from Figure 9.3 that the actual volume at the material feed point at the start of the conveying line, will be reduced to about 14 m3/min if the air pressure is 0.8 bar gauge. Alternatively, the
In Figure 9.4 the pressure ranges from 1.0 to 4.0 bar gauge and so is relevant to high pressure conveying systems. If the air at the material feed point is 4.0 bar gauge a free air flow rate of 25 m3/min will be reduced to about 5 m3/min, as can be seen from Figure 9.4. In both of the above cases the air will expand through the conveying line
back, approximately, to the free air value, at the discharge hopper and filtration unit at the end of the pipeline.
In the case of a vacuum system, however, free air conditions prevail at the material feed point. The air then expands beyond this and so, if the exhaust is at -0.5 bar gauge, 25 m3/min of free air will increase to about 50 m3/min, as can be seen from Figure 9.5. Alternatively, the air flow rate can be determined from Equation (9.8) once again:
It can be seen from this range of values that it is extremely important to take this com- pressibility effect into account in the sizing of pipelines, and particularly so in the case of combined positive and negative pressure systems.
Velocity determination
If Figures 9.3 and 9.5 are used in conjunction with Figure 9.2 it will be possible to determine the resulting conveying air velocities for given conditions. An alternative to this procedure is to combine the models for actual volumetric flow rate and conveying air velocity.
Working relationships
From Equation (9.2) the actual volumetric flow rate:
Graphical representation
It will be seen from these models that a total of five variables are involved and so it is not possible to represent them diagrammatically on a single graph. By neglecting the influence of temperature at this stage the models can be reduced to four variables, and so if particular values of volumetric flow rate are chosen, the influence of the remaining three variables can be shown. This is presented for four values of volumetric flow rate in Figures 9.6–9.9, the volumetric flow rates being referred to ambient conditions of temperature and pressure.
These are all graphs of conveying air velocity drawn against air pressure, with pipe bore plotted as the family of curves. The reason for this is that both conveying air
velocity and air pressure are infinitely variable in the system, but pipelines are only available in a number of standard sizes. They are drawn once again to illustrate the performance of different types of system. Figures 9.6 and 9.9 cover the range of both positive and negative pressure systems and Figures 9.7 and 9.8 are drawn for positive pressure systems only.
Figure 9.6 clearly illustrates the influence of pressure on conveying air velocity in a single bore pipeline. The slope of the constant pipe bore curves increase at an increasing rate with decrease in pressure. The reason for this can be seen from Equation (9.11). Conveying line inlet air pressure, p1, is on the bottom of the equation, and so as its value gets lower, small changes in its value have a more significant effect.
This is particularly so for negative pressure systems, and is quite dramatic at high vacuum, as shown in Figure 9.6.
Suck-blow systems
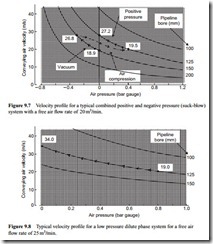
On Figure 9.7 the expansion lines for a typical combined positive and negative pressure system are superimposed. This illustrates the problem of both pipeline sizing, with this type of system, and the relative expansion effects at different air pressures. With 20 m3/min of free air a 150 mm bore pipeline would be required for the vacuum line. This would give an air velocity of 18.9 m/s at the material feed point and would expand to 26.8 m/s if the exhaust was at -0.3 bar gauge.
If the pressure on the delivery side of the blower was 0.4 bar gauge a 125 mm bore pipeline would be required. This would give pick-up and exit air velocities of 19.5 and 27.2 m/s, respectively. It will be noted that the pick-up and exit air velocities are very similar for the two parts of the system, but different size pipelines are required. The free air flow rate is clearly the same for the two parts of the system and so it will be seen that it is entirely due to the influence of the conveying line inlet air pressure on the compressibility of the air. In the above case it has been assumed that the material is conveyed in dilute phase suspension flow and that the minimum conveying air velocity for the material is about 15 m/s. If a 20 per cent margin is allowed when specifying a conveying line inlet air velocity, this would need to be about 18 m/s.
Low pressure systems
In Figure 9.8 a typical velocity profile for a low pressure dilute phase conveying system is shown. As with the previous system, a minimum conveying line inlet air velocity of 18 m/s is required, and so with a free air flow rate of 25 m3/min and a conveying line inlet air pressure of 0.8 bar gauge, a 125 mm bore pipeline would be required. The resulting conveying line inlet air velocity is about 19 m/s, and it will be seen that the air velocity gradually increases along the length of the pipeline as the air pressure decreases. At the end of the pipeline the conveying line exit air velocity will be about 34 m/s.
The above is simply an example to illustrate the variation in conveying air velocity from feed point to material discharge in a pipeline. For the design of a conveying system Equation (9.10) would be used to evaluate the free air requirements.
For a 125 mm bore pipeline, and with a conveying line inlet air pressure of 0.8 bar gauge (181.3 kN/m2 absolute) and a conveying line inlet air velocity of 18 m/s, this would come to 0.395 m3/s or 23.7 m3/min. If the influence of pressure was not taken into account, and the volumetric flow rate was evaluated on the basis of an air velocity of 18 m/s, effectively at the end of the pipeline, the conveying line inlet air velocity that would result at a pressure of 0.8 bar gauge would be about 10 m/s, and the pipeline would almost certainly block.
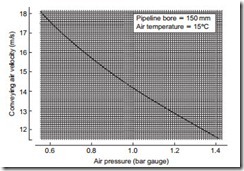
The influence of air pressure on conveying air velocity is illustrated further with Figure 9.9. This is a graph of conveying air velocity plotted against air pressure, and is drawn for a free air flow rate of 30 m3/min in a 150 mm bore pipeline. During the operation of a pneumatic conveying system the conveying line inlet air pressure may vary slightly, particularly if there are variations in the feed rate of the material into the pipeline. If the feed rate increases for a short period by 10 per cent, the conveying line inlet air pressure will also have to increase by about 10 per cent in order to meet the increase in demand.
If the minimum conveying air velocity for the material was 15 m/s and it was being conveyed with a conveying line inlet air pressure of 0.8 bar gauge, an increase in pressure to only 1.0 bar gauge would probably be sufficient to result in a pipeline blockage. At low air pressures conveying air velocity is very sensitive to changes in air pressure and so due consideration must be given to this when deciding upon a safety margin for conveying line inlet air velocity, and hence the volumetric flow rate of free air, to be specified for the system.


