BASIC DIAGRAMS AND SYSTEMS
In the preceding chapters, you have learned about the components that make up a fluid power system. Although a knowledge of system components is essential, it is difficult to understand the interrelationship of these components by simply watching the system operate. Knowledge of system interrelationships is required for effective troubleshooting and maintenance of a fluid power system. Diagrams provided in applicable technical publications or drawings are a valuable aid in understanding the operation of the system and in diagnosing the causes of malfunctions.
This chapter explains the different types of diagrams used to illustrate fluid power circuits, including some of the symbols that depict fluid power components. Included in this section are descriptions and illustrations denoting the differences between open center and closed-center fluid power systems. The last part of the chapter describes and illustrates some applications of basic fluid power systems.
DIAGRAMS
To troubleshoot a fluid power system, a mechanic or technician must be familiar with the system on which he or she is working. The mechanic must know the function of each component in the system and have a mental picture of its location in relation to other components. Studying the diagrams of the system can provide this knowledge.
A diagram may be defined as a graphic representation of an assembly or system that indicates the various parts and expresses the methods or principles of operations. The ability to read diagrams is a basic requirement for understanding the operation of fluid power systems. Understanding the diagrams of a system requires knowledge of the symbols used in the schematic diagrams.
Symbols
The symbols shown in Appendix A provide a basis for an individual working with fluid power systems to build upon. Some rules applicable to graphical symbols for flow diagrams are as follows:
1. Symbols show connections, flow paths, and the function of the component represented only. They do not indicate conditions occurring during transi tion from one flow path to another, nor do they indicate component con struction or values such as pressure or flow rate.
2. Symbols do not indicate the location of ports, direction of shifting of
spools, or position of control elements on actual components.
3. Symbols may be rotated or reversed without altering their meaning except in cases of lines to reservoirs and vented manifolds.
4. Symbols may be drawn to show the normal or neutral condition of each
component unless multiple circuit diagrams are furnished showing various phases of circuit operation.
Types of Diagrams
There are many types of diagrams. Those that are most pertinent to fluid power sys tems are discussed in the following text.
Pictorial Diagrams
Pictorial diagrams (Figure 9-1) show the general location and actual appearance of each component, all interconnecting piping, and the general piping arrangement. This type of diagram is sometimes referred to as an installation diagram.
Diagrams of this type are invaluable to maintenance personnel in identifying and locating components of a system.
Cutaway Diagrams
Cutaway diagrams (Figure 9-2) show the internal working parts of all fluid power components in a system. This includes controls and actuating mechanisms and all interconnecting piping. Cutaway diagrams do not normally use symbols.
Graphic Diagrams
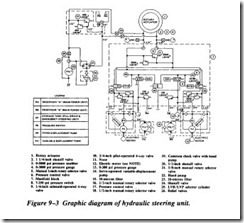
The primary purpose of a graphic or schematic diagram is to enable the maintenance person to trace the flow of fluid from component to component within the system. This type of diagram uses standard symbols to show each component and includes all interconnecting piping. Additionally, the diagram contains a component list, pipe size, data on the sequence of operation, and other pertinent information. The graphic dia gram (Figure 9-3) does not indicate the physical location of the various components, but it does show the relation of each component to the other components within the system.
Notice that Figure 9-3 does not indicate the physical location of the individual com ponents with respect to each other in the system. For example, the 3/4-inch solenoid operated four-way valve (10) is not necessarily located directly above the relief valve (26). The diagram does indicate, however, that the four-way valve is located in the working line between the variable-displacement pump and the 1-inch rotary selector valve and that the valve directs fluid to and from the rotary actuator.
Combination Diagrams
A combination drawing uses a combination of graphic, cutaway, and pictorial sym bols. This drawing also includes all interconnecting piping.

