DRIED AIR SYSTEMS
This system involves processing the compressed air or gas after the aftercooler and receiver to further reduce moisture content. This requires special equipment, a higher first cost, and a higher operating cost. These costs must be balanced against the gains obtained. They may show up as less wear and maintenance of tools and air-operated devices, greater reliability of devices and controls, and greater production as a result of fewer outages for repairs. In many cases, reduction or elimination of product spoil age or a better product quality may also result.
The degree of drying desired will vary with the pneumatic equipment and application involved. The aim is to eliminate further condensation in the air lines and pneumatic tools or devices. Prevailing atmospheric conditions also have an influence on the approach that is most effective. In many 100-psig installations, a dew point at line pressure of 500 to 350.F is adequate. In other applications, such as instrument air systems dew points of -soo·p is required.
Terminology involves drier outlet dew point at the line pressure or the pneumatic circuit. This is the saturation temperature of the remaining moisture contained in the compressed air or gas. If the compressed gas temperature is never reduced below the outlet dew point beyond the drying equipment, there will be no further condensation.
Another value sometimes involved when the gas pressure is reduced before it is used is the dew point at that lower pressure condition. A major example is the use of 100 psig (or higher) gas reduced to 15 psig for use in pneumatic instruments and controls. This dew point will be lower because the volume involved increases as the pressure is decreased. The dew point at atmospheric pressure is often used as a reference point for measurement of drying efficiency. This is of little interest when handling compressed air or gas.
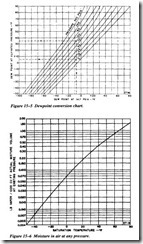
Figure 15-5 enables one to determine dew point at reduced pressure. The left scale shows the dew point at the elevated pressure. Drop from the intersection of this value and the elevated pressure line to the reduced pressure line and then back to the left to read the dew point at the reduced pressure.
Figure 15-6 shows graphically the amount of moisture remaining in the vapor form when the air-vapor mixture is conditioned to a certain dew point. This curve is based on a volume of 1,000 cubic feet or an air vapor mixture at its total pressure. For example, 1,000 cubic feet at 100 psig air at 500.F and 1,000 cubic feet of 15 psig air at 50.F will hold the same vapor at the dew point. However, 1,000 cubic feet at 100
psig and so·p reduced to 15 psig will become 3,860 cubic feet at so·F. As a result, it is now capable of holding 3.86 times as much vapor and the dew point will not be reached until the mixture temperature is lowered to its saturation temperature.
