Conveying capability correlations
Certain material characteristics can be used to predict the potential behaviour of a material when pneumatically conveyed. One is based on aeration and permeability properties, and another on basic property classifications, such as that by Geldart, presented in relation to fluidized motion conveying systems in Chapter 2.
The air retention capabilities of a bulk material are a good indicator of whether a material will convey in dense phase or not. Powdered materials such as fine fly ash, cement, bentonite and barytes have very good air retention properties and are capable
of being conveyed in dense phase and at low velocities. Coarse granular materials such as sand, salt and granular coal and ash have very poor air retention properties and cannot be conveyed in dense phase flow in conventional pneumatic conveying systems. If such materials have a very narrow particle size distribution and very good permeaility, however, it is possible that they will convey in dense phase in plug flow.
Basic property classifications
A goal in pneumatic conveying is to make it possible to design a pneumatic conveying system without the need for carrying out full scale conveying tests with a material. In a conventional pneumatic conveying system not all materials can be conveyed in dense phase. A problem for users and manufacturers of pneumatic conveyors alike is identi- fying which materials have low velocity dense phase capability without performing full scale conveying trials [3].
Research is not yet at a point where a pneumatic conveying system can be reliably designed on the basis of measuring appropriate properties from a small representative sample of the material to be conveyed. It is important to realize that even different grades of the same material can exhibit very significant differences in terms of conveying capability. This issue is considered in detail later in this chapter.
As a result, it is still necessary to undertake conveying trials with a material in a reasonably large scale pneumatic conveying test facility in order to get reliable data for system design, particularly if it is a material for which no previous conveying experience is available, and if it is desired to convey the material at low velocity in a dense phase mode.
Modes of flow
The term ‘dense phase’ has become a little ambiguous since no universally accepted definition appears to exist. For reference purposes, therefore, some definitions need to be established in order to identify the modes of flow that can exist in pneumatic convey- ing. In the context of this work the term dense phase is used to cover all non-suspension flow regimes. It is evident from flow visualization that three major flow regimes exist for pneumatic conveying:
1. Suspension flow (dilute phase) – where all, or the majority, of the material is in sus- pension in the conveying gas.
2. Moving bed type flow (dense phase) – where the material is conveyed in dunes on the bottom of the pipeline or as a pulsatile moving bed.
3. Slug or plug type flow (dense phase) – where the material is conveyed as full bore plugs separated by air gaps.
There can be considerable overlap between the moving bed type flow and slug flow in term of velocity and solids loading ratio, depending on the material characteristics. Within each flow regime there are many sub-divisions and variations in flow char- acteristics that make the problem of behavioural prediction extremely difficult. In general, however, few materials are capable of being conveyed in both dense phase flow regimes.
The importance of material properties on pneumatic conveying performance has been appreciated by many workers in a qualitative manner. Two of the more common correlations that categorize in terms of particle density and mean particle size are con- sidered for reference.
Geldart’s classification
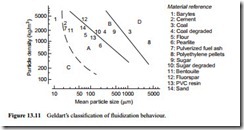
Geldart’s classification, shown in Figure 13.11, provides limited guidance, but this was originally derived specifically for fluidization behaviour, with no reference at all to pneumatic conveying. The classification is essentially in terms of two material properties. One is the difference in densities between the particles and the fluidizing medium. For air this difference can simply be taken as the particle density. The other property is the mean particle size of the material. It includes four broad areas that identify the behaviour of bulk materials when aerated or fluidized. It has often been considered that this form of classification could be used to assess the suitability of materials for dense phase conveying.
The classification is based on the behaviour of a column of material when fluidized through a porous base. Group A materials retain aeration and the fluid bed collapses very slowly when the air is turned off. These materials are best candidates for dense phase conveying. Group B materials do not retain aeration and the fluid bed collapses almost instantaneously when the air supply is turned off. The division between the A (air retentive) and B materials is close to identifying dense phase conveying capabil- ity in a sliding bed mode. The important property that it lacks for this purpose, how- ever, is particle size distribution. It is this that makes the A to B divide unreliable, and why it cannot identify plug flow capability with Group D materials.
In Figure 13.11 data from a number of materials that have been tested and conveyed by the author and colleagues have been included. The conveying characteristics for many of the materials were presented in the previous chapter and the rest will be found later in this chapter. The dividing line between Groups A and B generally separates the materials quite well. Sand, however, which is in Group A, will not convey in dense phase and fluorspar, which is in Group B, will convey in dense phase. The Geldart’s classification does not provide a sufficiently reliable indication for materials close to this divide. It is, of course, clearly not capable of identifying the pellets that will convey in dense phase.
An understanding of the role of particle properties such as size, and size distribution, shape or fractal properties and density will probably provide the ultimate solution to the problem. It is, however, very difficult to quantify properties such as particle shape and size distribution, and so measurable bulk properties associated with gas–particle interactions offer the best short-term means of using property values to predict pneumatic conveying performance. Air retention and permeability are probably the best bulk properties to consider for this purpose.
Dixon’s slugging diagram
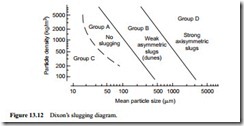
Dixon [4], among others, realized the importance of material type on the mode of conveying and devised a classification known as the Slugging Diagram, specifically for pneumatic conveying, which is shown in Figure 13.12. The axes are the same as those for the Geldart’s classification: density difference, which can be taken as particle dens- ity when the conveying medium is air, and mean particle size.
The Dixon and Geldart diagrams are both divided into areas A, B, C, and D, and it is suggested that these group together materials with similar flow capability. Broadly speaking, Group A materials are considered to be powders that have good fluidizing capability and are identified with the moving bed type flow regime. Group B materials are coarser materials that are not likely to convey in dense phase in a conventional system.
Group C materials are cohesive, fine powders that can be difficult to fluidize, although they often have very good air retention characteristics once mixed with air. These mater- ials can be conveyed in dense phase but can be troublesome, especially if they are allowed to de-aerate. Group D materials are large granular products that are possible can- didates for plug or slug flow, provided that the particle size distribution is no too wide.
Aeration property classifications
The author and Mark Jones (now Professor and Director of the Centre for Bulk Solids & Particulate Technologies at The University of Newcastle, Australia) undertook a research study into possible correlations between material properties, obtained from small scale bench type tests, and material conveying characteristics obtained from full scale pneumatic conveying trials. Correlations were required both in terms of the mode of flow possible for a given material and for the flow rate of material that might be achieved. Material flow rate capability was included since this has been found to vary so widely for different materials, for both dilute and dense phase modes of flow.
In each case bulk properties of the material, using just a small sample, were to be measured that would relate as closely as possible to the air–material interactions that occur in the pneumatic conveying process. Correlations were sought that would allow reasonable predictions to be made as to whether a material will convey in dense phase or not, and what type of pressure drop/material flow rate characteristic is to be expected so that material flow rate capability might be predicted.
Conveying characteristics
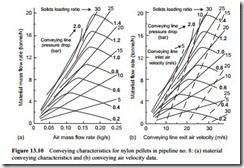
The material conveying characteristics that have been presented in the various chapters here show a wide variety of capabilities. The pattern of curves that make up the convey- ing characteristics are influenced by two main factors; pipeline geometry and material type. Changes due to pipeline geometry, particularly conveying distance and bends, are reasonably predictable. It is the differences in conveying characteristics with respect to material type that present most difficulties, and so it is this issue that was addressed.
The conveying characteristics are built up from the lines of constant conveying line pressure drop and solids loading ratio, plotted as material flow rate against air flow rate, over the range of conveyability of interest for any given material. It is the lines of constant conveying line pressure drop that are important. For a given pipeline the shape, spacing and limits of the pressure drop lines can vary significantly from one material to another.
The differences and changes with respect to material type are not entirely predictable, and this is why it is necessary to carry out tests if there is no previous, or only limited, conveying experience with a material. Once data is available it can be scaled to the required pipeline geometry with a reasonable degree of accuracy. The scaling, however, must not extend beyond the limits for which the data is available and the conveying capability proven.
Material testing
A number of different materials were tested extensively for the benefit of the research. Two of the materials, granulated sugar and coal, degraded to such an extent during the conveying trials that their conveying characteristics changed. In each case it was pos- sible to obtain conveying characteristics for these materials, in both the as received and degraded conditions, and property values were also determined.
With both conveying data and property values available for a wide range of materials, there was the possibility of deriving correlations between the two. Since pneumatic conveying is the transport of particulate solids in air, it was possible that the most likely correlations between conveying characteristics and material properties would be found from bench tests in which material–air interactions take place. For this reason a number of properties associated with aeration were determined. These included per- meability factor, minimum fluidizing velocity, de-aeration rate and specific surface.
For similar reasons various density measurements were taken. Particle density and bulk density in both the ‘as poured’ and ‘vibrated’ conditions were measured. Voidage and degree of compaction were then derived from these values. Particle size is clearly important and so both the mean value and size distributions were determined. Particle shape and moisture content were also recorded, although these were included more for material reference purposes. Much of this data is logged in Appendix 1 for reference.
Conveying mode correlations
For a conveying mode correlation, air retention and permeability were the main bulk properties that were considered and it is these terms that have been used widely in terms of discussing material conveying capability and performance to this point in the Design Guide.
Permeability factor
To determine whether or not permeability factor can distinguish between materials that will convey in dense phase and those that will not, minimum conveying air velocity
was plotted against permeability factor for each of the materials. Minimum conveying air velocity was employed since this can be directly related to conveying capability. This plot is shown in Figure 13.13. If the degraded materials are ignored, the points indicate a general trend.
From Figure 13.13 it can be seen that materials that have values of permeability factor in a range from about 10 X 10-6 to 120 X 10-6 can only be conveyed in dilute phase. To the left of this region, where the permeability is poor, and consequently the air retention is good, there is a cluster of points where the minimum conveying air velocity is less than 5 m/s. To the right of the dilute phase region is a lone point repre- senting polyethylene pellets. This area represents very good permeability. From the curve drawn it would appear that materials that have either good air retention proper- ties or good permeability, are likely candidates for dense phase conveying. In the area where neither the air retention nor the permeability are particularly good, materials will only convey in dilute phase.
Through the sight glasses that were fitted into the pipelines it was possible to observe the various flows. Three major groups were identified according to the observed modes of flow. On the right hand side of Figure 13.13 are coarse materials which con- vey in slug type flow at low velocity. The middle group of materials represent those with no natural dense phase capability in a conventional system. On the left hand side are materials that have good dense phase capability in a moving bed type flow regime.
The two degraded materials, however, do not fit the pattern too well on this plot and it is suggested that the permeability of a material to air is not the primary factor influ- encing the ability or otherwise of a material to be conveyed in a moving bed type flow regime. It is further suggested, however, that the permeability is probably the dominant factor for the slug and plug type flow regime.
Specific surface
The values of specific surface were derived from the same data from which the per- meability factor was determined, which was permeametry with air. For this reason it could be expected that a correlation which appears to exist between permeability fac- tor and conveying mode would be supported by any correlation that may exist between specific surface and conveying mode. These results, therefore, have not been included, but if specific surface is measured or derived by an entirely independent means it is suggested that it would be well worthwhile considering.
Vibrated de-aeration constant
The experimental data used to evaluate the vibrated de-aeration constant is completely independent of the data obtained from fluidization. Any correlation between the vibrated de-aeration constant and conveying mode, therefore, will provide independent support for the correlation achieved for permeability factor with respect to conveying mode. Details of the equipment used and method of analysis are given in Appendix 1.
This data is presented in Figure 13.14 and it can be seen that a similar pattern occurs once again when minimum conveying air velocity is plotted against vibrated de-aeration constant, on linear scale axes in this case. Once again, a definite region can be identified in which only dilute phase conveying can be achieved. On either side of this dilute phase region, materials will convey in dense phase.
The area on the left of Figure 13.14 groups materials that were observed to convey in a moving bed type flow regime. The centre section of the diagram represents mater- ials that were observed to have no dense phase capability. The area to the right groups materials that were observed to convey in a slug type flow regime.
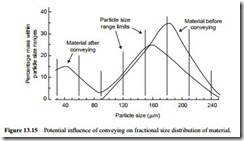
On this plot only the degraded coal was out of place. This coal had the widest par- ticle size distribution of any of the materials tested, other than the original coal. In addition, however, the size distribution was far from Gaussian, having two distinct peaks as a result of the particle degradation process with this friable material. The fines generated probably provided the material with a degree of air retention, while the coarse fraction retained a competing degree of permeability.
It may well be that materials that have size distributions that deviate widely from the Gaussian form should be viewed as possibly troublesome [3]. The above point concern- ing the particle size distribution is illustrated in Figure 13.15. This is a fractional size dis- tribution and it shows the twin peak effect very clearly. A friable material, having an initial Gaussian type size distribution, can readily change as shown in Figure 13.15 as a result of particle degradation.
Empirical classification
By combining Figures 13.13 and 13.14 and plotting vibrated de-aeration constant against permeability factor, it has been possible to produce an empirical material clas- sification for conventional pneumatic conveying systems. Such a plot, including the location of data points, is shown in Figure 13.16.
The points in Figure 13.16 each represent a single material and have been labelled with their material identity number. It can be seen that the materials form quite distinct groups. Using the boundaries identified, together with the broad groupings, a classifi- cation has been produced. The grouping in the bottom left hand corner represents materials that have dense phase capability in the moving bed type flow regime. The group in the top right hand corner represent materials with dense phase capability in plug type flow. The centre grouping represents materials that are generally restricted to dilute phase flow in a conventional conveying system. The material classification is presented again in Figure 13.17 without hindrance of data.
Material flow rate correlations
The next correlation attempted was to provide an indication of the potential material flow rate that could be achieved through a pipeline, particularly in low velocity dense phase conveying. In Figure 12.15 it was shown that material flow rates could vary over an extremely wide range for identical conveying parameters. At very low vel- ocity conveying the potential variation shown in Figure 12.15 is almost 20:1 and so this illustrates the importance of such a correlation.
Permeability factor
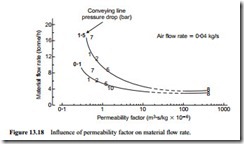
Permeability factor has already been shown to have considerable influence on the con- veying characteristics in general. Figure 13.18 shows a plot of material flow rate against permeability factor for an air mass flow rate of 0.04 kg/s and two values of conveying
line pressure drop (1.0 and 1.5 bar). This indicates that the lower the value of permea- bility factor, which effectively means the poorer the air permeability and the better the air retention, the greater the material flow rate.
A discontinuity in the curves in Figure 13.18 is shown by dotted lines. The correl- ation described earlier indicates that materials with a permeability factor in the range indicated by the dotted lines will probably not convey in dense phase. From the single point to the right of the graph (polyethylene pellets) it would appear that high convey- ing rates are not likely to be achieved with large granular materials, even if they will convey in a non-suspension mode.
Vibrated de-aeration constant
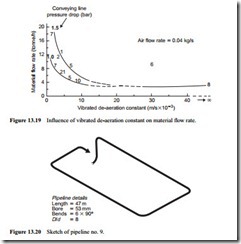
The values of vibrated de-aeration constant, as mentioned above, are obtained from data that is independent of permeametry, and so provide valuable support for correlations derived. Figure 13.19 is a plot of material flow rate values against vibrated de-aeration constant data. This shows that as the vibrated de-aeration constant decreases, which means that the air retention properties increase, the material flow rate increases. The two curves represent the two different conditions that were examined above. As with the other two aeration properties, the graph appears continuous, but there is a region, indi- cated by the dotted lines, where materials will not convey in non-suspension flow.
It should be noted that the above correlations are based on a rather limited number of materials and can, therefore, only indicate a trend. It is impossible with such a small number of materials to accurately identify boundaries or the ranges in which mater- ials will convey in dilute and dense phase flows. However, it is possible to predict, with more confidence than would otherwise be possible, whether a material will convey in dense phase or not. This is clearly a very large task, particularly in deriving the con- veying characteristics for such a large number of materials but it is hoped that such research will be continued so that correlations will become more generally available.
