Case study
To illustrate some of the points discussed above, and to reinforce the procedures, a case study is considered. From the extent of the introduction earlier it will be clear that it will not be possible to cover all types of conveying system and every combination of plant item that could comprise a pneumatic conveying system. The same applies to the mater- ial conveyed and so the conveying characteristics presented in Figure 20.11 for a mater- ial capable of being conveyed in dense phase are used here for illustrative purposes.
The material was cement and was conveyed through a 50 m long pipeline of 76 mm bore that incorporated nine 90°bends and was limited to low positive pressure con- veying. As a consequence the use of a positive displacement blower is considered. This combination is probably the most common found in industry. Despite the neces- sary restriction on the specific cases considered, much of the work is of a very general nature and so the underlying principles can be widely applied.
The influence of changing air flow rate
In order to show how the conveying characteristics can be used to assess the results of any changes that are made in operating conditions, the influence of changing air flow rates are demonstrated. Two cases are considered: one to show the adverse effect that generally results from increasing the air flow rate, and the other to show the benefit that can often be obtained by decreasing the air flow rate, particularly if the blower is over-rated for the required conveying duty.
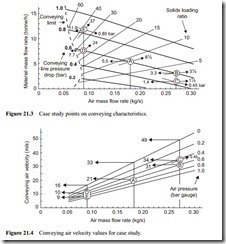
The conveying characteristics presented in Figure 20.11 are used for this purpose and it is assumed that the conveying line pressure drop is 0.6 bar and that the air mass flow rate is 0.18 kg/s. Figure 20.11 is reproduced in Figure 21.3 and this conveying condition is located on the conveying characteristics by reference point A. The cement flow rate is 5.5 tonne/h and the solids loading ratio is about 81⁄2.
It will be useful to know the value of the conveying air velocity for the various operating points being considered and so in Figure 21.4 a graph is included of conveying air velocity plotted against air mass flow rate, with lines of constant air pressure drawn and the various operating points being investigated are identified on this graph. Values can, of course, be calculated by using Equations such as (9.11) or (9.20).
From Figure 21.4 it will be seen that with 0.18 kg/s of air in the 76 mm bore pipeline the conveying line inlet air velocity will be about 21 m/s, at a pressure of 0.6 bar gauge, and at exit from the pipeline at atmospheric pressure the velocity will be about 33 m/s. For this particular material these velocities are unnecessarily high and so the blower would be over-rated for the duty.
Increasing air flow rate
There are two ways of increasing air flow rate: one is to change the blower and the other is to increase the rotational speed of the existing blower, if it still comes within the operating characteristics for the machine. It will be assumed that the air flow rate is increased by 50 per cent and the net result of both alternatives will be investigated. If the existing blower is replaced by one that will supply 50 per cent more air, with the same delivery pressure, the operating point on the conveying characteristics will simply transfer along the same constant pressure drop line to the appropriate air mass flow rate at point B. From Figure 21.3 it will be seen that the material flow rate will reduce by about 40 per cent to 3.3 tonne/h as a result. The reason for this is the excessively high conveying air velocity.
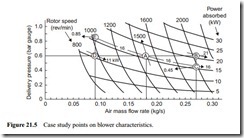
From Figure 21.4 it will be seen that the conveying line inlet air velocity is now 31 m/s and the exit air velocity is up to 48 m/s. With such high values of velocity most of the pressure drop is used in blowing the air though the conveying line and little is left for conveying the material. From the blower characteristics, presented in Figure 21.5, it will be seen that the power required to supply the increased air flow rate at this same pressure is 21 kW, and so the 40 per cent reduction in material flow rate would be achieved with a 30 per cent increase in power.
If the air flow rate is increased by increasing the rotational speed of the existing blower, this will necessarily result in a lower delivery pressure if there is no change in drive power. From the blower characteristics in Figure 21.5 it will be seen that the rota- tional speed will have to be increased to about 2000 rev/min and, assuming that there
is no additional reduction in pressure due to transmission losses, etc, the delivery pressure will be down to about 0.45 bar. This operating condition is located on Figure 21.5 at point C.
With an air mass flow rate of 0.27 kg/s supplied at a pressure of 0.45 bar, the equiva- lent point on the conveying characteristics in Figure 21.3 shows that the material flow rate will be only 1.4 tonne/h. With the same air flow rate as in Case B, the conveying line exit air velocity will also be 49 m/s. Due to the slightly lower air supply pressure, however, the conveying line inlet air velocity will be slightly higher at 34 m/s. The 75 per cent reduction in material flow rate can be attributed to the adverse effect of the excessively high conveying air velocities, as in Case B. The power supply, of course, is the same as in Case A.
Decreasing air flow rate
Two methods of decreasing the air flow rate are also considered. One is to provide a by-pass in the air line at outlet from the blower and to discharge part of the air supply to atmosphere so that it is not used for conveying. The other is to reduce the rotational speed of the blower. It will be assumed that the air flow rate is reduced by 50 per cent and the net result of these two methods is investigated.
If 50 per cent of the air is discharged to atmosphere, the operating point on the conveying characteristics will simply transfer along the 0.6 bar pressure drop line to the appropriate mass flow rate value at point D. From Figure 21.3 it will be seen that the material flow rate will increase by about 40 per cent to 7.7 tonne/h. Since the blower was over-rated in terms of volumetric flow rate the conveying air velocity was unnecessarily high.
With 50 per cent less air the pressure drop required to blow the air through the line is reduced. This means that more is available for conveying the material, and so its mass flow rate can be increased. From Figure 21.4 it will be seen that the conveying line inlet air velocity has reduced to about 10 m/s, and the conveying line exit air velocity is only 16 m/s. From the blower characteristics in Figure 21.5 it will be seen that the power required to supply the reduced air flow rate at this same pressure is 11 kW, and so the 40 per cent increase in material flow rate could be achieved with a 30 per cent decrease in power.
If the air flow rate is achieved by decreasing the rotational speed of the existing blower it is possible that the reduced flow rate will be at a higher delivery pressure. From the blower characteristics in Figure 21.5 it will be seen that the rotational speed will need to be reduced to about 1000 rev/min. On the assumption that this gain in pres- sure drop can be fully realised, the delivery pressure will be about 0.85 bar. This oper- ating condition is located on Figure 21.5 at point E. With an air mass flow rate of 0.09 kg/s supplied at a pressure of 0.85 bar, the equivalent point on the conveying char- acteristics in Figure 21.3 shows that the material flow rate will now be 11.9 tonne/h.
With the same air flow rate as in Case D the conveying line exit air velocity will also be 16 m/s. Due to the slightly higher air supply pressure, however, the conveying line inlet air velocity will be a little lower at 9 m/s. The considerable increase in mater- ial flow rate can be attributed to the fact that the full 16 kW is available to the system and that with these low inlet and exit air velocities the system is operating very close to its point of maximum efficiency.
It will be noticed from Figure 21.3 that the operating point is still within the body of the conveying characteristics and so there is unlikely to be any problems of pipeline blockage. It will also be noticed from Figure 21.5 that point E is only just within the operating limits of the blower. It is, however, a valid operating point on the conveying characteristics and a smaller blower is likely to meet the duty as specified.
The effects of solids loading ratio
The minimum conveying air velocity, as a result of this increase in pressure with Case E is now down to about 9 m/s. The solids loading ratio of the material in the pipeline, however, has increased to about 37 as can be seen from point E on Figure 21.3. The minimum air velocity that can be achieved for conveying a material in a pipeline depends to a large extent upon the solids loading ratio of the material being conveyed. As the solids loading ratio is increased, the minimum conveying air velocity that can be employed decreases for a material that is capable of being conveyed in dense phase. At a solids loading ratio of 37, therefore, it should be possible to convey the material with air velocities lower than 9 m/s without risk of blocking the pipeline.
The influence of solids loading ratio on the minimum conveying air velocity for the cement is given in Figure 21.6. Points D and E from the above case study are super- imposed on this plot and it can be seen that they are both above the conveying limit by a reasonable margin.
Power requirements
It will be noticed from the blower characteristics in Figure 21.5 that points A, C and E all lie on a line of constant power. These same points, therefore, form a line of constant
power on the conveying characteristics in Figure 21.3. Lines of constant power can be superimposed on the conveying characteristics quite easily, as illustrated in Section 11.5.2, and so to illustrate this point the conveying characteristics in Figure 21.3 are reproduced with lines of constant power requirements in Figure 21.7. It can be seen from Figure 21.7 that, for a material that has conveying characteristics of this type, that a reduction in air flow rate, for a constant value of conveying line pressure drop leads to a significant reduction in power requirements as well as an increase in material flow rate.


