The influence of pipeline bore
For a given conveying distance and conveying conditions, pipeline bore can have a very significant effect of material flow rate. If a specified material flow rate has to be achieved, however, there is usually a wide range of pipeline bores and conveying line pressure drop combinations that will meet the demand. The power requirements are likely to be different for each, and so the loops were incorporated into the logic dia- grams for system design Figures 15.1 and 15.3, in order to ensure the selection of the most satisfactory combination.
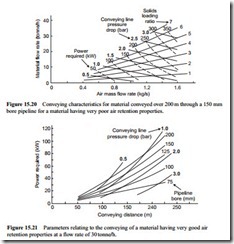
The influence of pipeline bore was shown briefly in Chapter 8, but in order to present a more complete picture and to show the inter-relating effect of conveying line pressure drop, complete sets of conveying characteristics are presented in Figures 15.13–15.20. The common point with regard to this group is that the pipeline length is 200 m in each case.
These figures show the influence of solids loading ratio and air requirements, as well as the effect of material type. The conveying characteristics presented are in two sets once again, one for a material with very good air retention properties and one for a material with very poor air retention properties.
For each material the conveying characteristics are included for pipelines of 50, 100, 125 and 150 mm bore. They all relate to the materials conveyed through a pipeline having an equivalent length of 200 m. The corresponding conveying charac- teristics for the missing 75 mm bore pipeline in this group were included earlier in Figures 15.9 and 15.10.
Conveying line pressure drop values up to 3 bar have been considered in each case. These two materials are the same as those considered in Chapter 8. It will be noted from this set of curves that for a specified material and conveying line pressure drop,
pipeline bore has little influence on the solids loading ratio at which the material is conveyed. The conveying potential, air flow rate, and power required, all increase con- siderably with increase in pipeline bore.
Once again, with complete sets of conveying characteristics, the influence of air flow rate on both material flow rate and power required can be clearly seen.
Design curves
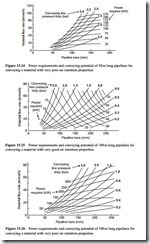
In order to provide a little more guidance on the potential relationships between mate- rial flow rate and power requirements, and the choice between conveying line pressure drop and pipeline bore, some design curves are presented. These are based on the data presented in Figures 15.5–15.20 on the effects of conveying distance and pipeline bore, and are for the two materials considered. Figures 15.21 and 15.22 are plots for power required.
Power required is plotted against conveying distance, with lines of both constant conveying line pressure drop and pipeline bore superimposed. Figure 15.21 is drawn for a material having very good air retention properties and Figure 15.22 is for a mate- rial having very poor air retention properties.
Both pipeline bore and conveying line pressure drop are presented together on Figures 15.21 and 15.22, but this particular plot does not show the inter-relating effects very well, particularly for the material having very poor air retention proper- ties, and so only the one representative plot is given for each material.
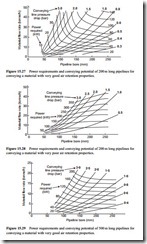
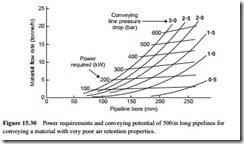
In Figures 15.23–15.30 material flow rate is plotted against pipeline bore and the families of curves drawn are of conveying line pressure drop and power required. Plots are presented for the two materials conveyed over distances of 50, 100, 200 and 500 m. These are similar to the graphs included in Chapter 8 to illustrate the potential of systems.
Lines of constant power have been added to provide additional information to assist with the selection of design parameters. All the data presented in Figures 15.21–15.30 is based on conveying line inlet air velocities 20 per cent greater than the minimum conveying air velocity values.
Since several loops are involved in the logic diagram for system design, and as some of these do not converge very quickly, these figures will provide some guidance on the initial selection of variables. This should help to reduce the work involved, particularly in the case of system design based on the use of mathematical models.


