Pump curves
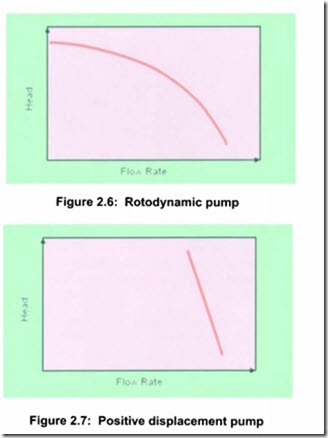
The performance of a pump can also be expressed graphically as head against flow rate. See Figure 2.6 for rotodynamic pumps and Figure 2.7 for positive displacement (PD) pumps.
The rotodynamic pump, (usually a centrifugal pump) has a curve where the head falls gradually with increasing flow, but for a PD pump, the flow is almost constant whatever the head. It is customary to draw the curve for PD pumps with the axes reversed (see Section 4.3), but to understand the interaction with the system, a common presentation is used here for the two pump types .
Pump operating point
When a pump is installed in a system, the interaction can be illustrated graphically by superimposing pump and system curves . The operating point will always be where the two curves intersect. (Figure 2.8 and Figure 2.9).
If the actual system curve is different in reality from that calculated, the pump will operate at a flow and head different from that expected.
For a PO pump, if the system resistance increases, the pump will increase its discharge pressure and maintain a fairly constant flow rate, dependent on viscosity and pump type. Unsafe pressure levels can occur without relief valves.
For a rotodynamic pump, an increasing system resistance will reduce the flow, eventually to zero, but the maximum head is limited as shown in Figure 2.8. Even so, this condition is only acceptable for a short period without causing problems. An error in the system curve calculation is also likely to lead to a rotodynamic pump selection which is less than optimum.
Adding comfort margins to the calculated system curve to ensure that a sufficiently large pump is selected will generally result in installing an oversized pump, which will operate at an excessive flow rate or in a throttled condition, which increases energy usage and reduces pump life.

