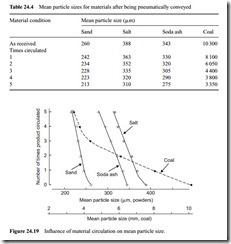
Pneumatic conveying data
To provide some data on the potential order of magnitude of the problem of degrad- ation, for materials conveyed in dilute phase suspension flow in a pneumatic conveying system, four different materials were pneumatically conveyed and the resulting degradation was monitored. A large scale pneumatic conveying facility was used and on-line samples were taken for analysis. Each material was re-circulated through the test loop a number of times so that the influence of conveying distance could also be investigated. The work was carried out by the author for the British Materials Handling Board [8].
Experimental details
A large scale pneumatic conveying test facility was used for this programme of work. Materials were fed into the conveying line by means of a 1 m3 capacity bottom dis- charge blow tank, with a similar sized receiving hopper mounted on load cells above. The pipeline was 37.5 m long, 53 mm bore and incorporated seven 90° bends. The bend diameter to pipe bore ratio for all seven bends was about 6:1. A sketch of the pipeline and conveying facility is given in Figure 24.15.
The diverter valve in the pipeline was used for material sampling. The most reliable way to ensure that a truly representative sample is obtained from a bulk solid is to sample the material while it is moving or being conveyed. With the diverter valve the full bore flow of the material being conveyed was sampled, and although a large sample was obtained, it was representative and easily reduced in quantity by means of a riffling device.
Materials tested
Four materials were tested in the programme of work. One was dried silica sand, another was sodium chloride (salt), the third was sodium carbonate (heavy soda ash) and the fourth was coal. Particle size distributions for the four materials are presented in Figure 24.16. A list of the various property values for the materials tested is given in Table 24.1 for reference.
The pipeline shown in Figure 24.15 and used for this particle degradation study is a slightly modified version of Pipeline no. 1 shown in Figure 12.2. Conveying
characteristics for the sand conveyed through Pipeline No 1 will be found in Appendix 2 and those for the other three materials are included in Figure 12.1.
Conveying details
Each material was circulated a total of five times and samples were obtained during every pass. By re-circulating and sampling in this way the influence of conveying dis- tance could be determined. By the last sample, after the materials had been circulated five times, they had been conveyed through a total of 181.5 m of pipeline and through 33 90° bends. A summary of the total conveying distance and number of bends after each circulation is given in Table 24.2.
For consistency, an attempt was made to convey each material under similar condi- tions. It was not possible, of course, to employ identical conveying conditions for each material because the conveying characteristics of the materials differed so much. The actual conveying conditions employed for each material, in terms of the solids loading ratio and the maximum and minimum values of conveying air velocity are given in Table 24.3 for reference.
Test results
Results of the sieve analysis of the samples of coal after each of the five conveying runs, together with the as received analysis for reference, are presented in Figure 24.17. It will be seen that very significant degradation occurred, particularly for the early passes, after which the rate of degradation decreased. The mean particle size was reduced by
6.95 mm in total, which is about 67 per cent of the original mean particle size value.
Similar results for the silica sand, for each of the five cumulative test runs, together with the fresh material, are presented in Figure 24.18.
The degradation of this abrasive material was quite significant, and separate lines could be drawn on the graph for each sample. There was an overall reduction of about 47 µm in the mean particle size, which represents approximately 18 per cent of the as received value. Results for the salt and soda ash were similar to those for the sand. The overall reduction in mean particle size for the salt and the soda ash both amounted to approximately 20 per cent of the as received values. Mean particle size data for each of the materials, after each time they were circulated, are presented in Table 24.4, and these mean values are shown plotted against the number of times circulated in Figure 24.19.


