Operating point
Knowing the conveying line inlet air velocity, C1, the air mass flow rate can be evaluated so that the operating point on Figures 18.2 and 18.3 can be established. The appropriate
where m·a is the air mass flow rate (kg/s); p1, the conveying line inlet air pressure (kN/m2 abs); d, the pipeline bore = 0.053 m; C1, the conveying line inlet air velocity (m/s) and T1, the conveying line inlet air temperature (K).
A value of conveying line inlet air pressure, p1, will have to be specified, if not known, but this is part of the ‘loop’ in this iterative method of analysis.
Solids loading ratios
The solids loading ratio, </, is included on Figures 18.2 and 18.3 and can be used in helping to identify the location of the operating point on these two figures, in addition to air and material flow rates. Any two of these three parameters can be used.
For dilute phase conveying, maximum values that can be achieved are generally of the order of 15, although this can be higher if the conveying distance is short or the avail- able pressure high. Typical conveying characteristics for materials having only dilute phase conveying capability, with a high pressure air supply were shown earlier in Chapters 11 and 12.
For moving bed flows, solids loading ratios of well over 100 can be achieved if materials are conveyed with pressure gradients of the order of 20 mbar/m. Typical con- veying data for a number of materials having such conveying capability was also shown earlier in Chapters 11 and 12.
Influence of distance and pressure
The design method presented here is an iterative process, and particularly so for dense phase conveying where the conveying line inlet air velocity is a function of the solids loading ratio. To provide some guidance in this process, for dense phase conveying, the potential influence of conveying distance and air supply pressure on the solids loading ratio is presented in Figures 18.5 and 18.6. These were presented earlier in Figures 12.27 and 12.28. Once again it must be stressed that these figures are only approximations for the purpose of illustration and should not be used on their own for design purposes.
Figure 18.5 is drawn for high pressure, long distance conveying systems, with air supply pressures up to 5 bar gauge and pipeline lengths up to 1 km. It will be noticed from this that the capability of dense phase conveying gradually reduces with increase in conveying distance and this is due to the pressure gradient requirement mentioned above.
Figure 18.6 is drawn for shorter distance, low pressure systems, up to 1 bar gauge, and with vacuum conveying included. It should be noted that dense phase conveying is possible with low pressure vacuum conveying systems, as will be seen on Figure 18.6. This is because dense phase conveying is a function of pressure gradient, as mentioned above, and not on distance or pressure drop alone.
Figures 18.5 and 18.6 are included in order to provide guidance in the design process presented. Pipeline bore, conveying air velocity and material type will all have an influence on the overall relationship and so they cannot be used for design purposes, as mentioned above.
Air only pressure drop
As mentioned earlier, the data in Figure 18.2 relates to the conveying of the material through the pipeline, and so the pressure drop required for the air alone must be added. The potential influence of pipeline length on the value of the air only pressure drop was presented in Figure 10.4, and the influence of pipeline bore was illustrated in Figure 10.5. All the equations and data necessary for evaluating this quantity were pre- sented in Chapter 10. A number of the equations included in Chapter 10 were used in the case studies in Chapters 16 and 17. They were used there to evaluate the air only pressure drop for specific operating points and this is what is required here also.
Procedure
To illustrate the process two cases are considered, one for dilute phase and another for dense phase conveying. The same pipeline and duty that were taken in the example used for the previous air only pressure drop method are also used. This was to convey the material at 30 tonne/h. The pipeline was 135 m long, with 110 m horizontal and 25 m vertical lift, giving an equivalent length, Le, of 160 m, plus five 90° bends. It was assumed that the temperature of the air and material at the conveying line inlet, T1, are 300 K (27°C). Local atmospheric pressure is taken to be 101.3 kN/m2.
Dilute phase conveying
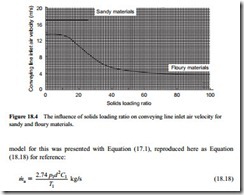
For the dilute phase conveying case a low pressure conveying system is considered having a positive displacement blower operating with a conveying line pressure drop of about 0.75 bar. A sandy material is chosen, and from Figure 18.4a conveying line inlet air velocity of 17 m/s is taken, which is the same as in the case at Section 18.2.5.
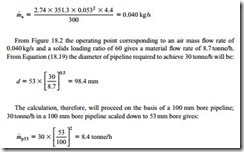
From Equation (18.18), taking a conveying line inlet air pressure of 0.75 bar gauge, the air mass flow rate in a 53 mm bore pipeline will be:
As an initial estimate it is assumed that a 200 mm bore pipeline will be required. Since the data in Figures 18.2 and 18.3 relates to a 53 mm bore pipeline the 30 tonne/h needs to be scaled down, for which Equation (14.8) can be used:
With this material flow rate and the above air flow rate, the operating point can be located on both Figures 18.2 and 18.3. This will now allow an evaluation of the three elements of pressure drop that need to be taken into account: (1) the pressure drop for conveying material through the pipeline, (2) the pressure drop due to the bends and (3) the air only pressure drop for the total pipeline.
1. From Figure 18.2 the pressure gradient is about 2.8 mbar/m and so as the equiva- lent length of the pipeline (straight sections only in this case) is 160 m, this element of pressure drop is 160 m X 2.8 mbar/m = 0.448 bar.
2. From Figure 18.3 the pressure drop for the bends is 43 mbar/bend and so for a total of five bends this element of pressure drop is 5 bends X 43 mbar/bend = 0.215 bar.
3. The air only pressure drop for the given conveying conditions can be obtained by applying Equation (18.16). The value of rf comes to 16.4. The conveying line exit air velocity, C2, as determined in the procedure for the previous method is about 30 m/s, and substituting these values into Equation (18.16) gives a value for the air only pressure drop of 0.083 bar.
The total pressure drop, therefore, to convey 30 tonne/h comes to 0.448 + 0.215 + 0.083 = 0.746 bar. As the original estimate was 0.75 bar, a repeat of the calculations with a second loop is clearly not necessary. This type of breakdown of the different elements of the pressure drop shows that about 11 per cent of the total is due to the air alone and 29 per cent is due to the five bends in the pipeline. An evaluation of power requirements gives about 100 kW.
Dense phase conveying
For the dense phase conveying case a high pressure conveying system is considered having a screw compressor operating with a conveying line pressure drop of about
2.5 bar. A floury material is chosen and so the selection of a value for the conveying line inlet air velocity is more complicated, depending upon the value of solids loading ratio, and hence involving an additional loop in the calculation procedure.
By reference to Figure 18.5, an approximate value of solids loading ratio can be obtained to start the process. The pipeline has a horizontal length of 110 m, a vertical lift of 25 m, and five bends. Doubling the vertical length and making an estimate of 5 m/bend, gives an overall equivalent length for the pipeline as approximately 185 m. With a conveying line pressure drop of 2.5 bar the solids loading ratio will be of the order of sixty from Figure 18.5. From Figure 18.4 the appropriate conveying line inlet air velocity will be about 4.4 m/s.
From Equation (18.18), taking a conveying line inlet air pressure of 2.5 bar gauge, the air mass flow rate in a 53 mm bore pipeline will be:
With this material flow rate and the above air flow rate, the operating point can be located on both Figures 18.2 and 18.3. This will now allow an evaluation of the three elements of pressure drop that need to be taken into account: (1) the pressure drop for conveying material through the pipeline, (2) the pressure drop due to the bends and (3) the air only pressure drop for the total pipeline.
1. From Figure 18.2 the pressure gradient is about 12.5 mbar/m and so as the equiva- lent length of the pipeline is 160 m once again, this element of pressure drop is 160 m X 12.5 mbar/m = 2.00 bar.
2. From Figure 18.3 the pressure drop for the bends is 66 mbar/bend and so for a total of five bends this element of pressure drop is 5 bends X 66 mbar/bend = 0.33 bar.
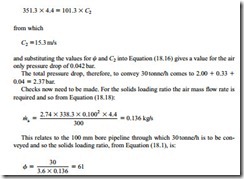
3. The air only pressure drop for the given conveying conditions can be obtained by applying Equation (18.16). The value of rf comes to 30.8. The conveying line exit air velocity, C2, can be determined approximately from C1 from the relationship:
since there is no change in pipeline bore or temperature and so
This is close enough to the original estimate of 60 and the pressure drop of 2.37 bar is sufficiently close to the 2.5 bar selected for repeat calculations not to be necessary, particularly as the solids loading ratio is higher than estimated and the pressure drop is lower than estimated.
A breakdown of the different elements of pressure drop for this case shows that about 2 per cent of the total is due to the air alone and 14 per cent is due to the five bends in the pipeline. The power requirements for this case are approximately 30 kW. These numbers are very different from those for the dilute phase conveying of the material at the same flow rate and through the same pipeline.


