Flow charts
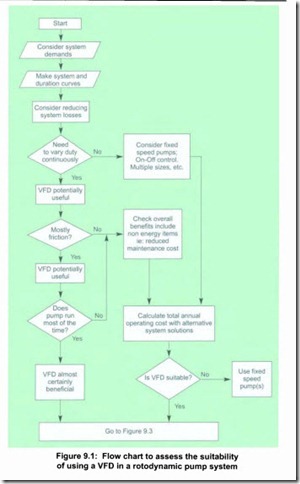
Flow charts to assess the suitability of a VSD for a pump system are shown in Figures 9.1 for rotodynamic pumps and 9.2 for positive displacement
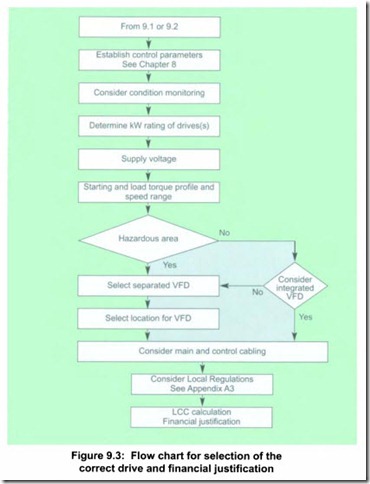
pumps. These are based on using a variable frequency drive, which will be more efficient than any speed control device, which uses slip to vary the speed. Having established that using a VFD is appropriate, Figure 9.3 is a flow chart for selecting the correct drive and making the life cycle cost calculation. Chapter 12 will help in making the financial justification.
Appendix A2.4 contains information on the factors to be considered in sizing a drive.
Related posts:
Case studies:Variable speed drives on golf course irrigation pumps
Benefits, drawbacks and operational issues:Power drive system integration
Concepts for estimating pumping energy costs:Flow duration diagrams
CONTROL VALVES:Pilot-Controlled Pressure-Reducing Valves
Hydraulic pumps:Gear pump.
Hydraulic pumps:Pump selection
Process control valves and actuators:Flow control valves ,Actuators and Valve positioners.
lime delay valves.
Service units.
Compressor types:Piston compressors,Screw compressors,Rotary compressors and Dynamic compressors.
Filters.
Actuators:mounting arrangements
Hydraulic and Pneumatic Accessories:Pneumatic Piping, Hoses and connections
POWER AND REFRIGER A TION CYCLES:THE CARNOT CYCLE AND ITS VALUE IN ENGINEERING
POWER AND REFRIGER A TION CYCLES:THE IDEAL VAPOR-COMPRESSION REFRIGERATION CYCLE


