Air processes
Since there is the possibility of condensation occurring, if either the temperature of the air decreases, or the pressure increases, the effect of various processes that air might undergo needs to be considered. Such processes include heating, cooling, com- pressing and drying.
Heating
If air is heated at constant pressure, its relative humidity will decrease and it will become drier. This effect can be seen from the psychrometric chart in Figure 25.7, reproduced in Figure 25.8 with two cases illustrated.
If no further moisture is added to the air its specific humidity will remain constant. Thus an increase in temperature will result in a horizontal shift to the right and give a
decrease in relative humidity, regardless of the starting point. In case A the starting point is saturated air at a temperature of 20°C. If it is heated to 30°C the relative humidity will drop to about 57 per cent. In case B the starting point is also air at 20°C but with a relative humidity of 50 per cent. If it is heated to 32°C the relative humidity will fall to about 25 per cent.
Cooling
If moist air is cooled at constant pressure, the reverse of the above process will occur, until the saturation line is reached. During this part of the cooling process the partial pressure of the vapour will remain constant. This can be explained as follows:
For the vapour in a mixture of air and vapour at temperature, T, we have, from Equation (25.3):
The ratio of mv/m will remain constant until the saturation line is reached, and so provided the total system pressure remains constant, the partial pressure of the vapour will remain constant. This entire cooling process can be illustrated on the temperature vs. entropy diagram shown in Figure 25.9.
If the starting point is at A, the air will have a relative humidity given by p2/p1. TA is the dry-bulb temperature. As the air cools the constant pressure line will be followed to the saturation line at point C, where the relative humidity will be 100 per cent. Point C is known as the dew point and the corresponding temperature, TC, is the dew point temper- ature. TB is the wet-bulb temperature. It should be noted that the wet-bulb temperature is not at the point C, but between A and C on the constant pressure line, as explained above.
Any further cooling beyond point C will result in condensation. Condensation will result in a loss in water vapour, and hence the partial pressure of the vapour will fall, as can be seen from Equation (25.13). If the final temperature is T3, point D on the temperature – entropy diagram will represent the saturated vapour and point E will represent the saturated water that has condensed. From point C to D the relative humidity will always be 100 per cent.
Condensation in reception hopper
Condensation can be a major problem in hoppers and silos, even if they are full of material. Condensation can also be a problem in conveying pipelines. When bulk solids are poured and stored there are always gaps between the particles, and these intersti- tial spaces naturally fill with air. This voidage is typically about 50 per cent for most bulk solids, which means that a 100 m3 capacity hopper will still retain approximately 50 m3 of air when it is completely full of material.
If, at the time of pneumatically loading a material into a hopper, the conveying air was warm, and the temperature subsequently fell, usually overnight, condensation could occur. If the temperature of the air was 30°C and the air was saturated, it would contain
about 30.1 g of water per cubic metre of air. If the temperature fell to 10°C, the air would only be able to support 9.4 g/m3, and so the difference would condense. This is shown diagrammatically in Figure 25.10. If the hopper had a capacity of 100 m3 and was full of material having a voidage of 50 per cent, the condensation for the given change in temperature would be about:
This amounts to more than 1 l of water, and most of it is likely to condense on the inside surface of the hopper, being the coldest surface on cooling, and the water will gradually drain down the walls, if it is not taken up by the stored material. Depending upon the mode of interaction between the material in the hopper, the water, and the hopper walls, this could have a very significant effect on the subsequent discharge of the material from the hopper.
It is possible that with a daily cycle of emptying and re-filling the hopper, the effect, in terms of moisture condensation, will be cumulative. Much of the condensed water will remain in the hopper, unless it drains out, because a subsequent rise in tempera- ture will cause little evaporation of this water. Thus on the next filling another litre of water could be condensed under similar climatic conditions.
Compressing
Two basic models of air compression can be considered. One is isentropic, or adiabatic, and the other is isothermal. The mode of compression is dictated essentially by the type of compressor or exhauster used. If compression is carried out very quickly, such as in a positive displacement blower or screw compressor, with negligible heat transfer
to the surroundings, the compression will be adiabatic. If the compression is carried out slowly, as in some reciprocating compressors, the compression could be isother- mal, particularly if the cylinder walls are water cooled and inter-cooling is employed between compression stages.
Adiabatic compression
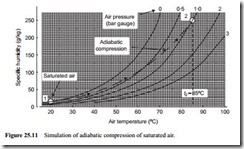
Thermodynamic models for adiabatic compression were considered with Equations (6.3) and (6.4), and Figure 6.9 in the Chapter on Air movers. From this it was shown that if air at atmospheric pressure and 20°C was compressed to 1 bar gauge (201.3 kN/m2 abs), the minimum temperature that it would reach after compression would be about 85°C. This compression process, for initially saturated air is simulated diagrammatically on Figure 25.11.
From Figure 25.11 it will be seen that at a temperature of 85°C and pressure of 1 bar gauge, air can support about 250 g of moisture per kg of air. Saturated air at atmospheric pressure and 20°C will have a specific humidity of about 14.7 g/kg. Thus after compression the air will be very dry and there will be no possibility of condensation occurring during the compression process.
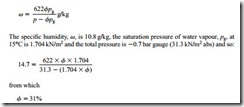
It should be noted that this process cannot be represented correctly on Figure 25.11 because the constant pressure lines are drawn for saturated air. It is, therefore, not possible to locate the point after compression. Although the temperature and pressure are both correct, the specific humidity is not. Knowing that the specific humidity is 14.7 g/kg, however, since it will be the same as at inlet to the compressor, it is possible to determine the relative humidity from Equation (25.12):
Thus the air will be extremely dry after compression.
Note also that these models cannot be used with reliable accuracy at such high partial pressures, but the calculation and Figure 25.11 do help to illustrate the point being made.
Isothermal compression
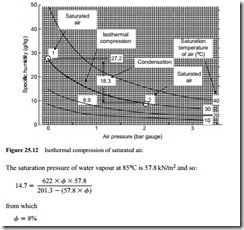
Since the specific humidity of air decreases with increase in pressure it is possible that condensation could occur during isothermal compression. A typical process is illus- trated on Figure 25.12. This is a graph of specific humidity plotted against pressure, with lines of constant saturation temperature drawn. The process illustrated is that of com- pressing saturated air at 30°C and atmospheric pressure, isothermally to a pressure of 2 bar gauge.
The specific humidity of saturated air at 30°C and atmospheric pressure is 27.2 g/kg, and at a pressure of 2 bar gauge it is 8.9 g/kg. Thus 18.3 g of moisture will condense per kg of air compressed isothermally at 30°C. Starting with saturated air presents the worst case. If the air was not initially saturated, but had a relative humidity below 100 per cent, less moisture would be condensed. Using Equation (25.12) in a similar man- ner to that above, for adiabatic compression, it can be shown that if the air at inlet to
the compressor had a relative humidity below 34 per cent, no condensation would occur during compression. The psychrometric chart presented in Figure 25.7 can also be used to evaluate this relative humidity level.
If, in the above case, 0.5 m3/s of saturated air was compressed, having a density of
1.165 kg/m3:
which equates to 38.4 kg/h, which is more than 8 gallon/h. For an air supply with a relative humidity below 34 per cent, however, there would be no condensation.
Relative humidity and air temperature are both liable to vary on a day-to-day basis, and with seasonal changes, and so large fluctuations in moisture levels can be expected. If measures must be taken to remove the moisture from the compressed air, the equipment used must be sized on the basis of the worst combination of climatic conditions to be expected.
Compression and cooling
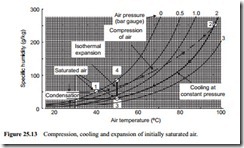
If the air from an adiabatic machine is too hot to be used directly, an after-cooler is often used. Although no condensation will occur in the compression process, it is possible that it could occur on cooling. For illustration an example is simulated on Figure 25.13. This is for atmospheric air, initially saturated at 40°C. The air is compressed to a pressure of 2 bar gauge with a resulting temperature of 96°C. It is then cooled at constant pressure.
After compression the air will be very dry, but cooling can have an even greater effect, and condensation could occur, as in the case illustrated. It should be noted that the process is only simulated on Figure 25.13, since the constant pressure lines relate to saturation conditions, but this does help to illustrate the point being made once again.
Only two variables can be represented at a time on a graph and in this case, as with Figure 25.11, temperature, pressure and humidity are all variables.
Expanding
In Figure 25.13 the case illustrated is that of atmospheric air (point 1) being com- pressed to 2 bar gauge (point 2) and then cooled at constant pressure to a temperature of 50°C (point 3). At point 3 the air will be saturated, as shown above, and so will have a relative humidity of 100 per cent. In expanding from point 3, at a pressure of 2 bar gauge, to atmospheric pressure at point 4, the air will gradually become drier. This is because air is capable of absorbing more moisture as the pressure decreases, as illustrated earlier with Figure 25.5.
Vacuum conveying
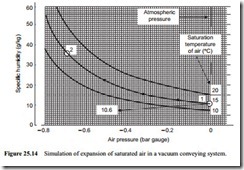
A similar situation occurs automatically with vacuum conveying. In a negative pressure conveying system the air is drawn into the conveying pipeline at atmospheric pressure and expands through the line to the exhauster. Figure 25.14 illustrates the situation for a negative pressure conveying system, having an exhauster capable of achieving a vacuum of 0.7 bar. An inlet air temperature of 15°C has been considered, and if the material fed into the pipeline is also at 15°C, the conveying process will be essentially isothermal.
Saturated air at the pipeline inlet has been considered and so the specific humidity of the air at inlet will be 10.6 g/kg. Since the capability of air for absorbing moisture increases with decrease in pressure no condensation will occur and the specific humidity of the conveying air at the pipeline exit will also be 10.6 g/kg, unless there is a transfer of moisture to or from the conveyed material and the air during the conveying process.
It will be seen from Figure 25.14 that the specific humidity of saturated air at a pressure of -0.7 bar gauge and a temperature of 15°C is 35.8 g/kg, and so the air will be very dry at exit. Once again the relative humidity of the air at the pipeline exit can be obtained from Equation (25.12):
Once again it should be noted that this process cannot be represented correctly on Figure 25.14 because the constant temperature lines are drawn for saturated air. It is, therefore, not possible to locate the point after expansion. Although the temperature and pressure are both correct, the specific humidity is not, as shown above.
Drying
If condensation must be avoided in a bulk solids handling plant, or if dry air must be used because a material to be conveyed is hygroscopic, it may be necessary to dry the air. There are three possibilities here, depending upon the degree of dryness to be achieved. These are filters, refrigerants and desiccants.
Filters
Owing to the speed at which both compression and cooling processes occur it is quite possible for droplets of water, in the form of fine mist, to be carried through the pipeline with the compressed air. The removal of droplets of water in suspension is a relatively simple process, although the efficiency of removal is significantly influenced by droplet size, being increasingly more difficult for smaller drop sizes. Filters were considered earlier in Chapter 6 on Air movers at Section 6.3.3.1.
Refrigerants
Drying by refrigerant cooling is essentially an extension of the process shown above in Figure 25.13, for the constant pressure cooling of high temperature compressed air. Refrigerant dryers usually have two stages of heat exchange. In the first, the warm com- pressed air is pre-cooled by the cold, dry, outgoing air. It then passes to a refrigerant heat exchanger where it is cooled to the required dew point. This is usually about 2°C, at
which temperature the specific humidity of the air is about 4.36 g/kg. Drying down to this level of moisture avoids problems of ice formation and freezing. If any further dry- ing is required much lower temperatures would have to be achieved, and this would make a refrigerant unit very expensive. This process can be illustrated on a graph of moisture content plotted against air temperature. Such a graph is shown in Figure 25.15.
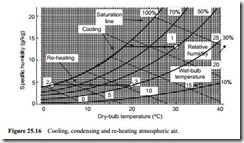
Figure 25.15 considers saturated air at 25°C being cooled to 2°C. At 25°C the moisture content will be 22.8 g/m3 and at 2°C it will be 5.6 g/m3. Thus 17.2 g/m3 will be condensed. If the air flow rate is 0.5 m3/s, the condensation rate will be 8.6 g/s or 31.0 kg/h, which is almost 7 gallon/h. If the air is then re-heated to 15°C, 5.6 g/m3 rep- resents a specific humidity of 4.87 g/kg, and from the psychrometric chart in Figure 25.7 it will be seen that the relative humidity will be about 40 per cent On Figure 25.16 a similar process is plotted to show how the psychrometric chart can be used for this type of evaluation. In this case air at 30°C, with a relative humidity of 50 per cent, is cooled to 2°C, and then re-heated to 20°C. As the inlet air is fairly dry it has to be cooled down to 18°C before reaching its dew point temperature, after which conden- sation will occur. From Figure 25.16 it will be seen that the air, after re-heating from 2°C to 20°C, at constant specific humidity, will have a relative humidity of about 30 per cent.
Desiccants
If air having a specific humidity of less than 4.36g/kg, or a dew point below 2°C, is required, a desiccant type air drier would generally be recommended. These are capable of reducing the moisture level of air to an equivalent dew point temperature of 260ºC, at which temperature the specific humidity will be about 0.0055g/kg.
It should be noted that there is no significant reduction in air temperature with desiccant type dryers as this is entirely a chemical absorption process. In order to reduce the moisture loading on a desiccant type dryer, if such a low air dryness level is required, it would generally be recommended that a refrigerant dryer should be used prior to a desiccant type.


