Energy considerations
Apart from showing the relationship between the main design parameters for the con- veying of a material through a pipeline, the conveying characteristics can be further developed to provide data on power requirements so that energy considerations can also be taken into account at the design stage of a system.
Two further materials, conveyed through the pipeline presented in Figure 11.2, are used to illustrate these points. One is cryolite, a coarse granular material with a very wide particle size distribution. The other is a dicalcium phosphate, a fine powdered material with good air retention properties.
The cryolite could only be conveyed in dilute phase suspension flow through the pipeline, even though high pressure air was used. The dicalcium phosphate, however, could be conveyed in dense phase, and solids loading ratios well in excess of 100 were achieved. The conveying characteristics for these two materials are presented in Figure 11.8 for reference.
It will be noticed that for the dicalcium phosphate the material flow rate axis has been doubled, because it was possible to convey the material at a very much higher flow rate for the same conveying line pressure drop. It will also be seen that the air flow rate axis has been halved for the dicalcium phosphate, because it was possible to convey the material with very much less air. These are two very obvious differences between these two materials that were conveyed through exactly the same pipeline (Figure 11.2).
The influence of conveying air velocity
The adverse effect on material flow rate of conveying with an unnecessarily high air flow rate can be explained in terms of conveying air velocities. Two values need to be con- sidered. These are the conveying line inlet and exit air velocities, and they can be deter- mined by applying Equation (11.3). If the exit from the conveying line is taken as atmospheric pressure, the velocity here will be directly proportional to the air flow rate.
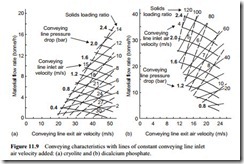
The conveying line inlet air velocity is a function of both pressure and air flow rate and so needs to be plotted for presentation. The conveying characteristics for the cryo- lite and dicalcium phosphate are redrawn in Figure 11.9. Lines of constant conveying line inlet air velocity have been superimposed on the conveying characteristics, and the air flow rate axis has been drawn in terms of conveying line exit air velocity.
Figures 11.9a and b show the differences between dilute and dense phase conveying quite clearly. The cryolite could not be conveyed with a conveying line inlet air velocity below about 14 m/s. Dicalcium phosphate, however, as will be seen from Figure 11.9b, could be conveyed with conveying line inlet air velocities as low as 4 m/s.
At one extreme a flow rate of 30 tonne/h can be obtained with inlet and exit velocities of 4 and 12 m/s, respectively. At the other extreme, the same flow rate can be obtained with the velocity expanding from 8 to 26 m/s. In the first case the dicalcium phosphate will be conveyed at a solids loading ratio of about 110 and in the second case the solids loading ratio will be about 50. If conveying air velocity alone is not a deciding factor between the two alternatives, power requirements might well be.
Power requirements
In the above example 30 tonne/h of dicalcium phosphate was conveyed through the pipeline. In the second case, however, the air flow rate required was considerably more and the conveying line pressure drop was also slightly higher. A more useful comparison of these two cases, and others, is to compare them on the basis of power requirements. Having evaluated all the parameters necessary for the system, it is now possible to deter- mine the power required, and hence the approximate cost associated with operating the system.
For an accurate assessment of the power it will be necessary to consult manufacturers’ literature. By this means, different machines capable of meeting the duty can be compared. For a quick, approximate assessment, to allow a comparison to be made of different variables, a simple model based on isothermal compression can be used.
A value of two was taken for the constant, to allow for the fact that the ideal model does not take account of thermodynamic irreversibility and transmission losses.
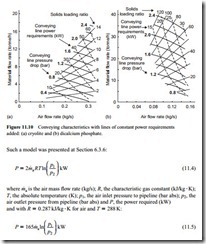
Using this model, it is a relatively straightforward operation to superimpose lines of constant power requirement onto the conveying characteristics. This has been done for the material conveying characteristics in Figure 11.8, and the results are presented in Figure
11.10. Although the data is not particularly accurate it does show quite clearly the adverse effect of conveying a material with an unnecessarily high air flow rate in terms of power consumption. In the above example of conveying dicalcium phosphate at 30 tonne/h it can be seen from Figure 11.10b that if the material is conveyed at a solids loading ratio of
110 the power required will be about 14 kW, whereas if the dicalcium phosphate is conveyed at a solids loading ratio of 50 the power required will be about 33 kW.
Specific energy
Although the data on power requirements clearly shows the effects of air flow rate, it does not present a clear picture if a comparison is to be made with respect to system air supply pressure or if a better comparison of different materials is required. To do this it is necessary to superimpose a family of curves in terms of specific energy onto the con- veying characteristics. By this means, a fully comprehensive comparison will be pos- sible. Lines of constant specific energy can be plotted quite simply by dividing the power requirements data on Figure 11.10 by the corresponding material flow rates. The results, in terms of specific energy in kJ/kg, are presented in Figure 11.11.
This shows quite conclusively that the most efficient conveying is achieved with the lowest possible air flow rate, and hence lowest conveying air velocity. The specific energy curves on Figure 11.11 follow a similar pattern to those of constant conveying line inlet air velocity on Figure 11.9, and so show that low velocity, dense phase con- veying is more efficient than dilute phase conveying.
In the case cited earlier, with the dicalcium phosphate conveyed at 30 tonne/h, only 1.6 kJ/kg would be required if the material was conveyed at a solids loading ratio of 110, but at a solids loading ratio of 50 the specific energy would be more than doubled. This also illustrates why it is necessary to obtain such data, for it is essential to know whether a material is capable of being conveyed at high values of solids loading ratio before a low velocity system is recommended. Indeed, many materials could not even be conveyed at a solids loading ratio of 20 over this distance.
Cryolite is typical of materials that cannot be conveyed in dense phase with a conventional pneumatic conveying system. A minimum value of conveying line inlet air velocity of at least 14 m/s would always have to be maintained. A high value of solids loading ratio could not be achieved even if a very high air supply pressure was used. As a result specific energy levels are not likely to be reduced for the cryolite below those indicated on Figure 11.11a. These figures show quite clearly that low velocity dense phase conveying is more economical than dilute phase conveying. For a material that is not capable of being conveyed in dense phase, the lowest possible value of conveying line inlet air velocity should be employed.


