Pipeline conveying capacity
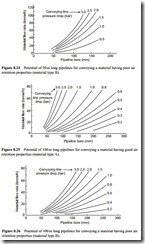
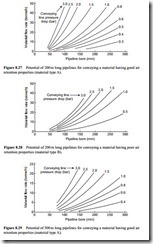
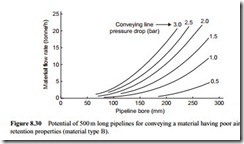
In the second set of curves presented, material flow rate is plotted against pipeline bore and lines of constant conveying line pressure drop are superimposed. Conveying distance is represented as the fourth variable here and four values ranging from 50 to 500 m are considered. All four graphs are drawn for each material. The eight graphs are presented in Figures 8.23–8.30.
With this form of presentation the influence of pipeline bore and conveying distance on the empty line pressure drop is shown. This is a topic that is considered in detail in Chapter 10. The pressure drop for the air in a conveying line is directly proportional to pipeline length and inversely proportional to pipeline diameter. This explains why the lines of constant pressure drop slope upwards to an increasing rate to higher material flow rates with increase in pipeline bore, for a given conveying distance.
For the short 50 m long pipeline material flow rates up to 120 tonne/h are considered with pipeline bores taken to only 150 mm.
For the 100 m long pipelines the material flow rate range considered has been reduced to 80 tonne/h and the pipeline bore has been extended to 250 mm.
For the 200 m long pipelines the material flow rate has been further reduced to 50 tonne/h since the same limit of 3 bar on conveying line pressure drop is considered.
For the 500 m long pipelines the material flow rate has been reduced to 20 tonne/h since the pressure gradient is down to 6 mbar/m and the maximum value of solids loading ratio that will be possible, even for a type A material will only be about 20 (see Figure 1.1).


