TEST CARD FEATURES
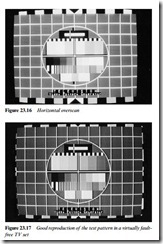
The final screen picture, Fig. 23.17, is an (almost!) fault-free reproduction of the test card used in the previous shots, which is representative of the general-purpose types used by broadcasters and in
factories and workshops. The main features of the card shown here are as follows:
1. Crosshatch pattern: checks convergence/RGB registration, best judged without colour in the picture. Colour fringing should be zero at screen centre, minimal at the edges and corners
2. Border castellations: these define the edges of the pattern, and should be half visible on all four sides. The colours, positioning and brightness of the border castellations are designed to check
(a) the sync-separator performance – shortcomings cause picture cogging or pulling along castellation lines; and (b) burst-gate timing, which if incorrect causes hue errors in horizontal bands aligned with the red or blue (LHS) or yellow (RHS) castellation blocks
3. Centre circle: provides a check on scanning amplitude and linear- ity. It should be perfectly circular
4. Black/white rectangles: these, at the top of the circle, offer a video l.f. response check; poor l.f. response shows as streaking to the right of white-to-black and black-to-white transitions. The needle pulses within the rectangles are designed to emphasise any ghost images which may appear to their right
5. Black-white squarewave pulse train: just above the colour bars, these blocks check transient and i.f. video response. There should be no ringing, overshoot, pre-shoot or ‘smudging’ on them
6. Colour bars: the colour bars just above the centre of the circle are, left to right, yellow, cyan, green, magenta, red, blue. Their characteristics vary with the design of the pattern as in Fig. 23.2. Here they are 75% amplitude, 100% saturation as per Fig. 23.2(c)
7. Grey-scale steps: immediately below the centre of the circle, the eight steps in the wedge represent linear graduations of luminance signal amplitude. The difference in brightness between adjacent rectangles should be approximately constant, with the first block just at beam cut-off point and its neighbour clearly differentiated from it
8. Multiburst: the frequency gratings correspond (from left to right) to approximately 250 kHz, 500 kHz, 1 MHz, 2 MHz, 3 MHz, 4 MHz and 5 MHz, not all of which are visible in this picture. On colour sets the final two generally contain cross-colour pat- terns, while low-band VCRs can only reproduce the first five
9. Colour-fit pattern: inside the circle at the bottom appear yellow- red-yellow rectangles as a check of chroma/luminance registration. The redness of the central rectangle should fit snugly between the yellows
