DIGITAL TV
Digital TV broadcasting began in the UK in 1998, from both satellites and terrestrial transmitters. All digital TV systems depend on data-compression to reduce the bit-rate to a point where it can be accommodated in practical broadcast channels and storage media like tape and disc. DTV only became possible for domestic use when complex and fast processor and storage ICs got down to a low enough price in mass production to make cheap receivers; and when the very complex bit-reduction technology was in place, based on the work of the Moving Pictures Expert Group (MPEG) which established the compatible standards used by the broadcasters and the receivers.
DIGITAL CONVERSION
To get an accurate and distortion-free reproduction, any analogue signal must be sampled at a rate at least twice that of its highest possible frequency. In a 625-line video system this can range up to about 6 MHz, and so the luminance waveform is sampled at 13.5 MHz, i.e. intervals of 74 ns. Each sample needs to be able to describe 256 different levels of brightness to fully simulate a true analogue signal: this requires 8 bits. The ‘colouring’ signal need not convey so much detail to satisfy the human eye, so the sampling rate is lower, at 6.75 MHz. B−Y (Cb) and R−Y (Cr) samples are taken at this rate, again with 8-bit quantisation. To encode a picture to conventional 625/50 standards, then, the bit-rate comes out at (13.5 × 8)+(6.75 × 8)+(6.75 × 8)=216 Mbit/s. A simple modula- tion system would require a transmission bandwidth of about 108 MHz to convey this, some twenty times that used in a.m. analogue broadcasts. Hence the need for data-compression and bit- rate reduction systems. Several forms of these are used in the MPEG-2 DTV system, some simple and some complex: it starts with removal of redundant information from the bitstream.
Redundancy
Analogue transmissions have the capacity to send 25 completely different pictures every second, a wasteful attribute which cannot be used, and could not be assimilated by the human eye. Not only that, but each of those pictures could contain over 400 000 totally different pixels. Again, this capacity is quite wasted: it is difficult to imagine a picture in which each pixel bears no resemblance to its immediate neighbours, and again the viewer’s eye would be unable to make sense of it. The similarity between successive frames represents temporal (in time) redundancy, and that between adjacent and near- neighbouring pixels represents spatial (positioning) redundancy. The removal of redundant information is fundamental to data compression.
All ‘real’ TV pictures have much correlation between pixels in adjacent and related areas of any given frame. Where the background to a newsreader is blue, for instance, it is only necessary to send the code for a single pixel of the required colour and brightness plus an instruction to ‘print it out’ 720 times along the scanning line, and the data rate has been reduced by a factor of 720. In practice it is not as simple as that, of course, but plainly there is a lot of redundant information along a typical single scanning line. This elimination of spatial redundancy is a form of intra-frame compression.
Successive TV frames (except in the special case where there is a complete change of picture, a jump cut) are very similar to each other. If each picture is compared, content-wise, with its predecessor then only the differences are broadcast, another large saving of data can be made. The amount of information required depends on the ‘busy- ness’ of the picture, but averaged out over a period there is again much redundancy of data. Subjectively, the main drawback with data compression in the temporal sphere is the risk of strange effects on fast-moving picture objects, though they are mitigated by advanced techniques at the receiver, e.g. interpolation and motion prediction; and in the compression algorithm, which steadily evolves. Data-rate reduction in the temporal realm is sometimes called inter-frame compression. Further data compression can be achieved by exploit- ing the statistical redundancy of TV picture signals, in which the likely values for any given pixel or group of pixels can be predicted from previous values, and interpolated from corresponding and adjacent pixels in following frames where intermediate ones are incomplete or missing. No data is wasted in transmitting sync pulses, blanking intervals or black level: simple codes and precision counting suffice for these.
Coding
Having reduced the amount of picture data to a minimum, further reductions in data density can be made by ‘abbreviation’ techniques.
Conventional datastreams have a fixed number of bits per sample; variable length coding economises by assigning codes to each sample, the most common sample values having the shortest codes. Run length coding avoids sending strings of binary ones or zeros; instead, brief codes are used to indicate how many of each should be inserted at the receiving end. Linear predictive coding and motion compensation are also used to reduce the bit-rate.
Image analysis
For the purpose of coding and quantisation, the pixels of which the original image is made up are grouped into blocks as shown in Fig. 12.1. Eight columns of pixels along eight adjacent scanning lines represent 64 samples of Y information and 16 samples of C in- formation. Four such blocks are grouped together (Fig. 12.2) to form a macroblock, each of which represents a small square of the picture. A series of these macroblocks, sent in normal scanning order, make up a data-slice, representing a sliver of picture as shown in Fig. 12.3. The data is arranged in this slice form for two main reasons: error detection, in which complete data slices can be ignored if they contain errors; and motion compensation, where a macroblock is the basis for prediction of movement of picture objects. A complete frame or picture is built up from successive data slices.
Picture groups
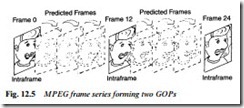
A series of 12 frames forms a group of pictures (GOP) as shown in Fig. 12.4. The first of them, known as an I-frame (Intraframe), contains more data than its successors, and acts as a starting or refer- ence point for the process of reconstitution at the receiving end. Subsequent frames in the group are of two sorts: P (Predicted) frames, whose contents represent a forward-temporal prediction of motion and content based on a previous I or P frame; and B frames, based on an interpolation of both preceding and succeeding samples in time. Plainly the production of a B frame needs three or more stored frames and fast real-time computing power. Motion compensation
data is sent as an error code which represents the difference between actual and predicted results. This requires relatively few bits to convey. A typical sequence of MPEG frames is shown in Fig. 12.5.
DCT and quantisation
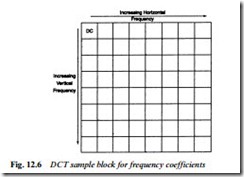
The next step in the MPEG process is quantisation, in which advantage is taken of the weaknesses and tolerance of the human eye and brain to further compress the data. First, the values of each of the pixels in the data block are converted by a complex process called Discrete Cosine Transform (DCT) from the realm of time to that of frequency so that, for instance, if all the pixels in the block
have the same value, only one code (representing that d.c. value) is sent, see Fig. 12.6. As the ‘busyness’ of the time-sample block increases, the frequency block begins to fill up with data represent- ing coefficients, with all the significant data grouped near the top left-hand corner, in the same way as a spectrum display of an analogue modulated transmission shows virtually all of the side- band energy grouped close to the carrier: in most analogue sound and vision signals which are ‘real’ and natural, high-frequency components form a very small part of the whole. The only ‘real’ value in the frequency-domain sample block of Fig. 12.6 is the one at top left: the others are difference values, and many of them are zero.
Now comes the quantisation stage, in which the value of each frequency component in the sample block is assigned a ‘rounded- off’ number which can be coded with the minimum possible number of bits for transmission. The scaling process is not linear: it is
weighted to match human physiology so that the high-frequency coefficients are quantised relatively coarsely, and the low-frequency ones more accurately. The value in the top left corner of the matrix, representing the d.c. value, is fully preserved. The weighting factor is influenced by feedback from the output buffer store, for reasons which will become clear shortly.
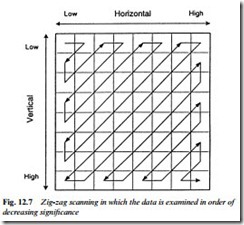
The quantisation and scaling process reduces most of the DCT coefficients in the matrix block to zero, especially those associated with the high-frequency video components. Now the data in the block is turned into a serial bitstream by reading out the values in order of increasing frequency and hence decreasing significance. Fig. 12.7 shows how it is done by a process of zig-zag scanning, with d.c. and low-frequency data first. This facilitates the run-length and variable- length coding techniques described earlier: the datastream derived from the zig-zag scan contains, in most cases, long strings of zeros towards the end of a block. Except in I frames, even the data in the top left cell of the block is not sent in its entirety because it is likely to be similar to the preceding value and a short ‘difference’ code suffices for it.
MPEG process
Fig. 12.8 summarises the processes described so far, all of which, except the first A−D conversion, are concerned with data compres- sion and bit-rate reduction in a way which retains as much as pos- sible of the integrity of the picture while reducing the amount of data to as little as 2% of the original. The final bit-rate is dictated by several factors: the bandwidth of the transmission channel or stor- age capacity of the recording medium; the picture quality required, which relates to screen size among other things; and the programme material, in terms of its content, detail and movement. There is a commercial factor here, too: spectrum space is valuable!
For any given system the bit-rate needs to be constant for transmission. This is regulated by the buffer store at the right of the diagram of Fig. 12.8. On ‘busy’ pictures it becomes full and must be protected against overflow by the data-rate control feedback system, whose effect is to slow things down by reducing the number of quantisation levels temporarily and thus bringing down the resolution of the section of picture being processed at the time.


