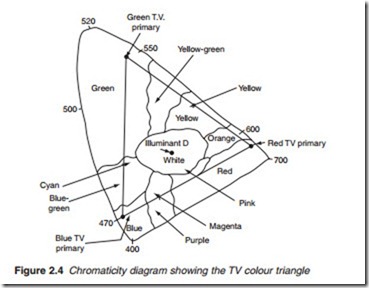
Chromaticity diagram
The complete set of colours is represented by what is known as the chro- maticity diagram illustrated in Figure 2.4. Real colours all fall along the curved part of horseshoe-shaped diagram which lies within the triangle. The curved part of the horseshoe is calibrated to show the wavelength in nanometres (nm) of the spectral colours, i.e. colours that are present on the visible electromagnetic spectrum. The colours between red and blue have no wavelength references, being ‘non-spectral’ colours resulting from a mix of components from opposite ends of the visible light spectrum.
Colours produced by the television system described by the colour triangle falls within the horseshoe.
Colour temperature
It is difficult to define just what ‘white’ light is! The appearance of white light depends entirely on the strength of each of the primary components. What is construed as white light is invariably bluish. Many monochrome picture tubes glow with a bluish, rather cold white, the result of a pre- dominance of high frequencies in the rendered light spectrum; this is because of the type of phosphor used.
Colour ‘temperature’ provides a means to define white and other colours. Colour temperature is defined as the temperature in Kelvin to which a ‘black’ radiating body has to be raised to emit a certain light such as white light. For instance, the reddish light of a candle has a colour temperature of 1200 K, white light has a temperature around 5500 K and the blue colour of a hazy sky has a temperature of 8000 K. It will be noticed that a red light has lower colour temperature than a blue light. For TV applications white light at 6500 K, which is ‘standard daylight’ referred to as illuminant D6500, has been adopted as a standard. Illuminant D6500 is shown in the centre of white area of the chromaticity diagram (Figure 2.4).
