Introduction
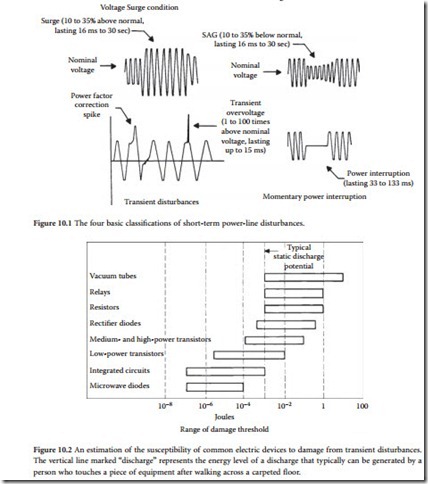
Short-term ac voltage disturbances can be classified into four major categories, as illustrated in Figure 10.1. The categories are defined according to peak value and duration:
• Voltage surge: An increase of l0 to 35% above the nominal line voltage for a period of 16 ms to 30 s.
• Voltage sag: A decrease of 10 to 35% below the nominal line voltage for a period of 16 ms to 30 s.
• Transient disturbance: A voltage pulse of high energy and short duration impressed upon the ac waveform. The overvoltage pulse can be 1 to 100 times the nominal ac potential and can last up to 15 ms. Rise times measure in the nanosecond range.
• Momentary power interruption: A decrease to zero voltage of the ac power-line potential, lasting from 33 to 133 ms. Longer-duration interruptions are considered power outages.
Voltage surges and sags occasionally result in operational problems for equipment on-line, but automatic protection or correction circuits generally take appropriate actions to ensure that there is no equipment damage. Such disturbances can, however, garble computer system data if the disturbance transition time (the rise/fall time of the disturbance) is sufficiently fast. System hardware also may be stressed if there is only a marginal power supply reserve or if the disturbances are frequent.
Momentary power interruptions can cause a loss of volatile memory in computer-driven systems and place severe stress on hardware components, especially if the ac supply is allowed to surge back automatically without soft-start provisions. Successful system reset may not be accomplished if the interruption is suffi- ciently brief.
Although voltage sags, surges, and momentary interruptions can cause operational problems for equipment used today, the possibility of complete system failure because of one of these mechanisms is relatively small. The greatest threat to the proper operation of electronic equipment rests with transient overvoltage disturbances on the ac line. Transients are difficult to identify and difficult to eliminate. Many devices commonly used to correct sag and surge conditions, such as ferroresonant transformers or motor-driven autotransformers, are of limited value in protecting a load from high-energy, fast-rise-time disturbances.
In the computer industry, research has shown that a significant number of unexplained problems resulting in disallowed states of operation actually are caused by transient disturbances on the utility feed. With the increased use of microcomputers in industry, this consideration cannot be ignored. Because of the high potential that transient disturbances typically exhibit, they not only cause data and program errors, but also can damage or destroy electric components. This threat to electronic equipment involves sensitive inte- grated circuits and many other common devices, such as capacitors, transformers, rectifiers, and power semiconductors. Figure 10.2 illustrates the vulnerability of common components to high-energy pulses. The effects of transient disturbances on electronic devices are often cumulative, resulting in gradual deterioration and, ultimately, catastrophic failure.
Standards of Measurement
Various test procedures and standards have been developed to enable system designers to evaluate the effectiveness of proposed protective measures. These range from simulation of lightning currents, volt- ages, and electric and magnetic fields to the generation of typical lightning-induced current and voltage transients expected to appear at the terminals of electronic equipment. Damaging effects can be divided into two basic categories:
• Direct effects: Damage to metal and insulator surfaces, and ignition of flammable vapors resulting from direct lightning attachment.
• Indirect effects: Damage resulting from the currents and voltages induced in internal circuits by lightning that has struck the exterior of a structure or a vehicle.
Because it is difficult to assess the threat posed by transient disturbances without guidelines on the nature of transients in ac power systems, a number of separate standards have been developed for individual component groups. The best known was developed by a working group of the Institute of Electrical and Electronics Engineers (IEEE) to simulate indirect lightning effects. IEEE suggested two waveforms, one unidirectional and the other oscillatory, for measuring and testing transient suppression components and systems in ac power circuits with rated voltages of up to 1 kV rms line-to-ground. The guidelines also recommend specific source impedance or short-circuit current values for transient analysis.
The voltage and current amplitudes, waveshapes, and source impedance values suggested in the American National Standards Institute/IEEE guide (ANSI/IEEE standard C62.41-1980) were designed to approximate the vast majority of high-level transient disturbances, but were not intended to represent worst-case conditions — a difficult parameter to predict. The timing of a transient overvoltage with respect to the power line waveform is also an important parameter in the examination of ac disturbances. Certain types of semiconductors exhibit failure modes that are dependent on the position of a transient on the sine wave.
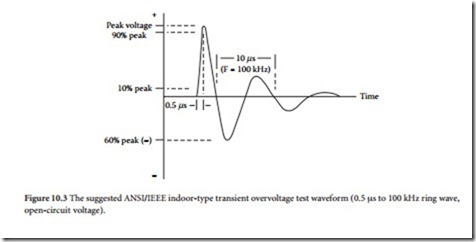
Figure 10.3 shows the ANSI/IEEE representative waveform for an indoor-type spike (for 120 to 240 Vac systems). Field measurements, laboratory observations, and theoretical calculations have shown that most transient disturbances in low-voltage indoor ac power systems have oscillatory waveshapes, instead of the unidirectional wave most often thought to represent a transient overvoltage. The oscillatory nature of the indoor waveform is the result of the natural resonant frequencies of the ac distribution system. Studies by the IEEE show that the oscillatory frequency range of such disturbances extends from 30 Hz to 100 kHz, and that the waveform changes, depending upon where it is measured in the power distribution system.
The waveform shown in Figure 10.3 is the result of extensive study by the IEEE and other indepen- dent organizations of various ac power circuits. The representative waveshape for 120 and 240 V systems is described as a 0.5 μs to 100 kHz ring wave. This standard indoor spike has a rise time of 0.5 μs, then decays while oscillating at 100 kHz. The amplitude of each peak is approximately 60% of the preceding peak.
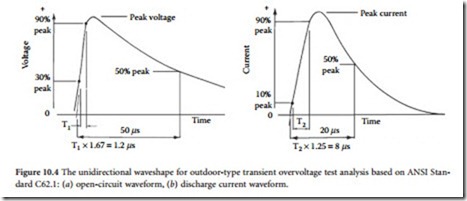
Figure 10.4 shows the ANSI/IEEE representative waveforms for an outdoor-type spike. The classic lightning overvoltage pulse has been established at a 1.2/50 μs waveshape for a voltage wave and an 8/20 μs waveshape for a current wave. Accordingly, the ANSI/IEEE standard waveshape is defined as 1.2/50 μs open-circuit voltage (voltage applied to a high-impedance device), and 8/20 μs discharge current (cur- rent in a low-impedance device).
The test waveshapes, although useful in the analysis of components and systems, are not intended to represent all transient patterns seen in low-voltage ac circuits. Lightning discharges can cause oscillations, reflections, and other disturbances in the utility company power system that can appear at the service drop entrance as decaying oscillations.
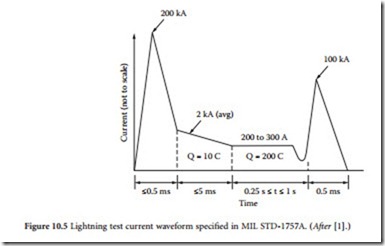
Unfortunately, most lightning disturbance standard waveforms address one or two characteristics of a discharge. Furthermore, standard waveforms are intended to represent typical events, not worst-case events. In testing to determine the immunity of a system to a direct lightning strike, a conservative approach is generally taken, in that the characteristics of a relatively severe flash are adopted. Figure 10.5 shows a test waveform specified for aerospace vehicles (MIL-STD-1757A). The current waveform includes one initial and one subsequent stroke, between which flows continuing current. Peak currents are 200 kA for the first stroke and 100 kA for the subsequent stroke. The total charge transfer is in excess of 200 C.
Assessing the Threat
High-speed digital ac line monitoring instruments provide a wealth of information on the quality of incoming utility power at a facility. Such instruments have changed the business of assessing the threat posed by unprocessed ac from an educated guess to a fine science. Sophisticated monitoring equipment can give the user a complete, detailed look at what is coming in from the power company. Such monitor- ing devices provide data on the problems that can be expected when operating data processing, commu- nications, or other sensitive electronic equipment from an unprotected ac line. Power-quality surveys are available from a number of consulting firms and power-conditioning companies. The typical procedure involves installing a sophisticated voltage-monitoring unit at the site to be used for a period of several weeks to several months. During that time, data is collected on the types of disturbances the load equip- ment is likely to experience.
The type of monitoring unit used is of critical importance. It must be a high-speed system that stores disturbance data in memory and delivers a printout of the data on demand. Conventional chart recorders are too slow and lack sufficient sensitivity to accurately show short-duration voltage disturbances. Chart recorders can confirm the presence of long-term surge and sag conditions, but provide little useful data on transients.
Fundamental Measurement Techniques
Most power system measurements involve characterizing fundamental parameters. These include volt- age, phase, and frequency. Most other tests consist of measuring these fundamental parameters and dis- playing the results in combination by using some convenient format. Measurements are made on equipment and systems to check performance under specified conditions and to assess suitability for use in a particular application. The measurements can be used to verify specified system performance or as a way of comparing several pieces of equipment for use in a system. Measurements can also be used to identify components in need of adjustment or repair.
Measurement of voltage is fundamental to ac operation. Voltage can be measured either in absolute terms or in relative terms. Power demand is an example of an absolute level measurement; it does not require any reference. Gain and loss are examples of relative, or ratio, measurements.
Distortion measurements are a way of quantifying the amount of unwanted components added to a signal by a piece of equipment. The most common technique is total harmonic distortion (THD), but others can be used. Distortion measurements express the amount of unwanted signal components relative to the desired signal, usually as a percentage or decibel value. This is another example of multiple level measurements that are combined to give a new measurement figure.
The simplest definition of a level measurement is the alternating current amplitude at a particular place in the system under test. However, in contrast to direct current measurements, there are many ways of specifying ac voltage. The most common methods include:
• Root-mean-square
• Average response
• Peak
Root-Mean-Square
The rms technique measures the effective power of the ac signal. It specifies the value of the dc equivalent that would dissipate the same power if either were applied to a load resistor. This process is illustrated in Figure 10.6. The input signal is squared, and the average value is found. This is equivalent to finding the average power. The square root of this value is taken to transfer the signal from a power value back to a voltage. For the case of a sine wave, the rms value is 0.707 of its maximum value.
Assume that the signal is no longer a sine wave, but rather a sine wave and several harmonics. If the rms amplitude of each harmonic is measured individually and added, the resulting value will be the same
Note that the result is not dependent on the phase relationship of the signal and its harmonics. The rms value is determined completely by the amplitude of the components. This mathematical predictability is useful in practical applications of level measurement, enabling measurements made at different places in a system to be correlated. It is also important in correlating measurements with theoretical calculations.
Average-Response Measurement
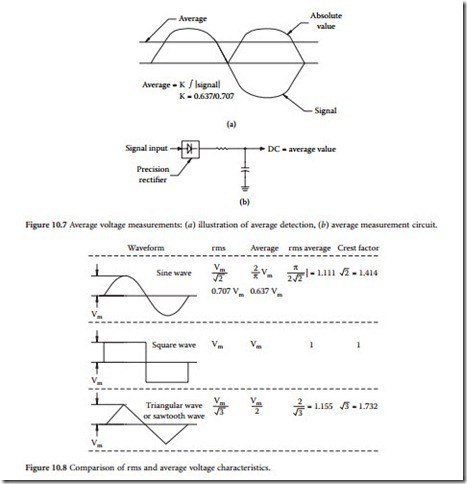
The average-responding voltmeter measures ac voltage by rectifying it and filtering the resulting wave- form to its average value, as shown in Figure 10.7. This results in a dc voltage that can be read on a standard dc voltmeter. As shown in the figure, the average value of a sine wave is 0.637 of its maximum amplitude. Average-responding meters are usually calibrated to read the same as an rms meter for the case of a single sine wave signal. This results in the measurement being scaled by a constant K of 0.707/ 0.637, or 1.11. Meters of this type are called average-responding, rms calibrated. For signals other than sine waves, the response will be different and hard to predict.
If multiple sine waves are applied, the reading will depend on the phase shift between the components and will no longer match the rms measurement. A comparison of rms and average-response mea- surements is made in Figure 10.8 for various waveforms. If the average readings are adjusted as described previously to make the average and rms values equal for a sine wave, all the numbers in the average column should be increased by 11.1%, whereas the rms-average numbers are reduced by 11.1%.
Peak-Response Measurement
Peak-responding meters measure the maximum value that the ac signal reaches as a function of time. This approach is illustrated in Figure 10.9. The signal is full-wave-rectified to find its absolute value and then passed through a diode to a storage capacitor. When the absolute value of the voltage rises above the
value stored on the capacitor, the diode will conduct and increase the stored voltage. When the voltage decreases, the capacitor will maintain the old value. Some means for discharging the capacitor is required to allow measuring a new peak value. In a true peak detector, this is accomplished by a solid-state switch. Practical peak detectors usually include a large value resistor to discharge the capacitor gradually after the user has had a chance to read the meter.
The ratio of the true peak to the rms value is called the crest factor. For any signal but an ideal square wave, the crest factor will be greater than 1, as demonstrated in Figure 10.10. As the measured signal become more peaked, the crest factor increases.
The peak-equivalent sine is another method of specifying waveform amplitude. This value is the rms level of a sine wave having the same peak-to-peak amplitude as the signal under consideration. This is the peak value of the waveform scaled by the correction factor 1.414, corresponding to the peak-to-rms ratio of a sine wave. This technique is useful when specifying test levels of waveforms in distortion measure- ment.
Meter Accuracy
Accuracy is a measure of how well an instrument quantifies a signal at a midband frequency. This sets a basic limit on the performance of the meter in establishing the absolute amplitude of a waveform. It also is important to look at the flatness specification to see how well this performance is maintained with changes in frequency. Flatness describes how well the measurements at any other frequency track those at the reference.
Meters often have a specification on accuracy that changes with voltage range, being most accurate only in the range in which the instrument was calibrated. A meter with 1% accuracy on the 2 V range and 1% accuracy per step would be 3% accurate on the 200 V scale. In many instruments, an additional accu- racy derating is given for readings as a% age of full scale, making readings at less than full scale less accu- rate.
Digital Measurement Instruments
Power quality monitors are sophisticated instruments that can not only identify ac power problems, but also provide the following useful supplementary data, including:
• Ambient temperature
• Relative humidity
• Presence of radio frequency interference (RFI)
• Sample voltage monitoring for ac and dc test points
• Harmonic distortion content of the ac input signal
Digital technology offers a number of significant advantages beyond the capabilities of analog instruments. Digital ac line monitors can store in memory the signal being observed, permitting in-depth analysis impossible with previous technologies. Because the waveform resides in memory, the data associated with the waveform can be transferred to a remote computer for real-time processing, or for processing at a later time.
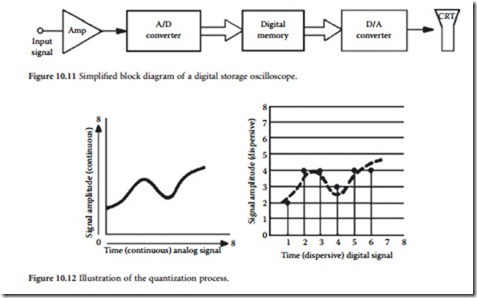
The digital storage oscilloscope (DSO) is the forerunner of most digital ac line monitors. DSO technology forms the basis for most monitoring instruments. Figure 10.11 shows a block diagram of a DSO. Instead of being amplified and applied directly to the deflection plates of a cathode ray tube (CRT), the waveform first is converted into a digital representation and stored in memory. To reproduce the wave- form on the CRT, the data is sequentially read and converted back into an analog signal for display.
The analog-to-digital (A/D) converter transforms the input analog signal into a sequence of digital bits. The amplitude of the analog signal, which varies continuously in time, is sampled at preset intervals. The analog value of the signal at each sample point is converted into a binary number. This quantization process is illustrated in Figure 10.12. The sample rate of a digital oscilloscope must be greater than two times the highest frequency to be measured. The higher the sampling rate relative to the input signal, the greater the measurement accuracy. A sample rate ten times the input signal is sufficient for most applications. This rule of thumb applies for single-shot signals, or signals that are changing constantly. The sample rate also can be expressed as the sampling interval, or the period of time between samples. The sample interval is the inverse of the sampling frequency.
Digital Monitor Features
Advanced components and construction techniques have led to lower costs for digital instruments as well as higher performance. Digital monitors can capture and analyze transient signals from any number of sources. Automated features reduce testing and troubleshooting costs through the use of recallable instrument setups, direct parameter readout, and unattended monitoring. Digital monitors offer the following features:
• High resolution (determined by the quality of the analog-to-digital converter).
• Memory storage of digitized waveforms.
• Automatic setup for repetitive signal analysis. For complex multichannel configurations that are used often, front-panel storage/recall can save dozens of manual selections and adjustments. When multiple memory locations are available, multiple front-panel setups can be stored to save even more time.
• Auto-ranging. Many instruments will adjust automatically for optimum sweep, input sensitivity, and triggering. The instrument’s microprocessor automatically configures the front panel for optimum display. Such features permit the operator to concentrate on making measurements, rather than adjusting the instrument.
• Instant hardcopy output from printers and plotters.
• Remote programmability via GPIB or dial-up modem (including the Internet) for automated test applications.
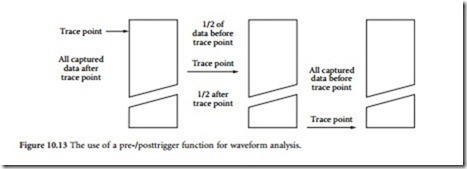
• Trigger flexibility. Single-shot digitizing monitors capture transient signals and allow the user to view the waveform that preceded the trigger point. Figure 10.13 illustrates the use of pre-/post- trigger for waveform analysis.
• Signal analysis. Intelligent systems can make key measurements and comparisons. Display capabilities include voltage peak, mean voltage, rms value, rise time, fall time, and frequency.
Digital memory storage offers a number of additional benefits, including:
• Reference memory. A previously acquired waveform can be stored in memory and compared with a sampled waveform. This feature is especially useful for identifying the source of a transient disturbance. Because certain transients have a characteristic “signature” waveform, it is possible to identify the source of a transient by examining an image of the disturbance on a CRT or suitable device. Nonvolatile battery-backed memory permits reference waveforms to be transported to field sites.
• Simple data transfers to a host computer for analysis or archive.
• Local data analysis through the use of a built-in microprocessor.
• Cursors capable of providing a readout of delta and absolute voltage and time.
• Full bandwidth capture of long-duration waveforms, thus permitting storage of all the signal details. The waveform can be expanded after capture to expose the details of a particular section.
