IMAGE SENSOR FACEPLATE CONFIGURATIONS
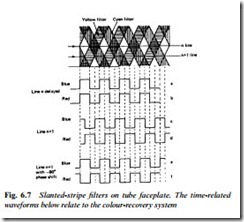
Where it is required to get a full colour picture from a single image- sensor, there are several ways of arranging the colour filter on its faceplate. One of several variants is shown in Fig. 6.7. Here the stripes run slantwise across the sensor face, yellow stripes (passing R and G) alternating with clear stripes in one direction, and cyan stripes (passing B and G) alternating with clear stripes in the other direction. At stripe crossover points only G light is permitted through to the faceplate. Consider the output signal during a random line n. It consists, as the line is scanned, of white (which is RGB), G, RGB etc. On the line n + 1 below, the output sequence will be yellow, cyan, yellow, cyan, yellow etc., which is R + G, B + G, R + G, B + G etc. as shown in Fig. 6.7. The angle of the stripes is arranged such that the resultant from the yellow stripes comes 90° earlier with each successive line scan, while the resultant from the cyan stripes comes 90° later with each successive line scan. This gives rise to the offset between rows a/b and c/d in Fig. 6.7. Row a is the blue output for line n, and row b the red output for line n. When this signal is passed through a 1-line delay it will be available at the same time as the signals for line n + 1, whose blue output is drawn in row c and whose red output is drawn in row d. Passing line n + 1 through a simple 90°
phase shift network renders waveforms e and f for blue and red respectively. It can be seen that whereas the B and R signals are in phase (i.e. time-coincident) in the delayed line n signal (rows a and b) they are in antiphase at the output of the 90° phase shift network. Since the delay line has ‘stored’ row a/b for exactly one scanning line, it and row e/f are simultaneously available. Adding row a/b to row e/f will render 2 B (in-phase signals) while anti-phase R signals cancel out: at the adder output pure B appears. Subtracting row a/b from row e/f renders 2 R (R – [−R]) while B cancels out (B – B = 0): at the subtractor output pure R appears. A more detailed account of delay- line matrix systems appears in the next chapter.
Since green is present at all times (no colour filter in Fig. 6.7 stops G) it would appear that its presence would upset the B and R phase- recovery system. It does not, because whereas the B and R chroma signals appear at a high frequency of 3.9 MHz (the product of the line ‘scanning rate’ and the stripe repetition frequency), the constant G signal has no such high frequency carrier, and is lost in a band- pass filter centred on 3.9 MHz.
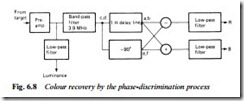
Fig. 6.8 shows the essentials of the phase system of colour recovery. The signal is first preamplified in a low-noise stage, then passed into two filters. A low-pass filter with response up to about 3 MHz
separates off the mean signal to give a luminance output for process- ing in the Y channel. The B and R chrominance signals are picked off in the 3.9 MHz filter and applied to the 1 H delay line and 90° phase shifter for separation in the adder and subtractor. Their outputs are integrated in a low-pass filter which eliminates the 3.9 MHz car- rier and renders smooth, pure B and R chrominance signals for application to the encoder section described earlier. The letters at circuit points in Fig. 6.8 relate to the waveform rows in Fig. 6.7. There is no true subtractor circuit artifice available; in fact the subtractor stage works on an invert-and-add principle, which achieves the same result.
The phase-detection colour recovery system works well, but the necessity for the scanning lines to coincide with the crossover of the stripe-filter matrix on the faceplate means that the sensor must be designed and specified for the scanning standards to be used.
Step-energy colour recovery
The use of vertical RGB filter stripes in conjunction with a segmented target was described earlier in this chapter. An alternative vertical striping system was pictured in Fig. 5.16 with the primary-colour steps which appear in the output signal from the target. This arrangement is also applicable to solid-state image sensors. The combination of horizontal scanning rate and stripe spacing (hence repetition frequency) gives to the colour signals a carrier frequency of about
4.1 MHz. There are two possible methods of recovering R and B baseband chroma signals from the step waveform. The first (Fig. 6.9(a)) requires opposite-polarity rectifiers working on the upper and lower envelope profiles followed by add/subtract matrices to recover R−Y and B−Y signals. The second (Fig. 6.9(b)) involves the use of 4.1 MHz (fundamental) and 8.2 MHz (2nd harmonic) bandpass filters; the 8.2 MHz signal is amplitude-limited and its phase compared with that of the fundamental (4.1 MHz) component. Further filtering take place before application to add/subtract
matrices, which render modulated R and B carrier signals, restored to baseband by a synchronous demodulator for each.
Frequency discrimination colour recovery
Another faceplate-filter stripe configuration is shown in Fig. 6.10(a). In this case the filter colours are red and blue, and their widths are typically 61 μm for red, 47 μm for blue. This gives rise to different carrier frequencies for R and B; to further reduce crosstalk between the two the angle from vertical is made +15° for R and −20° for B. The result, at 625-line scanning rate, is a carrier frequency of 3.9 MHz for R and 5.1 MHz for B. The colour-recovery circuits here are very simple as Fig. 6.10(b) shows, but the performance of this arrange- ment is not as good as more sophisticated systems.


