SYMPTOM ANALYSES
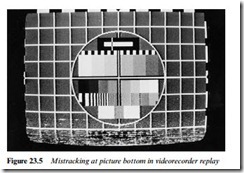
Fig. 23.5 shows a snow-and-noise bar across the extreme bottom of a videorecorder playback picture from a known-good tape. The effect is due to mistracking, and because it is confined to one section of the picture it is unlikely to be due to a servo fault, or maladjustment of the tracking control. The bottom of the picture corresponds to the top half of the tape ribbon, and is read out by the head as the tape leaves the head wrap. The implication is that the tape exit angle from the drum is wrong, and it is likely that the trouble is confined to the exit guide or the adjacent section of head rabbet. The need for cleaning and position checking is more likely than a need for height adjustment unless the guide is loose or has been disturbed.
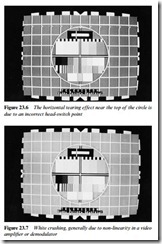
In Fig. 23.6 appears another videorecorder fault, this time in the form of a glass-like bar of picture disturbance on replay of a tape recorded in a faulty machine. In fact the bar is the visible effect of a wrongly timed head-switch point during record. Normally it is hid- den at the bottom of the picture by the action of the head-drum servo which should ensure that the changeover point takes place at a point
in time just before the field sync pulses. If the offending bar is stationary the first check should be on the setting of the record switch- point preset and the monostable it controls. If the bar drifts up or down, an unlocked head servo is indicated; the correct action then is to check for correct playback servo lock on a known-good record- ing. If good lock is achieved the likelihood is that off-air field syncs are not reaching the head servo during record. If not, the head servo itself is suspect, and a first check would be for correct output pulses from the drum tachogenerator.
The display of Fig. 23.7 is symptomatic of white crushing, and could arise in a camera, TV set, monitor or videorecorder. It can normally only take place in a video signal amplifier, and the trouble source is easily traced with an oscilloscope, progressively checking the video waveform until the non-linearity becomes evident. At this point the bias, supply voltage, input level and feedback arrangements should be checked.
It is possible for the symptom to arise from overdeviation of an f.m. modulator or signal distortion (‘bottom crushing’) in an a.m.
i.f. amplifier − check bias and a.g.c. voltages.
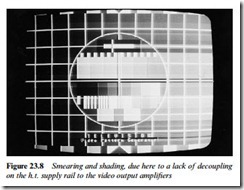
Another video-stage fault is pictured in Fig. 23.8. The picture is heavily shaded from left to right and badly smeared. An immediate conclusion is that the luminance signal(s) is deeply modulated at line rate, and that it stems from a large ripple on some l.o.p.t.-derived power supply line. The most heavily loaded and worked is that for the 180 V or 200 V h.t. supply for the RGB output stages.
Most sets use flyback rectification to derive this supply, and since the picture is dark (high supply voltage) at left, which immediately follows flyback, and brightens (low supply voltage) as line scan progresses, the obvious conclusion is that the 180/200V -line reservoir is low capacitance due to leakage or drying up.
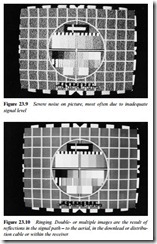
The display of Fig. 23.9 is a familiar one, and is due to a poor S/N ratio in the vision signal. First check (preferably with another TV) that aerial signal strength is adequate, and that the r.f. connections to the tuner are correct. If so, the next check should be of the applied voltage to the tuner, sometimes easiest done by applying a known correct voltage to the a.g.c. input pin. The persistence of the symptom with correct gain-control voltage incriminates the tuner, whereas restoration of a good picture shows that the r.f. a.g.c. circuit (or its control pot) is in need of attention. Any ‘low gain’ fault which gives this degree of noise must invariably be in an early stage of the signal-handling circuits; low gain in the final i.f. amplifier stage or in post-demodulator circuits gives a flat ‘milky’ picture rather than a snowy one.
The multiple images of Fig. 23.10 illustrate a case where the TV screen is better diagnostic instrument than any piece of test equipment. The problem here is due to signal reflections, and the strength and position of the ghost image with respect to the main one indicates the amplitude and delay of the reflected signal, the latter easily calculated on the basis of 1 μs equals 1⁄52 picture width, which can then be expressed if required in terms of signal path length.
While ghost images can arise from reflection of the UHF signal from hills, tall buildings etc., they can be generated within the equipment: this photo was taken with the ground connection of the luminance delay line open to give multiple reflections along the line.
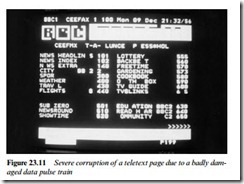
A likely effect of much shorter-term signal reflections appears in Fig. 23.11. Here a page of text shows corruption, in which the incorrect and missing characters result from misinterpretation of data. It can be caused by a faulty text decoder, but this is unlikely where its
power line, grounding and video input signal level are correct. Apart from an eyeheight check with a ’scope on the data lines, see Chapter 8, little can be done with ordinary test instruments. If the r.f. tuning and vision demodulator ‘tank’ coil tuning are correct, here is a justifiable case for testing by substitution – starting, perhaps, with a complete text-equipped TV set, because the aerial, distribution system, and downlead or feeder are prime suspects in these cases.
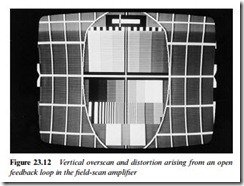
Moving onto the timebase sections of a TV or monitor, a picture display like that of Fig. 23.12 again rewards careful analysis with an almost certain diagnosis. Here the screen is grossly overscanned in the vertical direction, with evidence of bad non-linearity. This indicates a large increase in the power applied to the field scanning coils. Of several possible causes, those of an increase in the intrinsic gain of the field amplifier, or a large rise in the supply rail voltage to the field timebase are very unlikely; in the latter case, other symptoms would probably be present.
An increase in generated ramp height is again unlikely, and could be quickly checked with an oscilloscope. The first check, though, should be made at the main output negative feedback loop which here is open-circuit.
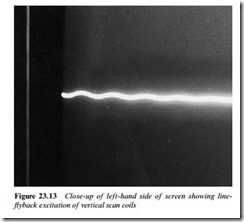
The opposite effect, field collapse, is the subject of Fig. 23.13. Care- ful study of the resulting single scanning line, however, reveals a slight undulation of the line at the extreme left, and this is the effect of a ringing pulse induced into the field scan coils from the line-scan pair
at flyback. This arises from a lack of damping in the field coil circuit, and is indicative of an open yoke circuit. The field scan coils themselves are rarely responsible, and investigation is generally confined to the coupling components between coils and output stage. A single vertical white line, where scan and e.h.t. are derived from the same flyback transformer, is likewise indicative of a break in the immediate circuit of the scan coil, typically due to a defective or dryjointed S-correction capacitor or scan-balance coil.
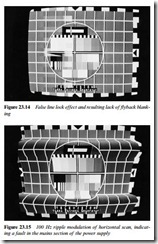
A line timebase fault is depicted in Fig. 23.14. The basic problem here is a gross timing error between line scan and video signal, caus- ing the line blanking period to appear on the screen. Its likely causes are perhaps less obvious without some thought. It is seldom possible for this error to arise in the line sync phase detector itself in a flywheel system; much more probable is that either its reference (incoming line sync) or feedback (line flyback) pulses are suffering an abnormal time delay. A check with a dual-trace scope will probably eliminate the former, and identify a problem in the pulse-feedback circuit between l.o.p.t. and line sync chip. A change in resistor value or leak- age in a capacitor is often responsible.
Faults in PSU systems are common, and while many of them result in complete loss of picture and sound, others give a display symptom which immediately identifies the fault area, and sometimes the actual component. Fig. 23.15 shows one such. The picture has two ‘wasp- waists’ which shows that the main power line bears a strong 100 Hz
ripple. This can only come from a full-wave mains rectifier system, and is almost certainly due to failure of the primary reservoir capacitor in the PSU. The bulging effect will generally move slowly up or down the screen because mains a.c. is not synchronous with TV transmissions.
A single wasp-waist is an almost certain indication that one of the four diodes in the rectifier bridge is open, resulting in half-wave rectification.
The screen image shown in Fig. 23.16 shows horizontal overscan, which would most likely be due to a fault in the flyback tuning of the line output transformer (check the capacitor(s) across the line output transistor c−e junction); a fault or maladjustment in the E−W raster correction circuit (start by checking whether the width control works); or an increase in supply voltage to the line output stage. While the latter possibility should certainly be checked, it is an unlikely one because the PSU over-voltage protection would normally prevent the fault being displayed.
