Data representation: introduction and fixed point numbers ( range and precision in fixed point numbers, the associative law of algebra does not always hold in computers, conversions among radices, an early look at computer arithmetic, signed fixed point numbers and binary coded decimal).

DATA REPRESENTATION

2.1 Introduction

In the early days of computing, there were common misconceptions about computers. One misconception was that the computer was only a giant adding machine performing arithmetic operations. Computers could do much more than that, even in the early days. The other common misconception, in contra- diction to the first, was that the computer could do “anything.” We now know that there are indeed classes of problems that even the most powerful imaginable computer finds intractable with the von Neumann model. The correct perception, of course, is somewhere between the two.

We are familiar with computer operations that are non-arithmetic: computer graphics, digital audio, even the manipulation of the computer mouse. Regard- less of what kind of information is being manipulated by the computer, the information must be represented by patterns of 1’s and 0’s (also known as “on-off ” codes). This immediately raises the question of how that information should be described or represented in the machine—this is the data representation, or data encoding. Graphical images, digital audio, or mouse clicks must all be encoded in a systematic, agreed-upon manner.

We might think of the decimal representation of information as the most natural when we know it the best, but the use of on-off codes to represent information predated the computer by many years, in the form of Morse code.

This chapter introduces several of the simplest and most important encodings: the encoding of signed and unsigned fixed point numbers, real numbers (referred to as floating point numbers in computer jargon), and the printing characters. We shall see that in all cases there are multiple ways of encoding a given kind of data, some useful in one context, some in another. We will also take an early look at computer arithmetic for the purpose of understanding some of the encoding schemes, though we will defer details of computer arithmetic until Chapter 3.

In the process of developing a data representation for computing, a crucial issue is deciding how much storage should be devoted to each data value. For example, a computer architect may decide to treat integers as being 32 bits in size, and to implement an ALU that supports arithmetic operations on those 32-bit values that return 32 bit results. Some numbers can be too large to represent using 32 bits, however, and in other cases, the operands may fit into 32 bits, but the result of a computation will not, creating an overflow condition, which is described in Chapter 3. Thus we need to understand the limits imposed on the accuracy and range of numeric calculations by the finite nature of the data representations. We will investigate these limits in the next few sections.

2.2 Fixed Point N umbers

In a fixed point number system, each number has exactly the same number of digits, and the “point” is always in the same place. Examples from the decimal number system would be 0.23, 5.12, and 9.11. In these examples each number has 3 digits, and the decimal point is located two places from the right. Examples from the binary number system (in which each digit can take on only one of the values: 0 or 1) would be 11.10, 01.10, and 00.11, where there are 4 binary digits and the binary point is in the middle. An important difference between the way that we represent fixed point numbers on paper and the way that we represent them in the computer is that when fixed point numbers are represented in the computer the binary point is not stored anywhere, but only assumed to be in a certain position. One could say that the binary point exists only in the mind of the programmer.

We begin coverage of fixed point numbers by investigating the range and precision of fixed point numbers, using the decimal number system. We then take a look at the nature of number bases, such as decimal and binary, and how to convert between the bases. With this foundation, we then investigate several ways of representing negative fixed point numbers, and take a look at simple arithmetic operations that can be performed on them.

2.2.1 RANGE AND PRECISION IN FIXED POINT NUMBERS

A fixed point representation can be characterized by the range of expressible numbers (that is, the distance between the largest and smallest numbers) and the

precision (the distance between two adjacent numbers on a number line.) For the fixed-point decimal example above, using three digits and the decimal point placed two digits from the right, the range is from 0.00 to 9.99 inclusive of the endpoints, denoted as [0.00, 9.99], the precision is .01, and the error is 1/2 of the difference between two “adjoining” numbers, such as 5.01 and 5.02, which have a difference of .01. The error is thus .01/2 = .005. That is, we can represent any number within the range 0.00 to 9.99 to within .005 of its true or precise value.

Notice how range and precision trade off: with the decimal point on the far right, the range is [000, 999] and the precision is 1.0. With the decimal point at the far left, the range is [.000, .999] and the precision is .001.

In either case, there are only 103 different decimal “objects,” ranging from 000 to 999 or from .000 to .999, and thus it is possible to represent only 1,000 different items, regardless of how we apportion range and precision.

There is no reason why the range must begin with 0. A 2-digit decimal number can have a range of [00,99] or a range of [-50, +49], or even a range of [-99, +0]. The representation of negative numbers is covered more fully in Section 2.2.6.

Range and precision are important issues in computer architecture because both are finite in the implementation of the architecture, but are infinite in the real world, and so the user must be aware of the limitations of trying to represent external information in internal form.

2.2.2 THE ASSOCIATIVE LAW OF ALGEBRA DOES NOT ALWAYS HOLD IN COMPUTERS

In early mathematics, we learned the associative law of algebra:

a + (b + c) = (a + b) + c

As we will see, the associative law of algebra does not hold for fixed point numbers having a finite representation. Consider a 1-digit decimal fixed point representation with the decimal point on the right, and a range of [-9, 9], with a = 7, b=4, and c=–3. Now a + (b + c) = 7 + (4 + –3) = 7 + 1 =8. But (a + b) + c = (7 + 4) + –3 = 11 + –3, but 11 is outside the range of our number system! We have overflow in an intermediate calculation, but the final result is within the number system. This is every bit as bad because the final result will be wrong if an inter-mediate result is wrong.

Thus we can see by example that the associative law of algebra does not hold for finite-length fixed point numbers. This is an unavoidable consequence of this form of representation, and there is nothing practical to be done except to detect overflow wherever it occurs, and either terminate the computation immediately and notify the user of the condition, or, having detected the overflow, repeat the computation with numbers of greater range. (The latter technique is seldom used except in critical applications.)

2.2.3 RADIX NUMBER SYSTEMS

In this section, we learn how to work with numbers having arbitrary bases, although we will focus on the bases most used in digital computers, such as base 2 (binary), and its close cousins base 8 (octal), and base 16 (hexadecimal.)

The base, or radix of a number system defines the range of possible values that a digit may have. In the base 10 (decimal) number system, one of the 10 values: 0, 1, 2, 3, 4, 5, 6, 7, 8, 9 is used for each digit of a number. The most natural sys- tem for representing numbers in a computer is base 2, in which data is represented as a collection of 1’s and 0’s.

The general form for determining the decimal value of a number in a radix k fixed point number system is shown below:

image

The value of the digit in position i is given by bi. There are n digits to the left of the radix point and there are m digits to the right of the radix point. This form of a number, in which each position has an assigned weight, is referred to as a weighted position code. Consider evaluating (541.25)10, in which the subscript 10 represents the base. We have n = 3, m = 2, and k = 10:

image

Now consider the base 2 number (1010.01)2 in which n = 4, m = 2, and k = 2:

imageThis suggests how to convert a number from an arbitrary base into a base 10 number using the polynomial method. The idea is to multiply each digit by the weight assigned to its position (powers of two in this example) and then sum up the terms to obtain the converted number. Although conversions can be made among all of the bases in this way, some bases pose special problems, as we will see in the next section.

Note: in these weighted number systems we define the bit that carries the most weight as the most significant bit (MSB), and the bit that carries the least weight as the least significant bit (LSB). Conventionally the MSB is the left- most bit and the LSB the rightmost bit.

2.2.4 CONVERSIONS AMONG RADICES

In the previous section, we saw an example of how a base 2 number can be converted into a base 10 number. A conversion in the reverse direction is more involved. The easiest way to convert fixed point numbers containing both integer and fractional parts is to convert each part separately. Consider converting (23.375)10 to base 2. We begin by separating the number into its integer and fractional parts:

image

Converting the Integer Part of a Fixed Point Number—The Remainder Method

As suggested in the previous section, the general polynomial form for representing a binary integer is:

image

If we divide the integer by 2, then we will obtain:

image

with a remainder of b0. As a result of dividing the original integer by 2, we dis- cover the value of the first binary coefficient b0. We can repeat this process on the remaining polynomial and determine the value of b1. We can continue iterating the process on the remaining polynomial and thus obtain all of the bi. This process forms the basis of the remainder method of converting integers between bases.

We now apply the remainder method to convert (23)10 to base 2. As shown in Figure 2-1, the integer is initially divided by 2, which leaves a remainder of 0 or

image

1. For this case, 23/2 produces a quotient of 11 and a remainder of 1. The first remainder is the least significant binary digit (bit) of the converted number (the rightmost bit). In the next step 11 is divided by 2, which creates a quotient of 5 and a remainder of 1. Next, 5 is divided by 2, which creates a quotient of 2 and a remainder of 1. The process continues until we are left with a quotient of 0. If we continue the process after obtaining a quotient of 0, we will only obtain 0’s for the quotient and remainder, which will not change the value of the converted number. The remainders are collected into a base 2 number in the order shown in Figure 2-1 to produce the result (23)10 = (10111)2. In general, we can convert any base 10 integer to any other base by simply dividing the integer by the base to which we are converting.

We can check the result by converting it from base 2 back to base 10 using the polynomial method:

image

At this point, we have converted the integer portion of (23.375)10 into base 2.

Converting the Fractional Part of a Fixed Point Number—The Multiplication Method

The conversion of the fractional portion can be accomplished by successively multiplying the fraction by 2 as described below.

A binary fraction is represented in the general form:

image

We thus discover the coefficient b-1. If we iterate this process on the remaining fraction, then we will obtain successive bi. This process forms the basis of the multiplication method of converting fractions between bases. For the example used here (Figure 2-2), the initial fraction (.375)10 is less than 1. If we multiply it by 2, then the resulting number will be less than 2. The digit to the left of the radix point will then be 0 or 1. This is the first digit to the right of the radix point in the converted base 2 number, as shown in the figure. We repeat the process on the fractional portion until we are either left with a fraction of 0, at which point only trailing 0’s are created by additional iterations, or we have reached the limit of precision used in our representation. The digits are collected and the result is obtained: (.375)10 = (.011)2.

For this process, the multiplier is the same as the target base. The multiplier is 2 here, but if we wanted to make a conversion to another base, such as 3, then we

image

Non Terminating Fractions

Although this method of conversion will work among all bases, some precision can be lost in the process. For example, not all terminating base 10 fractions have a terminating base 2 form. Consider converting (.2)10 to base 2 as shown in Figure 2-3. In the last row of the conversion, the fraction .2 reappears, and the process repeats ad infinitum. As to why this can happen, consider that any non-repeating base 2 fraction can be represented as i/2k for some integers i and k. (Repeating fractions in base 2 cannot be so represented.) Algebraically,

image

image

where j is the integer i´5k. The fraction is thus non-repeating in base 10. This hinges on the fact that only non-repeating fractions in base b can be represented as i/bk for some integers i and k. The condition that must be satisfied for a non-repeating base 10 fraction to have an equivalent non-repeating base 2 fraction is:

image

where j = i/5k, and 5k must be a factor of i. For one digit decimal fractions, only (.0)10 and (.5)10 are non-repeating in base 2 (20% of the possible fractions); for two digit decimal fractions, only (.00)10, (.25)10, (.50)10, and (.75)10 are non-repeating (4% of the possible fractions); etc. There is a link between relatively prime numbers and repeating fractions, which is helpful in understanding why some terminating base 10 fractions do not have a terminating base 2 form. (Knuth, 1981) provides some insight in this area.

Binary versus Decimal Representations

While most computers use base 2 for internal representation and arithmetic, some calculators and business computers use an internal representation of base 10, and thus do not suffer from this representational problem. The motivation for using base 10 in business computers is not entirely to avoid the terminating fraction problem, however, but also to avoid the conversion process at the input and output units which historically have taken a significant amount of time.

Binary, Octal, and Hexadecimal Radix Representations

While binary numbers reflect the actual internal representation used in most machines, they suffer from the disadvantage that numbers represented in base 2 tend to need more digits than numbers in other bases, (why?) and it is easy to make errors when writing them because of the long strings of 1’s and 0’s. We mentioned earlier in the Chapter that base 8, octal radix, and base 16, hexadecimal radix, are related to base 2. This is due to the three radices all being divisible by 2, the smallest one. We show below that converting among the three bases 2, 8, and 16 is trivial, and there are significant practical advantages to representing numbers in these bases.

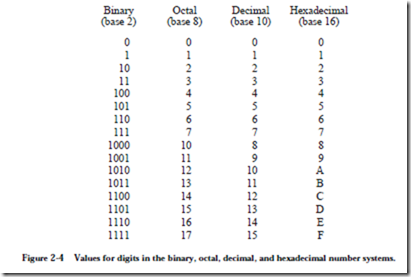
Binary numbers may be considerably wider than their base 10 equivalents. As a notational convenience, we sometimes use larger bases than 2 that are even multiples of 2. Converting among bases 2, 8, or 16 is easier than converting to and from base 10. The values used for the base 8 digits are familiar to us as base 10 digits, but for base 16 (hexadecimal) we need six more digits than are used in base 10. The letters A, B, C, D, E, F or their lower-case equivalents are commonly used to represent the corresponding values (10, 11, 12, 13, 14, 15) in hexadecimal. The digits commonly used for bases 2, 8, 10, and 16 are summarized in Figure 2-4. In comparing the base 2 column with the base 8 and base 16

image

columns, we need three bits to represent each base 8 digit in binary, and we need four bits to represent each base 16 digit in binary. In general, k bits are needed to represent each digit in base 2k, in which k is an integer, so base 23 = 8 uses three bits and base 24 = 16 uses four bits.

In order to convert a base 2 number into a base 8 number, we partition the base 2 number into groups of three starting from the radix point, and pad the outer- most groups with 0’s as needed to form triples. Then, we convert each triple to the octal equivalent. For conversion from base 2 to base 16, we use groups of four. Consider converting (10110)2 to base 8:

image

Notice that the leftmost two bits are padded with a 0 on the left in order to cre- ate a full triplet.

image

(Note that ‘B’ is a base 16 digit corresponding to 1110. B is not a variable.)

The conversion methods can be used to convert a number from any base to any other base, but it may not be very intuitive to convert something like (513.03)6 to base 7. As an aid in performing an unnatural conversion, we can convert to the more familiar base 10 form as an intermediate step, and then continue the conversion from base 10 to the target base. As a general rule, we use the polynomial method when converting into base 10, and we use the remainder and multi- plication methods when converting out of base 10.

2.2.5 AN EARLY LOOK AT COMPUTER ARITHMETIC

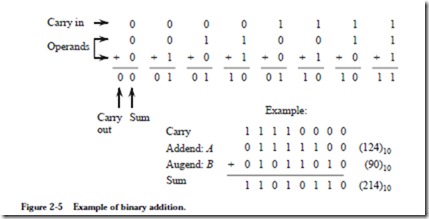
We will explore computer arithmetic in detail in Chapter 3, but for the moment, we need to learn how to perform simple binary addition because it is used in rep- resenting signed binary numbers. Binary addition is performed similar to the way we perform decimal addition by hand, as illustrated in Figure 2-5. Two binary numbers A and B are added from right to left, creating a sum and a carry in each bit position. Since the rightmost bits of A and B can each assume one of two values, four cases must be considered: 0 + 0, 0 + 1, 1 + 0, and 1 + 1, with a carry of 0, as shown in the figure. The carry into the rightmost bit position defaults to 0. For the remaining bit positions, the carry into the position can be 0

image

or 1, so that a total of eight input combinations must be considered as shown in the figure.

Notice that the largest number we can represent using the eight-bit format shown in Figure 2-5 is (11111111)2 = (255)10 and that the smallest number that can be represented is (00000000)2 = (0)10. The bit patterns 11111111 and 00000000 and all of the intermediate bit patterns represent numbers on the closed interval from 0 to 255, which are all positive numbers. Up to this point we have considered only unsigned numbers, but we need to represent signed numbers as well, in which (approximately) one half of the bit patterns is assigned to positive numbers and the other half is assigned to negative numbers. Four common representations for base 2 signed numbers are discussed in the next section.

2.2.6 SIGNED FIXED POINT NUMBERS

Up to this point we have considered only the representation of unsigned fixed point numbers. The situation is quite different in representing signed fixed point numbers. There are four different ways of representing signed numbers that are commonly used: sign-magnitude, one’s complement, two’s complement, and excess notation. We will cover each in turn, using integers for our examples. Throughout the discussion, the reader may wish to refer to Table 2.1 which shows for a 3-bit number how the various representations appear.

image

Signed Magnitude

The signed magnitude (also referred to as sign and magnitude) representation is most familiar to us as the base 10 number system. A plus or minus sign to the left of a number indicates whether the number is positive or negative as in +1210 or -1210. In the binary signed magnitude representation, the leftmost bit is used for the sign, which takes on a value of 0 or 1 for ‘+’ or ‘-’, respectively. The remaining bits contain the absolute magnitude. Consider representing (+12)10  and (-12)10 in an eight-bit format:

image

The negative number is formed by simply changing the sign bit in the positive number from 0 to 1. Notice that there are both positive and negative representations for zero: 00000000 and 10000000.

There are eight bits in this example format, and all bit patterns represent valid numbers, so there are 28 = 256 possible patterns. Only 28 – 1 = 255 different numbers can be represented, however, since +0 and -0 represent the same number.

We will make use of the signed magnitude representation when we look at floating point numbers in Section 2.3.

One’s Complement

The one’s complement operation is trivial to perform: convert all of the 1’s in the number to 0’s, and all of the 0’s to 1’s. See the fourth column in Table 2.1 for examples. We can observe from the table that in the one’s complement representation the leftmost bit is 0 for positive numbers and 1 for negative numbers, as it is for the signed magnitude representation. This negation, changing 1’s to 0’s and changing 0’s to 1’s, is known as complementing the bits. Consider again representing (+12)10 and (-12)10 in an eight-bit format, now using the one’s complement representation:

image

Note again that there are representations for both +0 and -0, which are 00000000 and 11111111, respectively. As a result, there are only 28 – 1 = 255 different numbers that can be represented even though there are 28 different bit patterns.

The one’s complement representation is not commonly used. This is at least partly due to the difficulty in making comparisons when there are two representations for 0. There is also additional complexity involved in adding numbers, which is discussed further in Chapter 3.

Two’s Complement

The two’s complement is formed in a way similar to forming the one’s complement: complement all of the bits in the number, but then add 1, and if that addition results in a carry-out from the most significant bit of the number, discard the carry-out. Examination of the fifth column of Table 2.1 shows that in the

two’s complement representation, the leftmost bit is again 0 for positive numbers and is 1 for negative numbers. However, this number format does not have the unfortunate characteristic of signed-magnitude and one’s complement representations: it has only one representation for zero. To see that this is true, con- sider forming the negative of (+0)10, which has the bit pattern:

(+0)10 = (00000000)2

Forming the one’s complement of (00000000)2 produces (11111111)2 and add- ing 1 to it yields (00000000)2, thus (-0)10 = (00000000)2. The carry out of the leftmost position is discarded in two’s complement addition (except when detecting an overflow condition). Since there is only one representation for 0, and since all bit patterns are valid, there are 28 = 256 different numbers that can be represented.

Consider again representing (+12)10 and (-12)10 in an eight-bit format, this time using the two’s complement representation. Starting with (+12)10 = (00001100)2, complement, or negate the number, producing (11110011)2. Now add 1, producing (11110100)2, and thus (-12)10 = (11110100)2:

(+12)10 = (00001100)2

(-12)10 = (11110100)2

There is an equal number of positive and negative numbers provided zero is considered to be a positive number, which is reasonable because its sign bit is 0. The positive numbers start at 0, but the negative numbers start at -1, and so the magnitude of the most negative number is one greater than the magnitude of the most positive number. The positive number with the largest magnitude is +127, and the negative number with the largest magnitude is -128. There is thus no positive number that can be represented that corresponds to the negative of -128. If we try to form the two’s complement negative of -128, then we will arrive at a negative number, as shown below:

image

The two’s complement representation is the representation most commonly used in conventional computers, and we will use it throughout the book.

Excess Representation

In the excess or biased representation, the number is treated as unsigned, but is “shifted” in value by subtracting the bias from it. The concept is to assign the smallest numerical bit pattern, all zeros, to the negative of the bias, and assign the remaining numbers in sequence as the bit patterns increase in magnitude. A convenient way to think of an excess representation is that a number is represented as the sum of its two’s complement form and another number, which is known as the “excess,” or “bias.” Once again, refer to Table 2.1, the rightmost column, for examples.

Consider again representing (+12)10 and (-12)10 in an eight-bit format but now using an excess 128 representation. An excess 128 number is formed by adding 128 to the original number, and then creating the unsigned binary version. For (+12)10, we compute (128 + 12 = 140)10 and produce the bit pattern (10001100)2. For (-12)10, we compute (128 + -12 = 116)10 and produce the bit pattern (01110100)2:

(+12)10 = (10001100)2

(-12)10 = (01110100)2

Note that there is no numerical significance to the excess value: it simply has the effect of shifting the representation of the two’s complement numbers.

There is only one excess representation for 0, since the excess representation is simply a shifted version of the two’s complement representation. For the previous case, the excess value is chosen to have the same bit pattern as the largest negative number, which has the effect of making the numbers appear in numerically sorted order if the numbers are viewed in an unsigned binary representation. Thus, the most negative number is (-128)10 = (00000000)2 and the most posi- tive number is (+127)10 = (11111111)2. This representation simplifies making comparisons between numbers, since the bit patterns for negative numbers have numerically smaller values than the bit patterns for positive numbers. This is important for representing the exponents of floating point numbers, in which exponents of two numbers are compared in order to make them equal for addition and subtraction. We will explore floating point representations in Section 2.3.

2.2.7 BINARY CODED DECIMAL

Numbers can be represented in the base 10 number system while still using a binary encoding. Each base 10 digit occupies four bit positions, which is known as binary coded decimal (BCD). Each BCD digit can take on any of 10 values. There are 24 = 16 possible bit patterns for each base 10 digit, and as a result, six bit patterns are unused for each digit. In Figure 2-6, there are four decimal significant digits, so 104 = 10,000 bit patterns are valid, even though 216 = 65,536 bit patterns are possible with 16 bits.

image

Although some bit patterns are unused, the BCD format is commonly used in calculators and in business applications. There are fewer problems in representing terminating base 10 fractions in this format, unlike the base 2 representation. There is no need to convert data that is given at the input in base 10 form (as in a calculator) into an internal base 2 representation, or to convert from an internal representation of base 2 to an output form of base 10.

Performing arithmetic on signed BCD numbers may not be obvious. Although we are accustomed to using a signed magnitude representation in base 10, a different method of representing signed base 10 numbers is used in a computer. In the nine’s complement number system, positive numbers are represented as in ordinary BCD, but the leftmost digit is less than 5 for positive numbers and is 5 or greater for negative numbers. The nine’s complement negative is formed by subtracting each digit from 9. For example, the base 10 number +301 is represented as 0301 (or simply 301) in both nine’s and ten’s complement as shown in Figure 2-6a. The nine’s complement negative is 9698 (Figure 2-6b), which is obtained by subtracting each digit in 0301 from 9.

The ten’s complement negative is formed by adding 1 to the nine’s complement negative, so the ten’s complement representation of -301 is then 9698 + 1 = 9699 as shown in Figure 2-6c. For this example, the positive numbers range from 0 – 4999 and the negative numbers range from 5000 to 9999.


Introduction to principles of computer architecture : organization of the book and case study: what happened to supercomputers?

 
Organization of the Book
We explore the inner workings of computers in the chapters that follow. Chapter 2 covers the representation of data, which provides background for all of the chapters that follow. Chapter 3 covers methods for implementing computer arithmetic. Chapters 4 and 5 cover the instruction set architecture, which serves as a vehicle for understanding how the components of a computer interact. Chapter 6 ties the earlier chapters together in the design and analysis of a control
image
unit for the instruction set architecture. Chapter 7 covers the organization of memory units, and memory management techniques. Chapter 8 covers input, output, and communication. Chapter 9 covers advanced aspects of single-CPU systems (which might have more than one processing unit). Chapter 10 covers advanced aspects of multiple-CPU systems, such as parallel and distributed architectures, and network architectures. Finally, in Appendices A and B, we look into the design of digital logic circuits, which are the building blocks for the basic components of a computer.
 Case Study: What Happened to Supercomputers?
[Note from the authors: The following contribution comes from Web page http://www.paralogos.com/DeadSuper created by Kevin D. Kissell at kevink@acm.org. Kissell’s Web site lists dozens of supercomputing projects that have gone by the wayside. One of the primary reasons for the near-extinction of supercomputers is that ordinary, everyday computers achieve a significant fraction of supercomputing power at a price that the common person can afford. The price-to-performance ratio for desktop computers is very favorable due to low costs achieved through mass market sales. Supercomputers enjoy no such mass markets, and continue to suffer very high price-to-performance ratios.
Following Kissell’s contribution is an excerpt from an Electrical Engineering Times article that highlights the enormous investment in everyday microprocessor development, which helps maintain the favorable price-to-performance ratio for low-cost desktop computers.]
image
The Passing of a Golden Age?
From the construction of the first programmed computers until the mid 1990s, there was always room in the computer industry for someone with a clever, if sometimes challenging, idea on how to make a more powerful machine. Computing became strategic during the Second World War, and remained so during the Cold War that followed. High-performance computing is essential to any modern nuclear weapons program, and a computer technology “race” was a logical corollary to the arms race. While powerful computers are of great value to a number of other industrial sectors, such as petroleum, chemistry, medicine, aero- nautical, automotive, and civil engineering, the role of governments, and particularly the national laboratories of the US government, as catalysts and incubators for innovative computing technologies can hardly be overstated. Private industry may buy more machines, but rarely do they risk buying those with single-digit serial numbers. The passing of Soviet communism and the end of the Cold War brought us a generally safer and more prosperous world, but it removed the raison d’etre for many merchants of performance-at-any-price.
Accompanying these geopolitical changes were some technological and economic trends that spelled trouble for specialized producers of high-end computers. Microprocessors began in the 1970s as devices whose main claim to fame was that it was possible to put a stored-program computer on a single piece of silicon. Competitive pressures, and the desire to generate sales by obsoleting last year’s product, made for the doubling of microprocessor computing power every 18 months, Moore’s celebrated “law.” Along the way, microprocessor designers borrowed almost all the tricks that designers of mainframe and numerical supercomputers had used in the past: storage hierarchies, pipelining, multiple functional units, multiprocessing, out-of-order execution, branch prediction, SIMD processing, speculative and predicated execution. By the mid 1990s, research ideas were going directly from simulation to implementation in microprocessors des- tined for the desktops of the masses. Nevertheless, it must be noted that most of the gains in raw performance achieved by microprocessors in the preceding decade came, not from these advanced techniques of computer architecture, but from the simple speedup of processor clocks and quantitative increase in processor resources made possible by advances in semiconductor technology. By 1998, the CPU of a high-end Windows-based personal computer was running at a higher clock rate than the top-of-the-line Cray Research supercomputer of 1994.
It is thus hardly surprising that the policy of the US national laboratories has shifted from the acquisition of systems architected from the ground up to be supercomputers to the deployment of large ensembles of mass-produced micro- processor-based systems, with the ASCI project as the flagship of this activity. As of this writing, it remains to be seen if these agglomerations will prove to be sufficiently stable and usable for production work, but the preliminary results have been at least satisfactory. The halcyon days of supercomputers based on exotic technology and innovative architecture may well be over.
Invest or die: Intel’s life on the edge
By Ron Wilson and Brian Fuller
SANTA CLARA, Calif. — With about $600 million to pump into venture companies this year, Intel Corp. has joined the major leagues of venture-capital firms. But the unique imperative that drives the microprocessor giant to invest gives it influence disproportionate to even this large sum. For Intel, venture investments are not just a source of income; they are a vital tool in the fight to survive.
Survival might seem an odd preoccupation for the world’s largest semiconductor company. But Intel, in a way all its own, lives hanging in the balance. For every new generation of CPUs, Intel must make huge investments in process development, in buildings and in fabs-an investment too huge to lose.
Gordon Moore, Intel chairman emeritus, gave scale to the wager. “An R&D fab today costs $400 million just for the building. Then you put about $1 billion of equipment in it. That gets you a quarter-micron fab for maybe 5,000 wafers per week, about the smallest practical fab. For the next generation,” Moore said, “the minimum investment will be $2 billion, with maybe $3 billion to $4 billion for any sort of volume production. No other industry has such a short life on such huge investments.”
Much of this money will be spent before there is a proven need for the microprocessors the fab will pro- duce. In essence, the entire $4 billion per fab is bet on the proposition that the industry will absorb a huge number of premium-priced CPUs that are only some- what faster than the currently available parts. If for just one generation that didn’t happen-if everyone judged, say, that the Pentium II was fast enough, thank you-the results would be unthinkable.
“My nightmare is to wake up some day and not need any more computing power,” Moore said.
SUMMARY
Computer architecture deals with those aspects of a computer that are visible to a programmer, while computer organization deals with those aspects that are at a more physical level and are not made visible to a programmer. Historically, programmers had to deal with every aspect of a computer – Babbage with mechanical gears, and ENIAC programmers with plugboard cables. As computers grew in sophistication, the concept of levels of machines became more pronounced, allowing computers to have very different internal and external behaviors while man- aging complexity in stratified levels. The single most significant development that makes this possible is the stored program computer, which is embodied in the von Neumann model. It is the von Neumann model that we see in most conventional computers today.
Further Reading
The history of computing is riddled with interesting personalities and mile- stones. (Anderson, 1991) gives a short, readable account of both during the last century. (Bashe et. al., 1986) give an interesting account of the IBM machines. (Bromley, 1987) chronicles Babbage’s machines. (Ralston and Reilly, 1993) give short biographies of the more celebrated personalities. (Randell, 1982) covers the history of digital computers. A very readable Web based history of computers by Michelle A. Hoyle can be found at http://www.interpac.net/~eingang/Lec-ture/toc.html. (SciAm, 1993) covers a readable version of the method of finite differences as it appears in Babbage’s machines, and the version of the analytical difference engine created by the Science Museum in London.
(Tanenbaum, 1999) is one of a number of texts that popularizes the notion of levels of machines.
Anderson, Harlan, Dedication address for the Digital Computer Laboratory at the University of Illinois, April 17, 1991, as reprinted in IEEE Circuits and Sys- tems: Society Newsletter, vol. 2, no. 1, pp. 3–6, (March 1991).
Bashe, Charles J., Lyle R. Johnson, John H. Palmer, and Emerson W. Pugh,
IBM’s Early Computers, The MIT Press, (1986).
Bromley, A. G., “The Evolution of Babbage’s Calculating Engines,” Annals of the History of Computing, 9, pp. 113-138, (1987).
Randell, B., The Origins of Digital Computers, 3/e, Springer-Verlag, (1982). Ralston, A. and E. D. Reilly, eds., Encyclopedia of Computer Science, 3/e, van
Nostrand Reinhold, (1993).
Tanenbaum, A., Structured Computer Organization, 4/e, Prentice Hall, Engle- wood Cliffs, New Jersey, (1999).
PROBLEMS
1.1 Moore’s law, which is attributed to Intel founder Gordon Moore, states that computing power doubles every 18 months for the same price. An unrelated observation is that floating point instructions are executed 100 times faster in hardware than via emulation. Using Moore’s law as a guide, how long will it take for computing power to improve to the point that floating point instructions are emulated as quickly as their (earlier) hardware counterparts?
 

Introduction to principles of computer architecture : the system bus model, levels of machines ( upward compatibility and the levels) and a typic al computer system.

The System Bus Model

Although the von Neumann model prevails in modern computers, it has been streamlined. Figure 1-3 shows the system bus model of a computer system. This

image

model partitions a computer system into three subunits: CPU, Memory, and Input/Output (I/O). This refinement of the von Neumann model combines the ALU and the control unit into one functional unit, the CPU. The input and out- put units are also combined into a single I/O unit.

Most important to the system bus model, the communications among the components are by means of a shared pathway called the system bus, which is made up of the data bus (which carries the information being transmitted), the address bus (which identifies where the information is being sent), and the control bus (which describes aspects of how the information is being sent, and in what manner). There is also a power bus for electrical power to the components, which is not shown, but its presence is understood. Some architectures may also have a separate I/O bus.

Physically, busses are made up of collections of wires that are grouped by function. A 32-bit data bus has 32 individual wires, each of which carries one bit of data (as opposed to address or control information). In this sense, the system bus is actually a group of individual busses classified by their function.

The data bus moves data among the system components. Some systems have separate data buses for moving information to and from the CPU, in which case there is a data-in bus and a data-out bus. More often a single data bus moves data in either direction, although never both directions at the same time.

If the bus is to be shared among communicating entities, then the entities must have distinguished identities: addresses. In some computers all addresses are assumed to be memory addresses whether they are in fact part of the computer’s memory, or are actually I/O devices, while in others I/O devices have separate I/O addresses. (This topic of I/O addresses is covered in more detail in Chapter 8, Input, Output, and Communication.)

A memory address, or location, identifies a memory location where data is stored, similar to the way a postal address identifies the location where a recipient receives and sends mail. During a memory read or write operation the address bus contains the address of the memory location where the data is to be read from or written to. Note that the terms “read” and “write” are with respect to the CPU: the CPU reads data from memory and writes data into memory. If data is to be read from memory then the data bus contains the value read from that address in memory. If the data is to be written into memory then the data bus contains the data value to be written into memory.

The control bus is somewhat more complex, and we defer discussion of this bus to later chapters. For now the control bus can be thought of as coordinating access to the data bus and to the address bus, and directing data to specific components.

Levels of Machines

As with any complex system, the computer can be viewed from a number of perspectives, or levels, from the highest “user” level to the lowest, transistor level. Each of these levels represents an abstraction of the computer. Perhaps one of the reasons for the enormous success of the digital computer is the extent to which these levels of abstraction are separate, or independent from one another. This is readily seen: a user who runs a word processing program on a computer needs to know nothing about its programming. Likewise a programmer need not be concerned with the logic gate structure inside the computer. One interesting way that the separation of levels has been exploited is in the development of upwardly-compatible machines.

UPWARD COMPATIBILITY

The invention of the transistor led to a rapid development of computer hard- ware, and with this development came a problem of compatibility. Computer users wanted to take advantage of the newest and fastest machines, but each new computer model had a new architecture, and the old software would not run on the new hardware. The hardware / software compatibility problem became so serious that users often delayed purchasing a new machine because of the cost of rewriting the software to run on the new hardware. When a new computer was purchased, it would often sit unavailable to the target users for months while the old software and data sets were converted to the new systems.

In a successful gamble that pitted compatibility against performance, IBM pio- neered the concept of a “family of machines” with its 360 series. More capable machines in the same family could run programs written for less capable machines without modifications to those programs—upward compatibility. Upward compatibility allows a user to upgrade to a faster, more capable machine without rewriting the software that runs on the less capable model.

THE LEVELS

Figure 1-4 shows seven levels in the computer, from the user level down to the transistor level. As we progress from the top level downward, the levels become less “abstract” and more of the internal structure of the computer shows through. We discuss these levels below.

image

User or Application-Program Level

We are most familiar with the user, or application program level of the computer. At this level, the user interacts with the computer by running programs such as word processors, spreadsheet programs, or games. Here the user sees the com- puter through the programs that run on it, and little (if any) of its internal or lower-level structure is visible.

High Level Language Level

Anyone who has programmed a computer in a high level language such as C, Pascal, Fortran, or Java, has interacted with the computer at this level. Here, a programmer sees only the language, and none of the low-level details of the machine. At this level the programmer sees the data types and instructions of the high-level language, but needs no knowledge of how those data types are actually implemented in the machine. It is the role of the compiler to map data types and instructions from the high-level language to the actual computer hardware. Pro- grams written in a high-level language can be re-compiled for various machines that will (hopefully) run the same and provide the same results regardless of which machine on which they are compiled and run. We can say that programs are compatible across machine types if written in a high-level language, and this kind of compatibility is referred to as source code compatibility.

Assembly Language/Machine Code Level

As pointed out above, the high-level language level really has little to do with the machine on which the high-level language is translated. The compiler translates the source code to the actual machine instructions, sometimes referred to as machine language or machine code. High-level languages “cater” to the programmer by providing a certain set of presumably well-thought-out language constructs and data types. Machine languages look “downward” in the hierarchy, and thus cater to the needs of the lower level aspects of the machine design. As a result, machine languages deal with hardware issues such as registers and the transfer of data between them. In fact, many machine instructions can be described in terms of the register transfers that they effect. The collection of machine instructions for a given machine is referred to as the instruction set of that machine.

Of course, the actual machine code is just a collection of 1’s and 0’s, sometimes referred to as machine binary code, or just binary code. As we might imagine, programming with 1’s and 0’s is tedious and error prone. As a result, one of the first computer programs written was the assembler, which translates ordinary language mnemonics such as MOVE Data, Acc, into their corresponding machine language 1’s and 0’s. This language, whose constructs bear a one-to-one relationship to machine language, is known as assembly language.

As a result of the separation of levels, it is possible to have many different machines that differ in the lower-level implementation but which have the same instruction set, or sub- or supersets of that instruction set. This allowed IBM to design a product line such as the IBM 360 series with guaranteed upward com- patibility of machine code. Machine code running on the 360 Model 35 would run unchanged on the 360 Model 50, should the customer wish to upgrade to the more powerful machine. This kind of compatibility is known as “binary compatibility,” because the binary code will run unchanged on the various family members. This feature was responsible in large part for the great success of the IBM 360 series of computers.

Intel Corporation has stressed binary compatibility in its family members. In this case, binaries written for the original member of a family, such as the 8086, will run unchanged on all subsequent family members, such as the 80186, 80286, 80386, 80486, and the most current family member, the Pentium pro- cessor. Of course this does not address the fact that there are other computers that present different instruction sets to the users, which makes it difficult to port an installed base of software from one family of computers to another.

The Control Level

It is the control unit that effects the register transfers described above. It does so by means of control signals that transfer the data from register to register, possi- bly through a logic circuit that transforms it in some way. The control unit inter- prets the machine instructions one by one, causing the specified register transfer or other action to occur.

How it does this is of no need of concern to the assembly language programmer. The Intel 80×86 family of processors presents the same behavioral view to an assembly language programmer regardless of which processor in the family is considered. This is because each future member of the family is designed to exe- cute the original 8086 instructions in addition to any new instructions implemented for that particular family member.

As Figure 1-4 indicates, there are several ways of implementing the control unit. Probably the most popular way at the present time is by “hardwiring” the control unit. This means that the control signals that effect the register transfers are generated from a block of digital logic components. Hardwired control units have the advantages of speed and component count, but until recently were exceedingly difficult to design and modify. (We will study this technique more fully in Chapter 9.)

A somewhat slower but simpler approach is to implement the instructions as a microprogram. A microprogram is actually a small program written in an even lower-level language, and implemented in the hardware, whose job is to interpret the machine-language instructions. This microprogram is referred to as firmware because it spans both hardware and software. Firmware is executed by a micro- controller, which executes the actual microinstructions. (We will also explore microprogramming in Chapter 9.)

Functional Unit Level

The register transfers and other operations implemented by the control unit move data in and out of “functional units,” so-called because they perform some function that is important to the operation of the computer. Functional units include internal CPU registers, the ALU, and the computer’s main memory.

Logic Gates, Transistors, and Wires

The lowest levels at which any semblance of the computer’s higher-level functioning is visible is at the logic gate and transistor levels. It is from logic gates that the functional units are built, and from transistors that logic gates are built. The logic gates implement the lowest-level logical operations upon which the computer’s functioning depends. At the very lowest level, a computer consists of electrical components such as transistors and wires, which make up the logic gates, but at this level the functioning of the computer is lost in details of voltage, current, signal propagation delays, quantum effects, and other low-level matters.

Interactions Between Levels

The distinctions within levels and between levels are frequently blurred. For instance, a new computer architecture may contain floating point instructions in a full-blown implementation, but a minimal implementation may have only enough hardware for integer instructions. The floating point instructions are trapped† prior to execution and replaced with a sequence of machine language instructions that imitate, or emulate the floating point instructions using the existing integer instructions. This is the case for microprocessors that use optional floating point coprocessors. Those without floating point coprocessors emulate the floating point instructions by a series of floating point routines that are implemented in the machine language of the microprocessor, and frequently stored in a ROM, which is a read-only memory chip. The assembly language and high level language view for both implementations is the same except for execu- tion speed.

It is possible to take this emulation to the extreme of emulating the entire instruction set of one computer on another computer. The software that does this is known as an emulator, and was used by Apple Computer to maintain binary code compatibility when they began employing Motorola PowerPC chips in place of Motorola 68000 chips, which had an entirely different instruction set.

The high level language level and the firmware and functional unit levels can be so intermixed that it is hard to identify what operation is happening at which level. The value in stratifying a computer architecture into a hierarchy of levels is not so much for the purpose of classification, which we just saw can be difficult at times, but rather to simply give us some focus when we study these levels in the chapters that follow.

The Programmer’s View—The Instruction Set Architecture

As described in the discussion of levels above, the assembly language programmer is concerned with the assembly language and functional units of the machine. This collection of instruction set and functional units is known as the instruction set architecture (ISA) of the machine.

The Computer Architect’s View

On the other hand, the computer architect views the system at all levels. The architect that focuses on the design of a computer is invariably driven by performance requirements and cost constraints. Performance may be specified by the speed of program execution, the storage capacity of the machine, or a number of other parameters. Cost may be reflected in monetary terms, or in size or weight, or power consumption. The design proposed by a computer architect must attempt to meet the performance goals while staying within the cost constraints. This usually requires trade-offs between and among the levels of the machine.

A Typic al Computer System

Modern computers have evolved from the great behemoths of the 1950’s and 1960’s to the much smaller and more powerful computers that surround us today. Even with all of the great advances in computer technology that have been made in the past few decades, the five basic units of the von Neumann model are still distinguishable in modern computers.

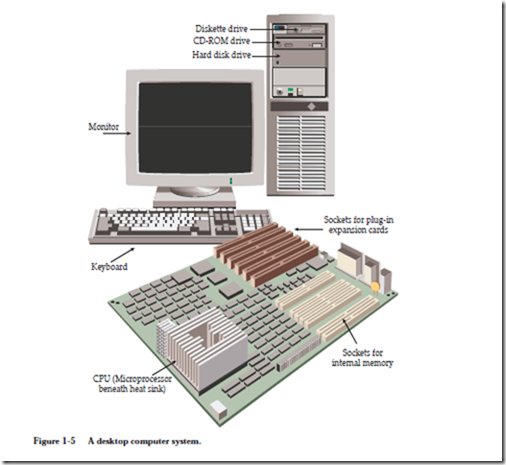
Figure 1-5 shows a typical configuration for a desktop computer. The input unit is composed of the keyboard, through which a user enters data and commands. A video monitor comprises the output unit, which displays the output in a visual form. The ALU and the control unit are bundled into a single microprocessor that serves as the CPU. The memory unit consists of individual memory circuits, and also a hard disk unit, a diskette unit, and a CD-ROM (compact disk – read only memory) device.

As we look deeper inside of the machine, we can see that the heart of the machine is contained on a single motherboard, similar to the one shown in Figure 1-6. The motherboard contains integrated circuits (ICs), plug-in expansion card slots, and the wires that interconnect the ICs and expansion card slots. The

image

input, output, memory, and ALU/control sections are highlighted as shown. (We will cover motherboard internals in later chapters.)


Introduction to principles of computer architecture : overview, a brief history and the von neumann model.

INTRODUCTION

1.1 Overview

Computer architecture deals with the functional behavior of a computer system as viewed by a programmer. This view includes aspects such as the sizes of data types (e.g. using 16 binary digits to represent an integer), and the types of operations that are supported (like addition, subtraction, and subroutine calls). Computer organization deals with structural relationships that are not visible to the programmer, such as interfaces to peripheral devices, the clock frequency, and the technology used for the memory. This textbook deals with both architecture and organization, with the term “architecture” referring broadly to both architecture and organization.

There is a concept of levels in computer architecture. The basic idea is that there are many levels, or views, at which a computer can be considered, from the high- est level, where the user is running programs, or using the computer, to the low- est level, consisting of transistors and wires. Between the high and low levels are a number of intermediate levels. Before we discuss those levels we will present a brief history of computing in order to gain a perspective on how it all came about.

1.2 A Brief History

Mechanical devices for controlling complex operations have been in existence since at least the 1500’s, when rotating pegged cylinders were used in music boxes much as they are today. Machines that perform calculations, as opposed to simply repeating a predetermined melody, came in the next century.

Blaise Pascal (1623 – 1662) developed a mechanical calculator to help in his father’s tax work. The Pascal calculator “Pascaline” contains eight dials that connect to a drum (Figure 1-1), with an innovative linkage that causes a dial to

image

rotate one notch when a carry is produced from a dial in a lower position. A win- dow is placed over the dial to allow its position to be observed, much like the odometer in a car except that the dials are positioned horizontally, like a rotary telephone dial. Some of Pascal’s adding machines, which he started to build in 1642, still exist today. It would not be until the 1800’s, however, until someone would put the concepts of mechanical control and mechanical calculation together into a machine that we recognize today as having the basic parts of a digital computer. That person was Charles Babbage.

Charles Babbage (1791 – 1871) is sometimes referred to as the grandfather of the computer, rather than the father of the computer, because he never built a practical version of the machines he designed. Babbage lived in England at a time when mathematical tables were used in navigation and scientific work. The tables were computed manually, and as a result, they contained numerous errors. Frustrated by the inaccuracies, Babbage set out to create a machine that would compute tables by simply setting and turning gears. The machine he designed could even produce a plate to be used by a printer, thus eliminating errors that might be introduced by a typesetter.

Babbage’s machines had a means for reading input data, storing data, performing calculations, producing output data, and automatically controlling the operation of the machine. These are basic functions that are found in nearly every modern computer. Babbage created a small prototype of his difference engine, which evaluates polynomials using the method of finite differences. The success of the difference engine concept gained him government support for the much larger analytical engine, which was a more sophisticated machine that had a mechanism for branching (making decisions) and a means for programming, using punched cards in the manner of what is known as the Jacquard pattern-weaving loom.

The analytical engine was designed, but was never built by Babbage because the mechanical tolerances required by the design could not be met with the technology of the day. A version of Babbage’s difference engine was actually built by the Science Museum in London in 1991, and can still be viewed today.

It took over a century, until the start of World War II, before the next major thrust in computing was initiated. In England, German U-boat submarines were inflicting heavy damage on Allied shipping. The U-boats received communications from their bases in Germany using an encryption code, which was implemented by a machine made by Siemens AG known as ENIGMA.

The process of encrypting information had been known for a long time, and even the United States president Thomas Jefferson (1743 – 1826) designed a forerunner of ENIGMA, though he did not construct the machine. The process of decoding encrypted data was a much harder task. It was this problem that prompted the efforts of Alan Turing (1912 – 1954), and other scientists in England in creating codebreaking machines. During World War II, Turing was the leading cryptographer in England and was among those who changed cryptography from a subject for people who deciphered ancient languages to a subject for mathematicians.

The Colossus was a successful codebreaking machine that came out of Bletchley Park, England, where Turing worked. Vacuum tubes store the contents of a paper tape that is fed into the machine, and computations take place among the vac- uum tubes and a second tape that is fed into the machine. Programming is per- formed with plugboards. Turing’s involvement in the various Collosi machine versions remains obscure due to the secrecy that surrounds the project, but some aspects of his work and his life can be seen in the Broadway play Breaking the Code which was performed in London and New York in the late 1980’s.

Around the same time as Turing’s efforts, J. Presper Eckert and John Mauchly set out to create a machine that could be used to compute tables of ballistic trajectories for the U.S. Army. The result of the Eckert-Mauchly effort was the Electronic Numerical Integrator And Computer (ENIAC). The ENIAC consists of

18,000 vacuum tubes, which make up the computing section of the machine. Programming and data entry are performed by setting switches and changing cables. There is no concept of a stored program, and there is no central memory unit, but these are not serious limitations because all that the ENIAC needed to do was to compute ballistic trajectories. Even though it did not become operational until 1946, after the War was over, it was considered quite a success, and was used for nine years.

After the success of ENIAC, Eckert and Mauchly, who were at the Moore School at the University of Pennsylvania, were joined by John von Neumann (1903 – 1957), who was at the Institute for Advanced Study at Princeton. Together, they worked on the design of a stored program computer called the EDVAC. A conflict developed, however, and the Pennsylvania and Princeton groups split. The concept of a stored program computer thrived, however, and a working model of the stored program computer, the EDSAC, was constructed by Maurice Wilkes, of Cambridge University, in 1947.

1.3 The Von Neumann Model

Conventional digital computers have a common form that is attributed to von Neumann, although historians agree that the entire team was responsible for the design. The von Neumann model consists of five major components as illustrated in Figure 1-2. The Input Unit provides instructions and data to the sys-

image

tem, which are subsequently stored in the Memory Unit. The instructions and data are processed by the Arithmetic and Logic Unit (ALU) under the direction of the Control Unit. The results are sent to the Output Unit. The ALU and control unit are frequently referred to collectively as the central processing unit (CPU). Most commercial computers can be decomposed into these five basic units.

The stored program is the most important aspect of the von Neumann model. A program is stored in the computer’s memory along with the data to be pro- cessed. Although we now take this for granted, prior to the development of the stored program computer programs were stored on external media, such as plug- boards (mentioned earlier) or punched cards or tape. In the stored program computer the program can be manipulated as if it is data. This gave rise to compilers and operating systems, and makes possible the great versatility of the modern computer.


Printing Technologies and Systems : Thermal Printing Technologies, Electro photographic Printing Technology, Magneto graphic and Ionographic Technologies and System Issues.

Thermal Printing Technologies

Printing technologies that employ the controlled application of thermal energy via a contacting printhead to activate either physical or chemical image formation processes come under this general classification.

There are four thermal technologies in current use: direct thermal, direct thermal transfer, dye diffusion thermal transfer, and resistive ribbon thermal transfer.

Direct Thermal

This is the oldest and most prolifically applied thermal technology. The imaging process relies on the application of heat to a thermochromic layer of approximately 10 µm in thickness coated onto a paper substrate. The thermally active layer contains a leuco dye dispersed along with an acid substance in a binder. Upon heating fusion melting occurs resulting in a chemical reaction and conversion of the leuco dye into a visible deeply colored mark. Key to this process is the design of the printhead, which can be either a page-wide array or a vertical array or a scanning printhead. Two technologies are in use, thick film and thin film. Thick-film printheads have resistor material between 10 and 70 µm. The resistive material is covered with a glass layer approximately 10 µm thick for wear resistance. The thin-film printheads bear a strong resemblance to those found in thermal ink jet printheads. They employ resistive material, such as tantalum nitride, at 1 µm thickness and a 7-µm-thick silicon dioxide wear layer. Thin-film heads are manufactured in resolutions up to 400 dpi. In each case the resistors are cycled via electrical heating pulses through temperature ranges from ambient (25◦C) up to 400◦C. Overall, the thin-film printheads excel in energy efficiency conversion, print quality, response time, and resolution. For these reasons the thin-film printheads are used when high resolution is required, whereas the thick-film printhead excels in commercial applications such as bar coding, airline tickets, fax, etc.

Direct Thermal Transfer

These printers transfer melted wax directly to the paper (Fig. 19.76(a) and Fig. 19.76(b)). The wax that contains the colorant is typically coated at 4 µm thickness onto a polyester film, which, in common implementations, is approximately 6 µm thick. A thermal printhead of the kind described previously presses this ribbon, wax side down, onto the paper. As the individual heating elements are pulsed, the wax melts and transfers by adhesion to the paper. The process is binary in nature; but, by the use of shaped resistors, which produce current crowding via an hourglass shape, for example, the area of wax transferred can be modulated. Common implementations employ page width arrays at 300 dpi with some providing vertical addressability of 600 dpi. The thermal ribbons are also packaged in cassettes for scanning printhead designs in desktop and portable printers. Power consumption is an issue for all thermal printers, and efforts to reduce this for direct thermal transfer have focused on reducing the thickness of the ribbon.

Dye Diffusion Thermal Transfer

This technology involves the transfer of dye from a coated donor ribbon to a receiver sheet via sublimation and diffusion, separately or in combination. The amount of dye transferred is proportional to the

image

amount of heat energy supplied; therefore, this is a continuous tone technology. It has found application as an alternative to silver halide photography, graphics, and prepress proofing. As with all thermal printers the energy is transferred via a transient heating process. This is governed by a diffusion equation and depending on the length of the heating pulse will produce either large temperature gradients over very short distances or lesser gradients extending well outside the perimeter of the resistor. Much of the design, therefore, focuses on the thicknesses of the various layers through which the heat is to be conducted. In the case of thermal dye sublimation transfer a soft-edged dot results, which is suitable for images but not for text. Shorter heating pulses will lead to sharper dots.

Resistive Ribbon Thermal Transfer

This technology is similar to direct thermal transfer in that a thermoplastic ink is imaged via thermal energy onto the substrate. The ribbon is composed of three layers: An electrically conductive substrate of polycarbonate and carbon black (16 µm thick), an aluminum layer 1000–2000 A˚ , and an ink layer which is typically 5 µm. The aluminum layer serves as a ground return plane. Heat is generated by passing current from an electrode in the printhead in contact with the ribbon substrate through the polycarbonate/carbon layer to the aluminum layer. The high pressure applied through the printhead ensures intimate contact with the paper, which does not have to be especially smooth for successful transfer. Printed characters can be removed by turning on all electrodes at a reduced energy level and heating the ink to the point that it bonds to the character to be corrected but not to the paper. The unwanted character is removed as the printhead passes over it. This technology does not adapt to color printing in a straightforward way.

Electrophotographic Printing Technology

Electrophotography is a well established and versatile printing technology. Its first application was in 1960 when it was embodied in an office copier. The process itself bears a strong resemblance to offset lithography. The role of the printing plate is played by a cylindrical drum or belt coated with a photoconductor (PC) on which is formed a printing image consisting of charged and uncharged areas. Depending on the implementation of the technology either the charged or uncharged areas will be inked with a charged, pigmented powder known as toner. The image is offset to the paper either by direct contact or indirectly via a silicone-based transfer drum or belt (similar to the blanket cylinder in offset lithography). Early copiers imaged the material to be copied onto the photoconductor by means of geometrical optics. Replacing this optical system with a scanning laser beam, or a linear array of LEDs, which could be electronically modulated, formed the basis of today’s laser printers. As a technology it spans the range from desktop office printers (4–10 ppm) to high-speed commercial printers (exceeding 100 ppm). Although capable of E-size printing its broadest application has been in the range of 8 1 in to 17 in wide, in color and in black and white.

Printing Process Steps

Electrophotographic printing involves a sequence of interacting processes which must be optimized col- lectively if quality printing is to be achieved. With respect to Fig. 19.77 they are as follows.

1. Charging of the photoconductor to achieve a uniform electrostatic surface charge can be done by means of a corona in the form of a thin, partially shielded wire maintained at several kilovolts with respect to ground (corotron). For positive voltages, a positive surface charge results from ionization in the vicinity of the wire. For negative voltages, negative surface charge is produced but by a more complex process involving secondary emission, ion impact, etc., that makes for a less uniform discharge. The precise design of the grounded shield for the corona can have a significant effect on the charge uniformity produced. To limit ozone production, many office printers (<20 ppm) employ a charge roller in contact with the photoconductor. A localized, smaller discharge occurs in the gap between the roller and photoconductor, reducing ozone production between two and three orders of magnitude.

2. The charged photoconductor is exposed as described previously to form an image that will be at a significant voltage difference with respect to the background. The particular properties of the

image

photoconductor in this step relate to electron hole generation by means of the light and the transport of either electron or hole to the surface to form the image. This process is photographic in nature and has a transfer curve reminiscent of the H and D curves for silver halide. The discharge must be swift and as complete as possible to produce a significant difference in voltage between charged and uncharged areas if optimum print quality is to be achieved. Dark decay must be held to a minimum and the PC must be able to sustain repeated voltage cycling without fatigue. In addition to having adequate sensitivity to the dominant wavelength to the exposing light, the PC must also have a wear-resistant surface, be insensitive to fluctuations in temperature and humidity, and release the toner completely to the paper at transfer. It is possible for either the discharged or the charged region to serve as the image to be printed. Widespread practice today, particularly in laser printers, makes use of the discharged area.

Early PCs were sensitive to visible wavelengths and relied on sulfur, selenium, and tellurium alloys. With the use of diode laser scanners, the need for sensitivity in the near infrared has given rise to organic photoconductors (OPC), which in their implementation consist of multiple layers, including a submicron- thick charge generation layer and a charge transport layer in the range of 30 µm thick. This enables the optimization of both processes and is in wide-spread use today. A passivation or wear layer is used for OPCs, which are too soft to resist abrasion at the transfer stage. In many desktop devices the photoconductive drum is embodied in a replaceable cartridge containing enough toner for the life of the photoconductor. This provides a level of user servicing similar to that for thermal ink jet printers having replaceable printheads.

3. Image formation is achieved by bringing the exposed photoconductor surface in contact with toner particles, which are themselves charged. Electrostatic attraction attaches these particles to form the image. Once again, uniformity is vital, as well as a ready supply of toner particles to keep pace with the development process. Two methods are in widespread use today: dual component, popular for high-speed printing and monocomponent toners commonly found in desktop printers. Dual component methods employ magnetic toner particles in the 10-µm range and magnetizable carrier beads whose characteristic dimension is around 100 µm. Mechanical agitation of the mixture triboelectrically charges the toner particles, and the combination is made to form threadlike chains by means of imbedded magnets in the development roller. This dense array of threads extending from the development roller is called a magnet brush and is rotated in contact with the charged photoconductor (Fig. 19.75). The toner is then attracted to regions of opposite charge and a sensor-controlled replenishment system is used to maintain the appropriate ratio of toner to carrier beads.

Monocomponent development simplifies this process by not requiring carrier beads, replenishment system, and attendant sensors. A much more compact development system results, and there are two implementations: magnetic and nonmagnetic. Magnetic methods still form a magnetic brush but it consists of toner particles only. A technique of widespread application is to apply an oscillating voltage to a metal sleeve on the development roller. The toner brush is not held in contact with the photoconductor but, rather, a cloud of toner particles is induced by the oscillating voltage as particles detach and reattach depending on the direction of the electric field. Nonmagnetic monocomponent development is equally popular in currently available printers. There are challenges in supplying these toners in charged condition and at rates sufficient to provide uniform development at the required print speed. Their desirability derives from lower cost and inherent greater transparency (for color printing applications) due to the absence of magnetic additives.

One way of circumventing the limitations on particle size and the need for some form of brush technique is to use liquid development. The toner is dispersed in a hydrocarbon-based carrier and is charged by means of the electrical double layer that is produced when the toner is taken into solution. Typically, the liquid toner is brought into contact with the photoconductor via a roller. Upon contact, particle transport mechanisms, such as electrophoresis, supply toner to the image regions. Fluid carryout is a major challenge for these printers. To date this has meant commercial use where complex fluid containment systems can be employed. The technique is capable of competing with offset lithography and has also been used for color proofing.

4. The transfer and fuse stage imposes yet more demands on the toner and photoconductor. The toner must be released to the paper cleanly and then fixed to make a durable image (fusing). The majority of fusing techniques employ heat and pressure, although some commercial systems make use of radiant fusing by means of zenon flash tubes. The toner particles must be melted sufficiently to blend together and form a thin film, which will adhere firmly to the substrate. The viscosity of the melted toner, its surface tension, and particle size influence this process. The design challenge for this process step is to avoid excessive use of heat and to limit the pressure so as to avoid smoothing, that is, calendering and/or curling of the paper. Hot-roll fusing passes the toned paper through a nip formed by a heated elastomer-coated roller in contact with an unheated opposing roller that may or may not have an elastomer composition. Some designs also apply a thin film of silicone oil to the heated roller to aid in release of the melted toner from its surface. There is inevitably some fluid carryout under these conditions, as well as a tendency for the silicone oil to permeate the elastomer and degrade its physical properties. Once again materials innovation plays a major role in electrophotography.

5. The final phase involves removal of any remaining toner from the photoconductor prior to charging and imaging for the next impression. Common techniques involve fiber brushes, magnetic brushes, and scraper blades. Coronas to neutralize any residual charge on the PC or background toner are also typical components of the cleaning process. The toner removed in this step is placed in a waste toner hopper to be discarded. The surface hardness of the PC plays a key role in the efficiency of this step. Successful cleaning is especially important for color laser printers since color contrast can make background scatter particularly visible, for example, magenta toner background in a uniform yellow area.

Dot Microstructure

With respect to image microstructure, the design of the toner material, the development technique, and the properties of the photoconductor play key roles. It is desirable to have toner particles as small as possible and in a tightly grouped distribution about their nominal diameter. Composition of toner is the subject of a vast array of publications and patents. Fundamental goals for toner are a high and consistent charge-to-mass ratio, transparency in the case of color, a tightly grouped distribution, and a minimum, preferably no, wrong-sign particles. The latter are primarily responsible for the undesirable background scatter that degrades the print. Recent developments in toner manufacture seek to control this by means of charge control additives which aid in obtaining the appropriate magnitude of charging and its sign. Grayscale in laser printers is achieved by modulating the pulse width of the diode laser. The shape and steepness of the transfer curve, which relates exposure to developed density, is a function of photoconductor properties, development process, and toner properties. It is possible to produce transfer curves of low or high gradient. For text, a steep gradient curve is desirable, but for images a flatter gradient curve provides more control. Since the stability of the development process is subject to ambient temperature and humidity, the production of a stable grayscale color laser printer without print artifacts is most challenging.

Magnetographic and Ionographic Technologies

These two technologies are toner based but utilize different addressing and writing media. The photoconductor is replaced by a thin magnetizable medium or hard dielectric layer, such as anodized aluminum, which is used in ionographic printers. Magnetographic printers employ a printhead that produces mag- netic flux transitions in the magnetizable media by changing the field direction in the gap between the poles of the printhead. These magnetic transitions are sources of strong field gradient and field strength. Development is accomplished by means of magnetic toner applied via a magnetic brush. The toner parti- cles are magnetized and attracted to the medium by virtue of the strong field gradient. Transfer and fusing proceed in a similar manner to that of electrophotography. Ionographic printers write onto a dielectric coated drum by means of a printhead containing individual electron sources. The electrons are generated in a miniature cavity by means of air breakdown under the influence of an RF field. The electron beam is focused by a screen electrode, and the cavity functions in a manner similar to that of vacuum tube valves. The role of the plate is played by the dielectric coated metal drum held at ground potential. The charge image is typically developed by monocomponent toner followed by a transfix, that is, transfer and fuse operation, often without the influence of heat. Both systems require a cleaning process: mechanical scraping for ionography and magnetic scavenging for magnetography.

System Issues

Processing and communicating data to control today’s printers raises significant system issues in view of the material to be printed. Hardcopy output may contain typography, computer-generated graphics, and natural or synthetic images in both color and black and white. The complexity of this information can require a large amount of processing, either in the host computer or in the printer itself. Applications software programs can communicate with the printer in two ways: via a page description language (PDL), or through a printer command set. The choice is driven by the scope of the printed material. If full page layout with text, graphics, and images is the goal, then PDL communication will be needed. For computer generated graphics a graphical language interface will often suffice. However, many graphics programs also provide PDL output capability. Many options exist and a careful analysis of the intended printed material is necessary to determine if a PDL interface is required.

When processing is done in the host computer, it is the function of the printer driver to convert the outline fonts, graphical objects, and images into a stream of bits to be sent to the printer. Functions that the driver may have to perform include digital halftoning, rescaling, color data transformations, and color appearance adjustments among other image processing operations, all designed to enable the printer to deliver its best print quality. Data compression in the host and decompression in the printer may be used to prevent the print speed being limited by the data rate. Printers that do their own internal data processing contain a hardware formatter board whose properties are often quoted as part of the overall specification for the printer. This is typical for printers with a PDL-based interface. Some of the advantages for this approach include speed of communication with the printer and relieving of the host computer of the processing burden, which can be significant for complex documents.

The increase in complexity of printed documents has emphasized several practical system aspects that relate to user needs: visibility and control of the printed process, font management, quick return to the software application, and printer configuration. The degree of visibility and control in the printing process depends on the choice of application and/or operating environment. Fonts, either outline or bit map, may reside on disk, on computer, or printer read-only memory (ROM). To increase speed, outline fonts in use are rasterized and stored in formatter random-access memory (RAM) or computer RAM. Worst cases exist when outline fonts are retrieved at printing and rasterization occurs on a demand basis. This can result in unacceptably slow printing. If quickness of return to the application is important, printers containing their own formatter are an obvious choice. It is necessary, therefore, to take a system view and evaluate the entire configuration (computer hardware; operating system; application program; interconnect; printer formatter, and its CPU, memory, and font storage) to determine if the user needs will be met.

The need to print color images and complex color shaded graphics has brought issues such as color matching, color appearance, and color print quality to the fore. Color printer configuration now includes choices as to halftoning algorithm, color matching method, and, in some cases, smart processing. The latter refers to customized color processing based on whether the object is a text character, image, or graphic. A further complication arises when input devices and software applications also provide some of these services, and it is possible to have color objects suffer redundant processing before being printed. This can severely degrade the print quality and emphasizes the importance of examining the entire image processing chain and turning off the redundant color processing. Color printer configuration choices focus on a tradeoff between print speed and print quality. Halftoning algorithms that minimize visible texture and high print quality modes that require overprinting consume more processing time. For color images and graphics, the relationship between the CRT image and hard copy is a matter of choice and taste. For color graphics, it is common practice to sacrifice accuracy of the hue in the interests of colorfulness or saturation of the print. In the case of natural images, hue accuracy, particularly for flesh tones, is more important, and a different tradeoff is made. Some software and hardware vendors provide a default configuration that seeks to make the best processing choice based on a knowledge of the content to be printed. If more precise control is desired, some understanding of the color reproduction issues represented by the combination of color input and output devices linked by a PC having a color monitor is required. This is the domain of color management.

Color Management

The fundamental issue to be addressed by color management is that of enabling the three broad classes of color devices (input, display, output) to communicate with each other in a system configuration. The technical issue in this is one of data representation. Each device has an internal representation of color information that is directly related to the nature in which it either represents or records that information. For printers it is typically amounts of cyan, magenta, yellow, and often black (CMY, K) ink; for displays, digital counts of red, green, and blue (RGB); and for many input devices, digitized values of RGB. These internal spaces are called device spaces and map out the volume in three-dimensional color space that can be accessed by the device. To communicate between the devices these internal spaces are converted either by analytical models or three-dimensional lookup tables (LUTs) into a device-independent space. Current practice is to use Commision Internationale d’Eclairage (CIE) colorimetric spaces, based on the CIE 1931 standard observer for this purpose. This enables the device space to be related to coordinates that are derived from measurements on human color perception. These conversions are known as device profiles, and the common device independent color space is referred to as the profile connection space (PCS). When this is done it is found that each device accesses a different volume in human color space. For example, a CRT cannot display yellows at the level of saturation available on most color printers. This problem, in addition to issues relating to viewing conditions and the user state of adaptation, makes it necessary to perform a significant amount of color processing if satisfactory results are to be obtained. Solutions to this problem are known as color management methods (CMM) (Fig. 19.78). It is the goal of color management systems to coordinate and perform these operations.

The purpose of a color management system is, therefore, to provide the best possible color preference matching, color editing, and color file transfer capabilities with minimal performance and ease of use penalties. Three levels of color-management solutions are common available, point solutions, application solutions, and operating system solutions. Point solutions perform all processing operations in the device driver and fit transparently into the system. If color matching to the CRT is desired, either information as to the make of CRT or visual calibration tools are provided to calibrate the CRT to the driver. Ap- plication solutions contain libraries of device profiles and associated CMMs. This approach is intended

image

to be transparent to the peripheral and application vendor. Operating system solutions embed the same functionality within the operating system. These systems provide a default color matching method but also allow vendor-specific CMMs to be used.

Although the creation of a device profile involves straightforward measurement processes, there is much to be done if successful color rendition is to be achieved. It is the property of CIE colorimetry that two colors will match when evaluated under the same viewing conditions. It is rarely the case that viewing conditions are identical and it is necessary to perform a number of adaptations commonly called color appearance transformations to allow for this. A simple example is to note that the illuminant in a color scanner will have a different color chromaticity than the white point of the CRT, which will also differ from the white point of the ambient viewing illuminant. In addition, as has been mentioned, different devices access different regions of color space; that is, they have different color gamuts. Colors outside the gamut of a destination device such as a printer must therefore be moved to lie within the printer gamut. This will also apply if the dynamic ranges are mismatched between source and destination. Techniques for performing all of the processes are sophisticated and proprietary and reside in vendor specific CMMs.

Defining Terms

Addressability: The spacing of the dots on the page, specified in dots per unit length. This may be different in horizontal and vertical axes and does not imply a given dot diameter.

CIE 1931 standard observer: Set of curves obtained by averaging the results of color matching experiments performed in 1931 for noncolor defective observers. The relative luminances of the colors of the spectrum were matched by mixtures of three spectral stimuli. The curves are often called color matching curves.

Commision Internationale d’Eclairage (CIE): International standards body for lighting and color measurement. Central Bureau of the CIE, a-1033 Vienna, P.O. Box 169, Austria.

Digital halftone: Halftone technique based on patterns of same size dots designed to simulate a shade of gray between white paper and full colorant coverage.

Grayscale: Intrinsic modulation property of the marking technology that enables either dots of different size or intensity to be printed.

Halftone: Technique of simulating continuous tones by varying the amount of area covered by the colorant. Typically accomplished by varying the size of the printed dots in relation to the desired intensity.

H and D curve: Characteristic response curve for a photosensitive material that relates exposure to produced/developed optical density.

Resolution: Spacing of the printer dots such that full ink coverage is just obtained. Calculated from the dot size and represents the fundamental ability of the printer to render fine detail.

Saturation: When applied to color it describes the colorfulness with respect to the achromatic axis. A color is saturated to the degree that it has no achromatic component.

References

Cornsweet, T.N. 1970. Visual Perception. Academic Press, New York.

Diamond, A.S., ed. 1991. Handbook of Imaging Materials. Marcel Dekker, New York.

Durbeck, R.C. and Sherr, S. 1988. Hardcopy Output Devices. Academic Press, San Diego, CA.

Hunt, R.W.G. 1992. Measuring Color, 2nd ed. Ellis Horwood, England.

Hunt, R.W.G. 1995. The Reproduction of Color, 5th ed. Fountain Press. England.

Scharfe, M. 1984. Electrophotography Principles and Optimization. Research Studies Press Ltd., Letchworth,

Hertfordshire, England.

Schein, L.B. 1992. Electrophotography and Development Physics, 2nd ed. Springer–Verlag, Berlin.

Schreiber, W.F. 1991. Fundamentals of Electronic Imaging Systems, 2nd ed. Springer–Verlag, Berlin.

Ulichney, R. 1987. Digital Halftoning. MIT Press, Cambridge, MA.

Williams, E.M. 1984. The Physics and Technology of Xerographic Processes. Wiley-Interscience, New York.

Further Information

Color Business Report: published by Blackstone Research Associates, P.O. Box 345, Uxbridge, MA 01569- 0345. Covers industry issues relating to color, computers, and reprographics.

International Color Consortium: The founding members of this consortium include Adobe Systems Inc., Agfa-Gevaert N.V., Apple Computer, Inc., Eastman Kodak Company, FOGRA (Honorary), Microsoft Corporation, Hewlett-Packard Journal, 1985. 36(5); 1988. 39(4) (Entire issues devoted to Thermal Ink Jet). Journal of Electronic Imaging: co-published by IS&T and SPIE. Publishes papers on the acquisition, display, communication and storage of image data, hardcopy output, image visualization, and related image topics. Source of current research on color processing and digital halftoning for computer printers.

Journal of Imaging Science and Technology: official publication of IS&T, which publishes papers covering a broad range of imaging topics, from silver halide to computer printing technology.

The International Society for Optical Engineering, SPIE, P.O. Box 10, Bellingham, Washington 98227- 0010, sponsors conferences in conjunction with IS&T on electronic imaging and publishes topical pro- ceedings from the conference sessions.

The Hardcopy Observer, published monthly by Lyra Research Services, P.O. Box 9143, Newtonville, MA 02160. An industry watch magazine providing an overview of the printer industry with a focus on the home and office.

The Society for Imaging Science and Technology, IS&T, 7003 Kilworth Lane, Springfield, VA 22151. Phone (703)642 9090, Fax (703)642 9094. Sponsors wide range of technical conferences on imaging and printing technologies. Publishes conference proceedings, books, Journal of Electronic Imaging, Journal of Imaging Science and Technology, IS&T Reporter.

The Society for Information Display, 1526 Brookhollow Drive, Ste 82, Santa Ana, CA 92705-5421, Phone (714)545 1526, Fax (714)545 1547. Cosponsors annual conference on color imaging with IS&T.


Printing Technologies and Systems : Introduction, Printing Technologies and Nonimpact Printing Technologies.

19.8 Printing Technologies and Systems
19.8.1 Introduction

The basic parameters of print quality are resolution, addressability, gray scale, and dot microstructure. A real device also has intrinsic variability in the printing process, producing visual artifacts, which come under the general heading of noise. Some of the more common manifestations of this are background scatter, dot placement errors, voids (due to nozzle malfunction in ink jet, for example), and banding in images. The significance of any of these aspects of print quality can only be determined by examining them with respect to the properties of the human visual system. The design choices of the basic print quality parameters are, therefore, guided by the properties of the human visual system to determine where improvement needs to be made or where little is to be gained by increasing any one of the specifications.

Resolution and Addressability

Resolution, the most widely used specification to rate print quality, is sometimes confused with the related term addressability. Fundamentally, resolution refers to the ability of the device to render fine detail. This simple definition is complicated by the fact that detail can be regarded as the fineness of the width of a line, the transition between white paper and printed intensity, and/or the smoothness of the edge of a curved line or a line printed at any arbitrary angle. In the simplest case, the resolution of a printer is defined as the spacing of the dots such that full coverage is obtained, that is, no white paper can be seen. For circular dots placed on a square grid, this number would be calculated by dividing the diameter by the square root of two and taking its inverse. For example, an ideal 300 dots per inch (dpi) printer would produce 120-µm-diam dots at an 85 µm spacing. In practice, the dot would be made somewhat larger to allow for dot placement errors. This definition is best understood in terms of the finest line that can be printed by the device. At 300 dpi the line would exhibit a perceptible edge waviness, especially when printed at certain sensitive angles. This would also be true of curved lines. In addition, the range of lines of increasing thickness would have discontinuities since they would consist of an integral number of the basic line, each spaced at 85 µm. These issues have an important bearing on text print quality, which depends on the ability to render both curved and straight lines at variable widths.

The preceding definition is related to the specification of resolution with respect to the human visual system. In this case resolution is determined by the closeness of spacing between alternate black and white lines of equal width and defined contrast. These are known as line pairs and for a 300-dpi printer it would result in a value of 150 line pairs per inch. This is not strictly correct since the black lines would be wider than the white spaces due to the roundness of the dot. Since the human visual system has a response that approaches zero near 300 line pairs per inch, gains made in text print quality by increasing resolution alone can be expected to diminish above this value. At this point, issues such as print noise and grayscale enter if further improvement in print quality is desired.

To focus only on the resolution as defined in the previous paragraphs ignores the specific needs of the components of the printed material, that is, text and lines vs. images and area fill. Gains in text print quality may be had if the device can space the dots closer than the fundamental resolution. This can result in substantial dot overlap but allows the line width to be varied more continuously. In addition, at the edge of a curved line, the subpixel adjustments of individual dots increase the perception of smoothness commonly known as getting rid of the jaggies. This ultimate dot spacing of the device is called addressability. For example, printers employing this technique are specified as 300 × 600 dpi indicating a native resolution of 300 dpi in the horizontal direction and a vertical addressability of 600 dpi.

Grayscale

The ability of a printing technology to modulate the printed intensity on the page is referred to as its grayscale capability. There are three ways in which this may be accomplished: variation of the dot size, variation of the intensity of the printed dot, and digital halftoning techniques. The first two depend on the intrinsic properties of the technology, whereas digital halftoning can be employed by any printer. A printer that can continuously vary its intensity from white paper through to maximum colorant density is described as having continuous tone capability. Other technologies produce a modest number of intensity levels and make use of digital halftoning techniques to create a continuous tone effect. The manner in which gray scale is achieved is of obvious importance in image printing, particularly in the case of color. In recent years considerable effort has gone into the development of sophisticated digital halftoning algorithms to enable binary (single dot size and no intensity modulation) printers to render images. The resulting image quality depends more strongly on resolution than addressability. But the impact of even a few intrinsic gray levels on the print quality achieved by these algorithms can be dramatic.

An important parameter in grayscale considerations is that of the dynamic range, which is simply called range in the graphic arts. This is measured in terms of optical density, the negative logarithm of the reflectance. An optical density of 1.0 represents 10% of reflected light per instant flux, an optical density of 2.0 corresponds to 1% reflectance, and so on. For printed material the smoothness of the printed surface limits the maximum optical density obtainable. If the surface is smooth and mirrorlike, then the print appears glossy and can have optical densities approaching 2.4. The smooth surface reflects light in a specular manner and, therefore, scatters little stray light from the surface into the eye, and the color intensity is not desaturated. It is most noticeable in the case of photographic paper that has a high gloss finish. If the optical density range of the print is high, it is said to have high dynamic range and a very pleasing image will result. Not all papers, however, are designed to have a glossy finish. Papers used in the office are also used in copiers and have a surface which produces diffuse reflection at the interface between the air and the paper. For most uncoated, nonglossy papers this will be between 3–4% and limits the maximum optical density to around 1.4. Image quality on these stocks will depend on the fixing of the colorant to the substrate to produce a smooth surface. The potential image quality for a printer is therefore a complex tradeoff involving the design choices of resolution, addressability, grayscale method, digital halftoning algorithm, paper stock, colorant, and fixing technology. Conclusion: for images, resolution alone is not a predictor of print quality.

Dot Microstructure

The microscopic nature of the dot produced by a given technology also has a bearing on final print quality. The most important parameter here relates to the edge gradient of the dot. Known as the normal-edge profile, it characterizes the transition between white paper and maximum colorant intensity, that is, the gradient of optical density that occurs at the edge of the dot and measures the steepness of the transition from white paper to full optical density. Some technologies, such as electrophotography, can vary this profile by adjusting various parameters in the imaging and developing process. For ink jet, various paper types will produce different normal-edge profiles. If the profile is very steep, that is, the transition occurs in a very small distance such as 5 µm, then the dot is described as being a hard dot or having a very sharp edge. This is desirable when printing lines and text that benefit from very sharp transitions between black and white. If this transition is gradual, the dot is described as being soft and produces a blurring of the edge, which can degrade the text quality. In the case of images, where smooth tones and tonal changes are desired, a soft dot can be very beneficial.

Hybrid Methods

From what has been said it should not be inferred that the needs of texts and images are in opposition. In recent years the intrinsic grayscale capability has been used to advantage in improving text print quality. The removal of jaggies can be greatly assisted by the combination of increased addressability and a few gray levels. By the use of gray levels in the region of the jagged stairstep, the transition can be made to take place over several pixels. This is, in essence, blurring the transition to make it less visible to the eye. In the case of certain fonts, there is fine detail requiring resolutions greater than the native resolution of the printer. This fine detail can be rendered through a combination of gray levels and regular pixels. The implementation of these methods requires a complex set of rules to be applied to the data bit stream before it is sent to the marking level of the printer. These rules draw heavily on image processing techniques and a knowledge of the human visual system and are proprietary. Skillfully applied they can have a dramatic effect on the text and line quality. There are a variety of trademarked names for these technologies designed to convey the sense of enhancement of the print quality.

The application of image processing techniques to manipulate the intrinsic properties of electronic printing technologies have made resolution an insufficient measure of print quality. A more comprehensive measure is needed to simplify the identification of the printing technology to serve the design goals for final output quality. Until such a metric is devised, the tradeoff analysis just described, implemented by means of industry standard test charts that separately probe the printer properties, will provide a predictive measure of print quality. Such test charts must also contain test images, which will be subject to the proprietary subjective image enhancement algorithms offered by the manufacturer.

19.8.2 Printing Technologies

The four basic elements of any printing technology are: addressing, marking substance and its storage and delivery, transfer of the marking substance, and fixing. Addressing refers to the communication of electronic data to the marking unit, typically via electronic or optical means. The marking substance contains the colorant, vehicle/carrier material for transport, binders to secure the colorants to the paper, stabilizing agents to resist fading, and technology specific additives such as biocides for liquid inks. The transfer process is the fundamental physical mechanism whereby a specific amount of the marking substance is removed from the bulk and transferred to the paper. Fixing embodies the processes of adhesion, drying, or solidification of the material onto the paper to form a durable image. These fundamental subsystems interact with each other to give each printing technology its own unique characteristics. The common classification of printing technologies today begins with the broad separation into two classes: Impact and nonimpact printing technologies. Impact methods achieve transfer via the direct mechanical application of force or pressure via a marking element, which can be either a fine wire or fully formed character onto a colorant carrying ribbon in contact with the paper; the simplest form of this is a typewriter. Nonimpact methods cover a wide range of technologies that achieve transfer through a variety of means that may be either contact or noncontact in nature.

19.8.3 Nonimpact Printing Technologies

Ink Jet

The transfer process of ink jet printing is one of removing a drop of liquid ink from the bulk and giving it a velocity of sufficient precision and magnitude to place it on a substrate in close proximity to but not touching the printhead. There are three broad techniques: continuous, electrostatic, and drop on demand. Continuous ink jet printing, because of its intrinsic high drop rate, has tended to find more applications

image

FIGURE 19.66 Character printing with continuous ink jet. The deflection plate applies an analog voltage to steer the drop to the desired location; unwanted droplets are undeflected and captured by the return gutter. (Source: Durbeck, R.C. and Sherr, S. 1988. Hardcopy Output Devices. Academic Press, San Diego, CA. With permission.)

in commercial systems; electrostatic methods have yet to find widespread application, but have been used for facsimile recording; drop on demand, because of its simplicity and ease of implementation of color, has been widely accepted in the office and home market.

Continuous Ink Jet

The basic principle of continuous ink jet is to take advantage of the natural breakup process due to an instability in the jet that is formed when fluid is forced under pressure through a small orifice. This results from the interplay of surface tension and viscosity and takes place in a quasirandom manner unless external stimulation is applied. This breakup process was first studied by Rayleigh who characterized it via a growth rate for the instability, which depended on the jet diameter D, its velocity V , and the frequency F of any external stimulation. Rayleigh showed that the frequency for maximum growth rate of the instability was F = V/4.5D. By stimulating the jet at this frequency it is possible to obtain a uniform stream of droplets.

The typical method of providing this stimulation today is via a piezoelectric transducer as an integral part of the printhead.

image

To make use of these droplets for printing it is necessary to charge them at breakoff. This is ac- complished by placing electrodes in proximity to the breakup region of the jet. Deflection voltages are then applied farther downstream to direct the droplet to the substrate or into a collector for re- circulation and reuse. The earliest techniques in- volved charging the droplet and applying a vari- able deflection field to direct it to a specific spot on the paper, enabling full height characters to be printed in one pass (see Fig. 19.66). Later methods focused on producing a stream of charged droplets and using the printing (high-voltage) electrode to deflect unwanted drops for recirculation and reuse (Fig. 19.67). This technique, known as binary charged continuous ink jet, lends itself to the construction of multiple nozzle arrays, and there are a number of page-wide implementations in use.

Binary charged continuous ink jet with its high droplet rate makes a simple gray scaling technique possible. The dot on the paper is modulated in size by printing from one up to N droplets at the same location, where N is the number of different dot sizes desired. By operating at high frequencies and small drop volumes it is possible to produce sufficient gray levels such that full grayscale printing is achieved at reasonable print speeds. The most recent implementation of this method offers 512 gray levels at address- abilities between 200–300 pixels/in. To achieve the small fundamental droplet size, typical implementations employ glass capillaries with diameters of the order of 10 µm and are pressurized from 500–700 lb/in2.A color printhead will contain four capillaries, one for each color ink plus black.

Drop On Demand (DOD) Ink Jet

For office and home applications the complexities of continuous ink jet technology, such as startup and shutdown procedures, ink recirculation, and the limited nozzle count, have led to the development of drop on demand ink jet technology. These devices employ unpressurized ink delivery systems and, as implied by their name, supply a drop only when requested. The basic technique employed is to produce a volume change in either the ink supply channel or an ink chamber adjacent to the nozzle such that the resulting pressure wave causes drop ejection. Refill is achieved by capillary forces and most DOD systems operate with a slight negative pressure at the ink reservoir. The mechanism for generating the pressure wave dominates the design of these devices, and there are two techniques extant in common DOD printers. One employs the pressure pulse derived from the vaporization of superheated fluid, and the other makes use of piezoelectric materials, which can be deformed by the application of electric potentials.

Devices employing the vaporization of superheated fluid are known concurrently as thermal ink jet or bubble jet printers, the choice of name depending on the manufacturer. Since drop on demand ink jets rely on capillary refill, their operational frequencies are much lower than for continuous ink jet devices. This stresses the importance of the compactness of the actuating system so as to achieve reasonable printing speeds via multiple nozzle printheads. The nozzles must also be precisely registered with respect to each other if systematic print artifacts are to be avoided.

Thermal Ink Jet/Bubble Jet DOD Printers

When fluids are heated at extreme rates (e.g., 500 × 106 W/m2), they enter a short-lived metastable state where temperatures can far exceed the boiling point at atmospheric pressure. The difference between the elevated temperature and the boiling point is known as the degree of superheat. This process does not continue indefinitely, and all fluids have what is known as a superheat limit. At this point nucleation and vaporization will occur in the bulk of the fluid. These devices employ an electrically driven planar heater (typically, 50–60 µm2) in contact with the fluid. Under these conditions vaporization commences at the surface of the heater due to the presence of nucleation sites such as microscopic roughness. With correctly chosen heating rates this can be made very reliable. These heating rates lead to electrical pulse widths of 3–5 µs. In this time frame only a submicron portion of the fluid will be superheated. The net result is a vaporization pulse well in excess of atmospheric pressure and of approximately 3/4-µs duration. By locating a nozzle directly over or alongside the resistor this pressure pulse will eject a droplet (Fig. 19.68). Within limits of the drop volume desired, it is found that the linear dimensions of the nozzle diameter and planar resistor are comparable. The actuator is therefore optimally compact, and this enables high- nozzle count printheads. The fabrication of the resistors is accomplished by photolithographic techniques common to the IC industry and the resistor substrates are silicon with a thin layer of insulating silicon dioxide. Precise registration from nozzle to nozzle is guaranteed under these circumstances, and electrical drive circuits may be integrated into the head to provide multiplexing capability. This is a valuable attribute for scanning printheads, which employ a flexible printed circuit for interconnect. These fea- tures have produced printheads currently numbering 300 or more nozzles for a single color. An additional benefit of the compactness of this technology is that the ink supply can be fully integrated with the print- head. This provides the user with virtually maintenance free operation as the printhead is replaced when the ink supply is consumed. Since the majority of problems arise from paper dust particles finding their way into a nozzle and occasionally becoming lodged there, printhead replacement provides for user service at reasonable cost. Some implementations feature a semipermanent printhead, which is supplied by ink from

image

replaceable cartridges. The design choice is then a tradeoff involving many factors: frequency of maintenance, cost of operation, how often the printer is to be used, type of material printed, etc. The important subject of ink and paper for these printers will be taken up at the end of the section on DOD technologies.

Piezoelectric DOD Printers

Crystalline structures, which develop a spontaneous dipole moment when mechanically strained, thereby distorting their crystal structures, are called piezoelectric. These materials may conversely be caused to be distorted via electrical potentials applied to the appropriate planes of the cyrstal. Piezoceramics have a polarization direction established during the manufacturing process, and the applied fields then interact with this internal polarization to produce mechanical displacement. Depending on the direction of the applied fields, the material can compress or extend longitudinally or transversely. These materials have found widespread use as transducers for DOD printers. An early form was that of a sleeve over a glass capillary, which terminated in a nozzle (Fig. 19.69). Depending on the location of the electrodes either a radial or longitudinal compression could be applied leading to a pressure wave in the enclosed ink sufficient to eject a droplet. Using the diameter of the nozzle as a unit of linear dimension, this approach placed the transducer well upstream from the nozzle (Fig. 19.70). Implementation of this design in a multinozzle printhead required careful matching of transducers and fluid impedance of the individual channels feeding each nozzle. This was a challenging task, and most designs bond a planar transducer to an ink chamber adjacent to a nozzle, as shown in Fig. 19.71.

image

image

The method of directly coupling the piezoelectric transducer through an ink chamber to an exit nozzle has seen many enhancements and developments since its invention. A feature of some designs is that of air flow channeled at the orifice in such a way as to entrain the droplet as it exits the nozzle and to improve its directional stability, as well as to accelerate the droplet. This enables the device to be operated at lower transducer deflections and, therefore, at higher droplet rate since the settling time of the device has been reduced. Piezodevices can operate at elevated temperatures and are used to eject inks that are solid at room temperature. For solid inks the material is melted to a design temperature for appropriate viscosity and surface tension and then supplied to the piezoelectric-driven ink chamber. The ink then solidifies instantly on contact with the substrate.

image

image

A more recent innovation employs piezoelectric transducers operated in the longitudinal mode. The transducers are formed from a single block of piezoceramic material in the form of an array of rods. Suitably placed potentials excite the rods to extend in the longitudinal direction. By bonding one end of the rod in contact with a thin membrane forming the base of an ink chamber, a pressure pulse is generated similar to that of the previous design (Fig. 19.72). To achieve sufficient pressure amplitude a diaphragm is used that is substantially larger than the orifice exit diameter. The consequence of this is that high nozzle density printheads will require multiple rows of nozzles (Fig. 19.73). This design has been implemented to date with liquid inks only.

Grayscale Methods for DOD Ink Jet Printers

The drop rates for DOD devices are typically an order of magnitude less than those of continuous, pressurized systems. This dictates different strategies for the achievement of grayscale. Techniques are based on the generation of a few gray levels that, when incorporated into digital halftoning algorithms, such as error diffusion, clustered, dispersed dot, or blue-noise dither, produce a satisfactory grayscale. The number of levels necessary, their position relative to the maximum modulation achievable (i.e., maximum

image

image

dot size or maximum intensity), and the specialized techniques employed in digital halftoning are an area of active research. There are many patents in the literature governing these techniques, and manufacturers seek to distinguish their devices by the technique offered. When combined with resolution enhancement methods mentioned in the section on print quality, printers with medium resolution, such as 300 dpi and 2 bits of grayscale, can produce remarkable results for both images, text, and graphics.

There are several methods available for DOD devices to modulate either the size or intensity of the dot. For piezodevices, pulse width modulation has been shown to produce droplets of different volumes and, therefore, dot sizes. All DOD ink jet devices have the option of ejecting a droplet repeatedly at the same location by passing over the same swath as many times as desired but this will affect throughput rates. Printheads with sufficient nozzle count can do this and still keep throughput rates within reason. For vapor bubble driven devices, a unique option exits by virtue of the short duration of the actuating bubble. Typical lifetime of bubbles in these devices, from vaporization through to bubble collapse, is of the order of 20 µs. If the resistor is pulsed shortly after bubble collapse, a second droplet can be ejected virtually on the tail of the initial droplet. This technique has been called multidrop in the literature. The ink chamber is fired under partial refill conditions, but with proper design several droplets can be ejected by this method at drop rates at around 40 kHz and having substantially the same volume (Fig. 19.74). These merge on the substrate to produce different dot sizes according to the number of droplets ejected for the location. This is not an option for most piezodevices due to the slower settling time of the actuator. Dye dilution methods have also been demonstrated as a way of modulating the intensity of the dot. If no halftone algorithm is employed, this will require many sets of nozzles to accommodate the different dye dilutions.

Ink and Paper for Ink Jet Devices

When liquid inks are employed the paper properties have a major impact on the print quality. The ink droplets will be absorbed by a substrate whose internal structure and surface energy will determine the size, shape, and overall microstructure of the drop. Paper, being a interlocking mesh of cellulose fibers with sizing and binding chemistry, is quite variable in nature. Figure 19.75 is a schematic indication of the response of paper to different volumes of ink. Note that it can be very nonlinear at low drop volumes and either flat or high gain at large volumes. The implication is that by simply changing the paper the print quality is altered. To control this variablity some papers are given a thin coat of claylike material containing whiteners, which are often fluorescent. This coating presents a microporous structure that is more uniform than the cellulose fibers.

Dot formation on coated papers is therefore cir- cular and more stable than on uncoated stock. Un- coated papers allow the ink to wick down the fibers producing an effect known as feathering of the dot. In this case, microscopic tendrils of dye appear at the edge of the dot giving it and the overall print quality a blurred effect. This is particularly serious in the case of text printing, which benefits most from sharp dot edges. Feathering is common for papers used in xerographic copiers. Bond paper, which is a popular office stock, is a partially coated paper and exhibits little feathering.

image

Depending on the manufacturer, several techniques are employed to minimize the impact of paper variability on print quality. One method, the use of a heater, takes advantage of the fact that absorption into the paper does not commence immediately upon contact. There is a period known as the wetting time, which can be as long as 80 µs during which no absorption takes place. The application of heat immediately in the vicinity of the printhead swath can effectively “freeze the dot” by vaporizing carrier. This makes the printer insensitive to change in paper stock and provides uniformly high print quality regardless of substrate. Other methods make use of altering the fluid chemistry by means of surfactants, which increase penetration rate, and high vapor pressure additives to increase removal of fluid into the atmosphere. If the ink penetrates quickly then it is less likely to spread sideways and, thereby, dot size variation is lessened. When choosing a drop on demand ink jet printer, it is advisable to test the performance over the range of paper stocks to be used. In some cases it will be found that high-quality printing can only be obtained when a paper specified by the manufacturer is chosen.

With reference to the section on print quality, it should be kept in mind that the choice of paper will affect the overall dynamic range of print. Text printing, to be pleasing, needs to have an optical density of at least 1.3–1.4. For images, the more dynamic range the better, and special coated stock will always excel over copy paper if image quality is important. Many of the coated papers available still have a matte surface that diffusely reflects the light and limits the dynamic range for reasons previously discussed. Some manufacturers now offer a high-gloss substrate specifically intended for images. These substrates have a plastic base with special coatings to absorb the ink through to the substrate leaving a high gloss finish. This greatly improves the dynamic range to the point of approximating that of photographic paper. These substrates provide ink jet printers with the capability to produce highly saturated brilliant colors with exceptional chromatic and dynamic range and should be used if image printing is the primary objective. Besides excellent print quality there are other demands placed on the ink. It must provide reli- able operation of the device and a durable image. By this it is meant that the image does not fade rapidly, that it is mechanically sound, that it cannot be easily removed from the paper, and that it is impervious to liquids. For liquid ink, this is a challenge since solvent-based color highlighter pens are commonly used to mark up printed documents. These solvents can cause the ink to smear depend- ing on the choice of ink chemistry and the manner in which the colorants are fixed to the substrate. These issues focus on colorant chemistry, and much research is applied to this problem. There are fade-proof dyes, but many are either incompatible with the ink vehicle, typically water, or are toxic or mutagenic.


Network Communication: Wide Area Networks.

Wide Area Networks

Applications

Wide Area Network Architecture

To better understand all of the current and emerging wide area networking technologies and services, a simple model defining the major segments and interrelationships of an overall wide area network architecture is shown in Fig. 19.64. User demands are the driving force behind the current and emerging

image

wide area network services which are offered to business and residential customers. Companies offering these services are in business to generate profits by implementing the underlying architectures that will enable them to offer the wide area networking services that users are demanding at the lowest possible cost. Users are demanding simple, transparent access to variable amounts of bandwidth as required. In addition, this wide area network access must offer support for transmission of data, video, imaging, and fax as well as voice. One of the primary driving forces of increased capacity and sophistication for wide area network services is LAN interconnection.

Circuit Switching vs. Packet Switching

Switching of some type or another is necessary in a wide area network because the alternative is unthinkable. To explain, without some type of switching mechanism or architecture, every possible source of data in the world would have to be directly connected to every possible destination of data in the world, not a very likely prospect.

Circuit Switching

Switching allows temporary connections to be established, maintained, and terminated between message sources and message destinations, sometime called sinks in data communications. In the case of the voice- based phone network with which most people are familiar, a call is routed through a central office piece of equipment known as a switch, which creates a temporary circuit between the source phone and the phone of the party to whom one wishes to talk. This connection or circuit only lasts for the duration of the call. This switching technique is known as circuit switching and is one of two primary switching techniques employed to deliver messages from here to there. In a circuit switched network, a switched dedicated circuit is created to connect the two or more parties, eliminating the need for source and destination address information such as that provided by packetizing techniques.

The switched dedicated circuit established on circuit switched networks makes it appear to the user of the circuit as if a wire has been run directly between the phones of the calling parties. The physical resources required to create this temporary connection are dedicated to that particular circuit for the duration of the connection. If system usage should increase to the point where insufficient resources are available to create additional connections, users would not get a dial tone.

Packet Switching

The other primary switching technique employed to deliver messages from here to there is known as packet switching. Packet switching differs from circuit switching in several key areas. First, packets travel one at a time from the message source through a packet switched network, otherwise known as a public data network, to the message destination. A packet switched network is represented in network diagrams by a symbol which resembles a cloud. Figure 19.65 illustrates such a symbol, as well as the difference between circuit switching and packet switching. The cloud is an appropriate symbol for a packet switched network since all that is known is that the packet of data goes in one side of the public data network (PDN) and comes out the other. The physical path which any packet takes may be different than other packets and in any case, is unknown to the end users. What is beneath the cloud in a packet switched network is a large number of packet switches, which pass packets among themselves as the packets are routed from source to destination. Remember that packets are specially structured groups of data, which include control and address information in addition to the data itself. These packets must be assembled (control and address information added to data) somewhere before entry into the packet switched network and must be subsequently dis- assembled before delivery of the data to the message destination. This packet assembly and disassembly is done by a device known as a packet assembler/disassembler (PAD). PADs may be stand-alone devices or may be integrated into modems or multiplexers.

These PADs may be located at an end-user location, or may be located at the entry point to the packet switched data network. Figure 19.65 illustrates the latter scenario in which the end users employ regular modems to dial up the value added network (VAN) or on-line information service, which provides the PADs to properly assemble the packets prior to transmission over the packet switched network.

image

Packet Switched Networks

The packet switches illustrated inside the PDN cloud in Fig. 19.65 are generically known as data switching exchanges (DSEs), or packet switching exchanges (PSEs). DSE is the packet switching equivalent of the DCE (data communications equipment) and DTE (data terminal equipment) categorization for modems and dial-up transmission.

Another way in which packet switching differs from circuit switching is that as demand for transmission of data increases on a packet switched network, additional users are not denied access to the packet switched network. Overall performance of the network may suffer, errors and retransmission may occur, or packets of data may be lost, but all users experience the same degradation of service. This is because, in the case of a packet switched network, data travel through the network one packet at a time, traveling over any available path within the network rather than waiting for a switched dedicated path as in the case of the circuit switched network.

For any packet switch to process any packet of data bound for anywhere, it is essential that packet ad- dress information be included on each packet. Each packet switch then reads and processes each packet by making routing and forwarding decisions based on the packet’s destination address and current network conditions. The full destination address uniquely identifying the ultimate destination of each packet is known as the global address.

Because an overall data message is broken up into numerous pieces by the packet assembler, these message pieces may actually arrive out of order at the message destination due to the speed and condition of the alternate paths within the packet switched network over which these message pieces (packets) traveled. The data message must be pieced back together in proper order by the destination PAD before final transmission to the destination address. These self-sufficient packets containing full source and destination address information plus a message segment are known as datagrams.

A Business Perspective on Circuit-Switching vs Packet Switching

If the top-down model were applied to an analysis of possible switching methodologies, circuit switching and packet switching could be properly placed on either the network or technology layers. In either case, in order to make the proper switching methodology decision, the top-down model layer directly above the network layer, namely, the data layer must be thoroughly examined. The key data layer question becomes: What is the nature of the data to be transmitted and which switching methodology best supports those data characteristics? The first data-related criteria to examine is the data source. What is the nature of the application program (application layer) which will produce this data? Is it a transaction oriented program or more of a batch update or file oriented program?

A transaction oriented program, producing what is sometimes called interactive data, is characterized by short bursts of data followed by variable length pauses due to users reading screen prompts or pauses between transactions. This bursty transaction-oriented traffic, best categorized by banking transactions at an automatic teller machine, must be delivered as quickly and reliably as the network can possibly perform. In addition to data burstiness, time pressures, and reliability constraints are other important data characteristics that will assist in switching methodology decision making.

Applications programs more oriented to large file transfers or batch updates have different data characteristics than transaction oriented programs. Overnight updates from regional offices to corporate headquarters or from local stores to regional offices are typical examples. Rather than occurring in bursts, the data in these types of applications are usually large and flowing steadily. These transfers are important, but often not urgent. If file transfers fail, error detection and correction protocols can retransmit bad data or even restart file transfers at the point of failure.

Defining Terms

Carrier sense multiple access with collision detection (CSMA/CD): A scheme for network communication flow.

Client: The end-users of a network and its resources, typically workstations or personal computers.

Ethernet: A network architecture adhering to IEEE 802.3; a CSMA/CD-based architecture traditionally installed in a bus configuration, but more recently typically in a hub-based star physical topology.

Fiber distributed data interface (FDDI): A networking scheme using separate rings around which data move simultaneously in opposite directions to achieve high speed and operational redundancy.

Gateway: A network device designed to provide a transparent connection between two totally different computing environments.

Hub: The heart of a star physical topology, alternatively known as a concentrator, repeater, or multistation access unit (MAU).

Network interface card (NIC): The physical device or circuit used to interface the network with a local workstation or device.

Network management: The overall task of monitoring and analyzing network traffic and correcting network-related problems.

Open systems interconnection (OSI) model: A framework for organizing networking technology developed by the International Standards Organization.

Router: A device that reads specific network layer protocols in order to maximize filtering and forwarding rates on a network.

Server: The element of a network designed to facilitate and manage the sharing of resources among client devices and workstations.

Token ring: A network architecture adhering to IEEE 802.5, utilizing a star physical topology, sequential message delivery, and a token passing access methodology.

Wireless LAN: An emerging networking system utilizing radio or infrared media as the interconnection method between workstations.

References

Bachus, K. and Longsworth, E. 1993. Road nodes. Corporate Computing 2(3):54–61.

Bradner, S. and Greenfield, D. 1993. Routers: Building the highway. PC Magazine 12(6):221–270.

Derfler, F. 1993. Ethernet adapters: Fast and efficient. PC Magazine 12(3):191.

Derfler, F. 1993. Making the WAN connection: Linking LANs. PC Magazine 12(5):183–206.

Derfler, F. 1993. Network printing: Sharing the wealth. PC Magazine 12(2):249.

Derfler, F. 1993. To catch a thief. PC Magazine 12(16):NE1–NE9.

Derfler, F. 1994. Extend your reach. PC Magazine 13(14):315–351.

Derfler, F. 1994. Peer-to-peer LANs: Peer pressure. PC Magazine 13(8):237–274.

Donovan, W. 1993. A pain-free approach to SNA internetworking. Data Communications 22(16):99.

Gasparro, D. 1994. Putting wireless to work. Data Communications 23(5):57–58.

Goldman, J. 1995. Applied Data Communications: A Business Oriented Approach. Wiley, New York.

Greenfield, D. 1993. To protect and serve. PC Magazine 12(9):179.

Gunnerson, G. 1993. Network operating systems: Playing the odds. PC Magazine 12(18):285–333.

Harvey, D. and Santalesa, R. 1994. Wireless gets real. Byte 19(5):90.

Held, G. 1993. Internetworking LANs and WANs. Wiley, New York.

Held, G. 1994. The Complete Modem Reference. Wiley, New York.

Held, G. 1994. Ethernet Networks: Design Implementation, Operation and Management. Wiley, New York.

Held, G. 1994. Local Area Network Performance Issues and Answers. Wiley, New York.

Heywood, D. et al. 1992. LAN Connectivity. New Riders, Carmel, IN.

Jander, M. and Johnson, J. 1993. Managing high speed WANs: Just wait. Data Communications 22(7):83.

Johnson, J. 1993. LAN modems: The missing link for remote connectivity. Data Communications 22(4):101.

Johnson, J. 1994. Wireless data: Welcome to the enterprise. Data Communications 23(5):42–55.

Karney, J. 1993. Network lasers: Built for speed. PC Magazine 12(20):199.

Madron, T. 1993. Peer-to-Peer LANs: Networking Two to Ten PCs. Wiley, New York.

Mandeville, R. 1994. Ethernet switches evaluated. Data Communications 23(4):66–78.

Mathias, C. 1994. New LAN gear naps unseen desktop chains. Data Communications 23(5):75–80.

Peterson, M. 1993. Network backup evolves. PC Magazine 12(16):277–311.

Pompili, T. 1994. The high speed relay. PC Magazine 13(1):NE1–NE12.

Quiat, B. 1994. V.FAST, ISDN, or switched 56 K. Network Computing 5(3):70.

Raskin, R. 1993. Antivirus software: Keeping up your guard. PC Magazine 12(5):209–264.

Rosen, B. and Fromme, B. 1993. Toppling the SNA internetworking language barrier. Data Communications 22(9):79.

Saunders, S. 1993. Choosing high speed LANs: Too many technologies, too little time? Data Communications 22(13):58–70.

Saunders, S. 1994. Building a better token ring network. Data Communications 23(7):75.

Saunders, S. 1994. Full duplex ethernet: More niche than necessity? Data Communications 23(4):87–92.

Schlar, S. 1990. Inside X.25: A Manager’s Guide. McGraw–Hill, New York.

Shimada, K. 1994. Fast talk about fast ethernet. Data Communications 23(5):21–22.

Stallings, W. 1992. ISDN and Broadband ISDN, 2nd ed. Macmillan, New York.

Stevenson, T. 1993. Best of a new breed: Groupware—Are we ready? PC Magazine 12(11):267–297.

Tabibian, O.R. 1994. Remote access: It all comes down to management. PC Magazine 13(14):NE1–NE22.

Thomas, R. 1994. PPP starts to deliver on interoperability promises. Data Communications 23(6):83.

Tolly, K. 1993. Can routers be trusted with critical data? Data Communications 22(7):58.

Tolly, K. 1993. Checking out channel-attached gateways. Data Communications 22(8):75.

Tolly, K. 1993. Token ring adapters: Evaluated for the enterprise. Data Communications 22(3):73.

Tolly, K. 1994. FDDI adapters: A sure cure for the bandwidth blues. Data Communications 23(10):60.

Tolly, K. 1994. How accurate is your LAN analyzer? Data Communications 23(2):42.

Tolly, K. 1994. The new branch-office routers. Data Communications 23(11):58.

Tolly, K. 1994. Testing dial up routers: Close, but no cigar. Data Communications 23(9):69.

Tolly, K. 1994. Testing remote ethernet bridges. Data Communications 23(8):81.

Tolly, K. 1994. Testing remote token ring bridges. Data Communications 23(6):93.

Tolly, K. 1994. Testing UNIX-to-SNA gateways. Data Communications 23(7):93.

Tolly, K. 1994. Wireless internetworking. Data Communications 22(17):60.

Further Information

Books:

The following two books are excellent additions to a professional library for overall coverage of data communications and networking.

Newton, H., Newton’s Telecom Dictionary, Telecom Library, New York.

Goldman, J. E., Applied Data Communications: A Business Oriented Approach, Wiley, New York.


Network Communication: Internetworking.

Internetworking

Applications: What Can Internetworking Do for You?

It is nearly inevitable that sooner or later nearly any organization will need to share information across multiple information platforms or architectures. This sharing may be between LANs that may differ in net- work architecture or network operating systems. Information systems that combine multiple computing platforms or a variety of network architectures and network operating systems are often referred to as enterprise computing environments. Underlying this enterprise computing environment is an enterprise network or internetwork. The key to successful internetworking is that to the end user sitting at a LAN-attached workstation, the connectivity to enterprise computing resources should be completely transparent.

In other words, an end user should not need to know the physical location of a database server or disk drive to which they need access. All the user needs to know is a node name or drive indicator letter and the fact that when these node name or drive letters are entered, data is properly accessed from wherever it may be physically located. That physical location may be across the room or across the country.

As information has become increasingly recognized as a corporate asset to be leveraged to competitive advantage, the delivery of that information in the right form, to the right person at the right place and time has become the goal of information systems and the role of internetworking. Mergers, acquisitions, and enterprise partnerships have accelerated the need to share information seamlessly across geographic or physical LAN boundaries. Intelligent inter-LAN devices perform the task of keeping track of what network attached resources are located and where and how to get a packet of data from one LAN to another. This task is further complicated by the fact that LANS can differ in any of the following categories: (1) network architecture, (2) media, (3) network operating system, and (4) operating system.

This collection of differences is defined by rules or protocols that define how certain clearly defined aspects of network communications are to take place. When LANs that need to share information operate according to different protocols, an inter-LAN device that has protocol conversion capabilities must be employed. In cases such as this, the inter-LAN device would be transmitting data across logical, as opposed to physical or geographic, boundaries. Among the inter-LAN devices which will be explored in this section

image

are repeaters, bridges, routers, and gateways. Although the differences in functionality of these devices will be distinguished from a technical standpoint, there is no guarantee that manufacturers will follow this differentiation. Functional analysis of data communications devices is the best way to assure that inter-LAN devices will meet internetworking connectivity needs. Internetworking analysis and design is a highly complex and confusing area of study. The purpose of this section is to familiarize the reader with internetworking technology and applications and to provide a list of resources for further study.

The OSI Model and Internetworking Devices

The OSI model was first introduced in Sec. 19.7.1 as a common framework or reference model within which protocols and networking systems could be developed with some assurance of interoperability. In this section, the OSI model provides a most effective framework in which to distinguish between the operational characteristics of the previously mentioned internetworking devices. Figure 19.62 depicts the relationship between each type of internetworking device and its related OSI layer. Each device as well as the related OSI model layer will be explained in detail.

Internetworking Technology

Repeaters: Layer 1—The Physical Layer

Remember that all data traffic on a LAN is in a digital format of discrete voltages of discrete duration traveling over one type of physical media or another. Given this, a repeater’s job is fairly simple to understand:

1. Repeat the digital signal by regenerating and retiming the incoming signal.

2. Pass all signals between all attached segments.

3. Do not read destination addresses of data packets.

4. Allow for the connection of different types of media.

5. Effectively extend overall LAN distance by repeating signals between LAN segments.

A repeater is a nondiscriminatory internetworking device. It does not discriminate between data pack- ets. Every signal which comes into one side of a repeater gets regenerated and sent out the other side of the repeater. Repeaters are available for both ethernet and token ring network architectures for a wide variety of media types. A repeater is a physical layer device concerned with physical layer signaling protocols relating to signal voltage levels and timing. It cannot distinguish between upper layer protocols such as between ethernet vs. token ring frames (layer 2 , data link protocols). Therefore, repeaters must be specifically manufactured for either ethernet or token ring network architectures. The primary reasons for employing a repeater are (1) increase the overall length of the network media by repeating signals across multiple LAN segments, (2) isolate key network resources onto different LAN segments, and (3) some repeaters also allow network segments of the same network architecture but different media (layer 1—physical) types to be interconnected.

Bridges: Layer 2—The Data Link Layer

Bridge Functionality

The primary reasons for employing bridges are (1) network traffic on a LAN segment has increased to the point where performance is suffering, and (2) access from the departmental LAN to the corporate LAN backbone needs to be controlled so that local LAN data is not unnecessarily causing congestion problems on the corporate backbone network.

By dividing users across multiple LAN segments connected by a bridge, a substantial reduction in LAN traffic on each segment can be achieved provided the division of users is done in a logical manner. Users should be divided according to job function, need to communicate with each other, and need to access data stored on particular servers. The rule of thumb for segmenting users is that 80% of LAN traffic should remain within the LAN segment and only about 20% should cross the bridge to adjacent LAN segments. Controlling access to the corporate backbone via a bridge can ensure the viability of enterprise communications by only allowing essential network communication onto the corporate backbone. Servers and other internetworking devices can be connected directly to the corporate backbone while all user’s workstations are connected to LAN segments isolated from the corporate backbone by bridges.

When users on one LAN need occasional access to data or resources from another LAN, an internetworking device, which is more sophisticated and discriminating than a repeater, is required. From a comparative standpoint on the functionality of bridges vs repeaters, one could say that bridges are more discriminating. Rather than merely transferring all data between LANs or LAN segments like a repeater, a bridge reads the destination address of each data frame on a LAN, decides whether the destination is local or remote (on the other side of the bridge), and only allows those data frames with nonlocal destination addresses to cross the bridge to the remote LAN.

How does the bridge know whether a destination is local or not? Data-link protocols such as ethernet contain source addresses as well as destination addresses within the predefined ethernet frame layout. A bridge also checks the source address of each frame it receives and adds that source address to a table of known local nodes. After each destination address is read, it is compared with the contents of the known local nodes table in order to determine whether the frame should be allowed to cross the bridge or not (whether the destination is local or not). Bridges are sometimes known as a forward-if-not-local device.

This reading, processing, and discriminating indicates a higher level of sophistication of the bridge, afforded by installed software.

Bridge Categorization

Bridges come in many varieties. Physically, bridges may be cards that can be plugged into an expansion slot of a PC, or they may be standalone devices. Although it is known that the bridge will do the internetwork processing between two LANs, the exact nature of that processing, as well as the bridge’s input and output interfaces, will be determined by the characteristics of the two LANs that the bridge is internetworking. In determining the attributes of the input and output bridge one must consider the following issues: MAC sublayer protocol, speed of LANs, local or remote, and wide area network services and media.

1. MAC Sub-Layer Protocol: Depending on the MAC sublayer or network architecture of the LANs to be bridged, any of the following types of bridges may be required: transparent bridges, translating

image

bridges, encapsulating bridges, source routing bridges, source routing transparent bridges, and adaptive source routing transparent bridges. First and foremost, are the two LANs which are to be bridged ethernet or token ring? Bridges that connect LANs of similar data link format are known as transparent bridges. A special type of bridge that includes a format converter can bridge between ethernet and token ring. These special bridges may also be called multiprotocol bridges or translating bridges. A third type of bridge, somewhat like a translating bridge, is used to bridge between ethernet and FDDI networks. Unlike the translating bridge, which must actually manipulate the data-link layer message before repackaging it, the encapsulating bridge merely takes the entire ethernet data link layer message and stuffs it in an envelope (data frame) that conforms to the FDDI data-link layer protocol. Source routing bridges are specifically designed for connecting token ring LANs. Bridges that can support links between source routing token ring LANs and nonsource routing LANs, such as ethernet, are known as source routing transparent bridges. Finally, bridges that can link transparent bridged ethernet LAN segments to each other, source routing token ring LAN segments to each other, or any combination of the two are known as adaptive source routing transparent bridges. Figure 19.63 outlines these various bridge possibilities.

2. Speed of LANs: The speeds of the input and output LANs must be known in order to determine what speed conversion, if any, must be performed by our bridge.

3. Local or Remote: Having determined the MAC layer protocol and speed of the LANs, their geo- graphic proximity to one another must be taken into consideration. If the two LANs are not in close enough proximity to link via traditional LAN media such as UTP, coax, or fiber, the bridge must be equipped with an interface appropriate for linking to wide area carrier services.

Bridge Performance

Bridge performance is generally measured by two criteria:

1. Filtering rate: Measured in packets per second or frames per second. When a bridge reads the destination address on an ethernet frame or token ring packet and decides whether or not that packet should be allowed access to the internetwork through the bridge, that process is known as filtering.

2. Forwarding rate: Also measured in packets per second or frames per second. Having decided whether or not to grant a packet access to the internetwork in the filtering process, the bridge now must perform a separate operation of forwarding the packet onto the internetwork media whether local or remote.

Bridges, Protocols, and the OSI Model

Bridges read the destination addresses within data frames of a predefined structure or protocol. In other words, ethernet and token ring network architectures define a bit-by-bit protocol for formation of data frames. The bridge can rely on this protocol and, therefore, knows just where to look within the ethernet data frames to find the bits, which represent the destination addresses. In terms of the OSI model, ethernet and token ring are considered MAC sublayer protocols. The MAC sublayer is one of two sublayers of OSI model layer 2—the data link layer. The other data link sublayer is known as the logical link control sublayer. Because the protocols that a bridge reads and processes are located on the MAC sublayer, bridges are sometimes referred to as MAC layer bridges.

Embedded within the data field of the ethernet frame are all of the higher OSI layer protocols. These higher layer protocols can vary independently of the data-link layer ethernet protocol. In other words, the data-link layer protocols such as ethernet and token ring are network architectures, whereas the network layer protocols could be from any one of a number of different network operating systems. Bridges only pay attention to network architecture (MAC sublayer) protocols or formats. They completely ignore upper level protocols.

Most network operating systems actually consist of stacks of protocols. In some cases, this protocol stack may consist of a separate protocol for each of layers 3–7. Each protocol of a network operating system performs a different networking related function corresponding to the generalized functional definition for the corresponding layer of the OSI model. As an example, the network layer protocol for TCP/IP suite of protocols is known as internet protocol (IP).

Routers: The Network Layer Processors

The delivery of data packets to destination addresses across multiple LANs, and perhaps over wide area network links, is the responsibility of a class of internetworking devices known as routers. Routers are primarily employed for the following reasons:

1. To build large hierarchical networks. Routers are used to create the backbone network itself.

2. To take part in or gain access to a larger hierarchical network such as the Internet.

Router Functionality

Although they both examine and forward data packets, routers and bridges differ significantly in two key functional areas. First, although a bridge reads the destination address of every data packet on the LAN to which it is attached, a router only examines those data packets that are specifically addressed to it. Second, rather than just merely allowing the data packet access to the internetwork in a manner similar to a bridge, a router is more cautious as well as more helpful. Before indiscriminately forwarding a data packet, a router first confirms the existence of the destination address as well as the latest information on available network paths to reach that destination. Next, based on the latest traffic conditions, the router chooses the best path for the data packet to reach its destination and sends the data packet on its way. The word best is a relative term, controlled by a number of different protocols, which will be examined shortly.

The router itself is a destination address, available to receive, examine, and forward data packets from anywhere on any network to which it is either directly or indirectly internetworked. The destination address on an ethernet or token ring packet must be the address of the router that will handle further internetwork forwarding. Thus, a router is addressed in the data-link layer destination address field. The router then discards this MAC sublayer envelope, which contained its address, and proceeds to read the contents of the data field of the ethernet or token ring frame.

Just as in the case of the data-link layer protocols, network layer protocols dictate a bit-by-bit data frame structure that the router understands. What looked like just data and was ignored by the data-link layer internetworking device (the bridge) is unwrapped by the router and examined thoroughly in order to determine further processing. After reading the network layer destination address and the protocol of the network layer data, the router consults its routing tables in order to determine the best path on which to forward this data packet. Having found the best path, the router has the ability to repackage the data packet as required for the delivery route (best path) it has chosen.

As an example, if a packet switched data network was chosen as the wide area link for delivery, then the local router would encapsulate the data packet in compliant envelope. On the other hand, if the best path was over a local ethernet connection, the local router would put the data packet back into a fresh ethernet envelope and send it on its way.

Unlike the bridge, which merely allows access to the internetwork (forward-if-not-local logic), the router specifically addresses the data packet to a distant router. Before a router actually releases a data packet onto the internetwork, however, it confirms the existence of the destination address to which this data packet is bound. Only once the router is satisfied with both the viability of the destination address, as well as with the quality of the intended path, will it release the carefully packaged data packet. This meticulous processing activity on the part of the router is known as forward-if-proven-remote logic.

Determination of Best Path

The best path can take into account variables such as

1. Number of intermediate hops. That is, how many other routers will the packet have to be processed by before it reaches its final destination? Every router takes time to process the data packet. Therefore, the fewer the routers, the faster the overall delivery.

2. The speed or condition of the communications circuits. Routers can dynamically maintain their routing tables keeping up to the minute information on network traffic conditions.

3. The protocol of the network operating system, for instance, remembering that multiple protocols can be sealed within ethernet envelopes. We may ask the router to open the ethernet envelopes and forward all NetWare (IPX) traffic to one network and all TCP/IP (IP) to another. In some cases, a certain protocol may require priority handling.

Multiprotocol Routers

Routers are made to read specific network layer protocols in order to maximize filtering and forwarding rates. If a router only has to route one type of network protocol, then it knows exactly where to look for destination addresses every time and can process packets much faster. However, realizing that different network layer protocols will have different packet structures with the destination addresses of various lengths and positions, some more sophisticated routers known as multiprotocol routers have the capability to interpret, process, and forward data packets of multiple protocols.

Some common network layer protocols and their associated network operating systems or upper layer protocols as well as other protocols which are actually data-link control protocols processed by some routers are listed in Table 19.6. Remembering that bridges are used to process data-link layer protocols, those routers that can also perform the functionality of a bridge are called bridging routers or brouters.

image

Like bridges, routers generally take one of the two physical forms: (1) stand-alone variety, self-contained; and (2) modularized for installation in a slotted chassis. Routers may be installed to link LAN segments either locally or remotely. Boundary routing recognizes the need for simple, affordable wide area network devices at remote offices while providing full routing capabilities throughout the wide area network. Bound- ary routing’s physical topology is sometimes referred to as a hub and spoke topology due to the fact that each remote branch is connected to a hub office via a single WAN link. If redundant links are a business requirement of a particular node, then it must be a full-function router and not a boundary router in this topology. Full-function routers are placed at each hub or central node, while less sophisticated boundary routers, or branch-office routers, are placed at each remote or spoke node. Since there are only connected to a single WAN link, these boundary routers make only one decision when examining each piece of data, “If these data are not addressed to a local destination, then it should be forwarded.” This forward-if-not-local logic should suggest that, in fact, these boundary routers are acting as bridges.

Gateways

Recalling that in terms of the OSI model, repeaters are considered a physical layer (layer 1) device, bridges are considered a data-link layer (layer 2) device, and routers are considered a network layer (layer 3) device, it could be said that gateways provide for interoperability on the session, presentation, and application layers (layers 5–7). Whereas repeaters, bridges and routers provide increasingly more sophisticated connection between two LANs, gateways provide transparent connection between two totally different computing environments. Specialized gateways also translate between different database management systems and are called database gateways, or between different e-mail systems and are called e-mail gateways.

The gateway is usually a computer with physical connections to both computing environments to be linked. In addition, the gateway also executes specially written software, which can translate messages between the two computing environments. Unlike other internetworking devices described, gateways are more concerned with translation than with processing destination addresses and delivering messages as efficiently as possible.


Network Communication: Local Area Networks.

Local Area Networks

LAN Applications

Possible business analysis questions for local area networking solutions are listed in Fig. 19.59. This list of business analysis questions is not meant to be exhaustive or all encompassing. Two important things to

image

remember about any list of business analysis questions are

1. The questions should dig deeper into the required information systems-related business activities.

2. The answers to these questions should provide sufficient insight as to enable the investigation of possible technical solutions.

Next, each of the business analysis questions’ categories is explained briefly.

User Issues

User satisfaction is the key to any successful network implementation. To satisfy users, their needs must be first thoroughly understood. Beyond the obvious question of: How many users must the network support? are the more probing questions dealing with specific business activities of individual users. Do users process many short transactions throughout the day? Do users require large file transfers at certain times of day? Are there certain activities which absolutely must be done at certain times of day or within a certain amount of elapsed time? These questions are important in order to establish the amount of network communication required by individual users. Required levels of security should also be addressed. Are payroll files going to be accessed via the network? Who should have access to these files and what security measures will assure authorized access? What is the overall technical ability of the users? Will technical staff need to be hired? Can support be obtained locally from an outside organization?

Local Communication

Remembering that these are business analysis questions and not technical analysis questions, users really cannot be asked how fast their network connections must be. Bits per second or megabits per second have little or no meaning for most users. If users have business activities such as computer aided design/computer aided manufacturing (CAD/CAM) or other three-dimensional modeling or graphics software that will be accessing the network, the network analyst should be aware that these are large consumers of network bandwidth and should document those information system-related business activities which may be large consumers of networking bandwidth.

image

Resource Sharing

It is important to identify which resources and how many are to be shared: printers, modems, faxes, and the preferred locations of these shared resources. The required distance between shared resources and users can have a bearing on acceptable technical options.

image

File Sharing and Application Sharing

Which programs or software packages are users going to need to perform their jobs? Which programs are they currently using? Which new products must be purchased? In many cases, network versions of software packages may cost less than multiple individual licenses of the same software package for individual PCs. The network analyst is really trying at this point to compile a listing of all applications programs which will be shared by users. Not all PC-based software packages are available in network versions and not all PC-based software packages allow simultaneous access by multiple users. Once a complete list of required shared application programs has been completed, it is important to investigate both the availability and capability of the network versions of these programs in order to assure happy, productive users and the successful attainment of business needs.

Distributed Data Access

Although users cannot be expected to be database analysts, sufficient questions must be asked in order to determine which data is to be shared by whom and where these users are located. The major objective of data distribution analysis is to determine the best location on the network for the storage of various data files. That best location is usually the one closest to the greatest number of the most active users of that data.

Some data files that are typically shared, especially in regionalized or multilocation companies, include customer files, employee files, and inventory files. Distributed data access is even more of a concern when the users sharing the data are beyond the reach of a local area network and must share the data via wide area networking solutions. A good starting point for the network analyst might be to ask the question: Has anyone done a comparison of the forms that are used in the various regional and branch offices to determine which data needs to be sent across the network?

Extended Communications

The ability of certain local area networking solutions to communicate beyond the local area network remains a key differentiating factor among local area networking alternatives. Users should be able to articulate connectivity requirements beyond the LAN. The accomplishment of these requirements is the job of the network analyst. Some possible examples of extended communications might include communications to another LAN. If this is the case, the network analyst must investigate all of the technical specifications of this target LAN in order to determine compatibility with the local LAN. The target LAN may be local (within the same building) or remote (across town or around the world). LAN to LAN connection is known as internetworking and will be studied in the next section Other examples of extended communications may be the necessity for LAN users to gain access to mainframes, either locally or remotely. Again, users are only asked what they need connections to, and where those connections must occur, it is the network analyst’s job to figure out how to make those connections function.

LAN Management and Administration

Another key differentiating factor among LAN alternatives is the level of sophistication required to manage and administer the network. If the LAN requires a full time, highly trained manager, then that manager’s salary should be considered as part of the purchase cost as well as the operational cost of the proposed LAN. Secondly, the users may have requirements for certain management or administration features which must be present. Examples might be user-identification creation or management, or control of access to files or user directories.

Budget Reality

The most comprehensive, well documented, and researched networking proposal is of little value if its costs are beyond the means of the funding organization or business. Initial research into possible networking solutions is often followed by feasibility option reports that outline possible network designs of varying price ranges. Senior management then dictates which options deserve further study based on financial availability. In some cases, senior management may have an approximate project budget in mind which could be shared with network analysts. This acceptable financial range, sometimes expressed as budgeted cost per user, serves as a frame of reference for analysts as technical options are explored. In this sense, budgetary constraints are just another overall, high-level business need or perspective that helps to shape eventual networking proposals.

Anticipated Growth is Key

User needs are not always immediate in nature. These needs can vary dramatically over time. To design networking solutions that will not become obsolete in the near future, it is essential to gain a sense of what the anticipated growth in user demands might be. Imagine the chagrin of the network analyst who must explain to management that the network which was installed last year cannot be expanded and must be replaced due to unanticipated growth of network demand. One method of gaining the necessary insight into future networking requirements, illustrated in Fig. 19.59, is to ask users the same set of business analysis questions with projected time horizons of 2–3 years and 5 years. Incredible as it may seem, 5 years is about the maximum projected lifetime for a given network architecture or design. Of course, there are exceptions. End users may not have the information or knowledge necessary to make these projections. Management can be very helpful in the area of projected growth and informational needs, especially if the company has engaged in any sort of formalized strategic planning methodology.

image

Network Applications: What Can a LAN Do for You ?

Beyond merely being able to share the same application software packages (spreadsheets, word processing, databases), which ran on individuals PCs before they were networked together over a LAN, networking PCs together provides some unique opportunities to run additional networked applications, which can significantly increase worker productivity and/or decrease costs.

Figure 19.60 summarizes the attributes and issues of some of the most popular uses of a LAN. It should be noted that the uses, features, and issues described next apply only to the listed applications functioning on a local area network. Many of these same functions become much more complicated when running across multiple LANs (internetworking) or over long distance WANs. A short description of each of these LAN applications follows

Network Printing

Network printing continues to evolve as user demands change and technology changes to meet those demands.

On a typical LAN, a networked PC would send a request for printing out onto the network through a network interface card. The networked request for printing services would be accepted by a device in charge of organizing the print requests for a networked printer. Depending on the LAN implementation configuration, that device may be a PC with attached printer, a specialized print server with attached printers, or a directly networked printer. Some type of software must manage all of this requesting, spooling, buffering, queuing and printing. The required software may be part of an overall network operating system or may be specifically written for only network printer management.

Network Backup

Backing up data and application files on a network is essential to overall network security and the ability to recover from the inevitable data-destroying disaster. Although the process and overall components are relatively simple, the implementation can be anything but simple. Basically there are only two components to a network backup system: (1) the software, which manages the backup, and (2) the hardware device, which captures the backed-up files.

Some network backup software and hardware work with only certain network operating systems. Other network backup software will work with only the hardware device with which it is sold. The interaction between hardware devices and software such as operating systems or network operating systems is often controlled by specialized software programs (drivers). It is essential to make sure that the necessary drivers are supplied by either the tape backup device vendor or software vendor in order to ensure the operability of the tape backup device. Hardware devices may be various types of tape subsystems, or optical drives. Key differences among hardware devices include

1. How much? What is the storage capacity of the backup device?

2. How fast? How quickly can data be transferred from a PC or server to the backup device? This

attribute is important if you are backing up large capacity disk drives.

3. How compressed? Can data be stored on the backup device in compressed form? If so, it may save significant room on the backup media.

Remember, backup is not necessarily a one way process. Restoration of backed up files and the ease with which that restoration can be accomplished is a major purchasing consideration. Being able to schedule unattended backups or restorals as well as the ability to spool or print log reports of backup/restoral activity are also important to network managers.

Network Management

The overall task of network management is usually broken down into at least three distinct areas of operation. First, networks must be monitored. Therefore, one of the foremost jobs of network management software is to monitor the LAN to detect any irregular activity such as malfunctioning network adapter cards, or an unusually high data transmission rate monopolizing the available network bandwidth to be shared among all attached workstations. Sophisticated LAN monitoring programs can display maps of the network on graphics terminals. Operators can zoom in on a particular node or workstation for more information or performance statistics. Some monitoring programs also have the ability to compare current network activity to preset acceptable parameters and to set off alarms on network monitor terminals, perhaps by turning a node symbol bright red on the screen, when activity goes beyond acceptable limits. Monitoring software is also written specifically for monitoring file servers on a LAN. Besides monitoring server performance and setting off alarms, some monitoring packages have the ability to dial and set off pagers belonging to network managers who may be away from the network console.

Once a problem has been monitored and identified, it must be analyzed and diagnosed. This is the second major task of network management software. Diagnosis is often done by a class of devices known as protocol analyzers or by the more common name, sniffers. These devices are attached to the LAN and watch, measure, and in some cases, record every bit of data that passes their way. By using multiple sniffers at various points on a LAN, otherwise known as distributed sniffers, bottlenecks can be identified and performance degradation factors can be pinpointed. LAN testing devices must be able to test and isolate the three major segments of any LAN: (1) the wire or cable of the network, (2) the network adapter cards, which interface between the cable and the workstation, and (3) the workstation or PC that generates the network activity.

Having diagnosed the cause of the networking problem, corrective action must be taken against that problem. Perhaps a misbehaving network interface card must be disabled or an application on a workstation that is monopolizing network resources must be logged out. The power to do these things is sometimes called network administration or management. In this case, the term administration is preferable in order to provide a contrast to the previous more general use of the term network management. Most often, the required network management software to manage LANs is included in the network operating system itself.

LAN monitoring software and other specialized network management functions are available as an add-on product for most network operating systems. When these add-on products are manufactured by a company other than the original network operating system vendor, they are known as third-party products. These third-party enhancements are often of high quality but should be purchased with caution. Compatibility with associated software or future releases of the network operating system are not necessarily guaranteed.

Network Security

In addition to the typical security features, such as password protection and directory access control supplied with most network operating systems, more sophisticated network security software/hardware is available for LANs. For instance, security software may be added to workstations and or servers which will

1. Require user identification and valid password to be entered before the PC can be booted.

2. Encrypt important data or application files to prevent tampering.

3. Automatically logout inactive terminals to prevent unauthorized access to system resources.

4. Allow certain users to run only certain applications.

5. Require verification of user authenticity by security verifiers.

Another area of network security that is receiving a lot of attention is that of viruses. Virus control software is sometimes included in network security packages. Virus control is really a three-step process, implying that effective virus control software should address at least the following three areas:

1. Virus protection: User access to systems is sufficiently controlled as to prevent an unauthorized user from infecting the LAN.

2. Virus detection: Sophisticated software to find viruses regardless of how cleverly they may be disguised.

3. Virus eradication: Sometimes called antibiotic programs, this software eliminates all traces of the virus.

Groupware

Groupware is the name of a category of software that seeks to take advantage of the fact that workers are networked together electronically in order to maximize worker productivity. Groupware is a general term that describes all or some of the following software categories: workflow automation, interactive work, group scheduling, document review, information sharing, electronic whiteboard, and enhanced electronic mail.

Local Area Network Architectures

The choice of a particular network architecture will have a definite bearing on the choice of network adapter cards and less of an impact on the choice of media or network operating system. For instance, an ethernet network architecture requires ethernet adapter cards. As will soon be seen, it is the adapter card which holds the key, or media access control (MAC) layer protocol, which determines whether a network is ethernet, token ring, fiber distributed data interface (FDDI) or any other network architecture. Ethernet runs over thick or thin coaxial cable, shielded or unshielded twisted pair, fiber or wireless—clearly a wide choice of media options.

Ethernet

Ethernet, adhering to the IEEE 802.3 standard, is a carrier sense multiple access with collision detection- (CSMA/CD-) based network architecture traditionally installed in a bus configuration, but most often installed in a hub-based star physical topology. Every device, most often network adapter cards, attached to an ethernet network has a unique hardware address assigned to it at time of manufacture. As new devices are added to an ethernet network, their addresses become new possible destinations for all other attached ethernet devices.

The media access layer protocol elements of ethernet form data packets for transmission over the shared media according to a standardized format. This ethernet packet format is nearly equivalent to the IEEE 802.3 standard, and the two terms are often used interchangeably.

The potential for collisions and retransmission exists on an ethernet network thanks to its CSMA/CD access methodology. In some cases, ethernet networks with between 100 and 200 users barely use the capacity of the network. However, the nature of the data transmitted is the key to determining potential network capacity problems. Character-based transmissions, such as typical data entry, in which a few characters at a time are typed and sent over the network are much less likely to cause network capacity problems than the transfer of graphical user interface (GUI) screen oriented transmission such as Windows-based applications. CAD/CAM images are even more bandwidth intensive. Simultaneous requests for full screen Windows-based transfers by 30 or more workstations can cause collision and network capacity problems on an ethernet network. As with any data communication problem, there are always solutions or workarounds to these problems. The point in relaying these examples is to provide some assurance that although ethernet is not unlimited in its network capacity, in most cases, it provides more than enough bandwidth.

Token Ring

IBM’s token ring network architecture, adhering to the IEEE 802.5 standard, utilizes a star physical topology, sequential message delivery, and a token passing access methodology scheme. Since the sequential logical topology is equivalent to passing messages from neighbor to neighbor around a ring, the token ring network architecture is sometimes referred to as: logical ring, physical star. The token ring’s use of the token passing access methodology furnishes one of the key positive attributes of this network architecture. The guarantee of no data collisions with assured data delivery afforded by the token passing access methodology is a key selling point in some environments where immediate, guaranteed delivery is essential.

FDDI

As far as trends in network architecture go, as more and more users are attached to LANS, the demand for overall network bandwidth increases. LANs are increasing both in size and overall complexity. Internet- working of LANs of various protocols via bridges and routers means more overall LAN traffic. Network applications are driving the demand for increased bandwidth as well. The concepts of distributed comput- ing, data distribution, and client/server computing all rely on a network architecture foundation of high bandwidth and high reliability. Imaging, multimedia, and data/voice integration all require high amounts of bandwidth in order to transport and display these various data formats in real time. In other words, if full-motion video is to be transported across the LAN as part of a multimedia program, there should be sufficient bandwidth available on that LAN for the video to run at full speed and not in slow motion. Likewise, digitized voice transmission should sound normal when transported across a LAN of sufficient bandwidth.

FDDI supplies not only a great deal of bandwidth, but also a high degree of reliability and security while adhering to standards-based protocols. FDDI’s reliability comes not only from the fiber itself which, as we know, is immune to both electromagnetic interference (EMI) and radio frequency interference (RFI). An additional degree of reliability is achieved through the design of the physical topology of FDDI.

FDDI’s physical topology comprises not one, but two, separate rings around which data moves simultaneously in opposite directions. One ring is the primary data ring while the other is a secondary or backup data ring to be used only in the case of the failure of the primary ring. Whereas both rings are attached to a single hub or concentrator, a single point of failure remains in the hub while achieving redundancy in the network media. In addition to speed and reliability, distance is another key feature of an FDDI LAN. Another positive attribute of FDDI is its ability to interoperate easily with ethernet networks. In this way, a business does not have to scrap its entire existing network in order to upgrade a piece of it to FDDI.

An FDDI to ethernet bridge is the specific technology employed in such a setup.

The uses of the FDDI network architecture typically fall into three categories:

1. Campus backbone: Not necessarily implying a college campus, this implementation is used for connecting LANs located throughout a series of closely situated buildings.

2. High bandwidth workgroups: The second application category is when the FDDI LAN is used as a truly local area network, connecting a few PCs or workstations which require high bandwidth com- munication with each other. Multimedia workstations, engineering workstations, or CAD/CAM workstations are all good examples of high bandwidth workstations.

3. High bandwidth subworkgroup connections: In some cases, only two or three devices, perhaps three servers, have high bandwidth requirements. As distributing computing and data distribution increase, an increasing demand for high-speed server to server data transfer has been seen.

Wireless LANs

Many of the previously mentioned network architectures function over more than one type of media. Another media option is wireless transmission (which is really the absence of any media) for local area networks. There are currently three popular wireless transmission technologies in the local area network technology area. They are microwave transmission, spread spectrum transmission, and infrared transmission.

These are all just radio transmissions at varying frequencies.

Wireless LAN Applications

A primary application of wireless LANs optimizes the ease of access of the wireless technology. Portable or notebook PCs equipped with their own wireless LAN adapters can create an instant LAN connection merely by getting within range of a server-based wireless LAN adapter or wireless hub. In this way, a student or employee can sit down anywhere and log into a LAN as long as the user is within range of the wireless hub and has the proper wireless adapter installed in the portable PC.

Meeting rooms can be equipped with wireless hubs to allow spontaneous workgroups to log into network resources without running cables all over the meeting room. Similarly, by quickly installing wireless hubs and portable PCs with wireless adapters, temporary expansion needs or emergency/disaster recovery situations can be handled quickly and with relative ease. No rerunning of wires or finding the proper cross-connects in the wiring closet are necessary.

Finally, wireless LAN technology allows entire LANs to be preconfigured at a central site and shipped ready to run to remote sites. The nontechnical users at the remote site literally just have to plug the power cords into the electrical outlets and they have an instant LAN. For companies with a great number of remote sites and limited technical staff, such a technology is ideal. No preinstallation site visits are necessary. Also avoided are costs and supervision of building wiring jobs and troubleshooting building wiring problems during and after installation.

Local Area Network Hardware

Servers

A server’s job is to manage the sharing of networked resources among client PCs. Depending on the number of client PCs and the extent of the shared resources, it may be necessary to have multiple servers and/or to specialize some servers as to the type of resources that they manage. If servers are to be specialized, then shared resources should be grouped in some logical fashion so as to optimize the server performance for managing the sharing of a particular type of resource. A list of potentially shared network resources would probably include: files, application programs, databases, printers, access to other LANs (local), access to other LANs (remote), access to information services, and access to the LAN from remote PCs.

Hubs/Multistation Access Units (MAUs)

The heart of the star physical topology, employed by both ethernet and token ring, is the wiring center, alternatively known as a hub, a concentrator, a repeater or a multistation access unit (MAU).

Repeaters

A repeater, as its name would imply, merely repeats each bit of digital data that it receives. This repeating action actually cleans up the digital signals by retiming and regenerating them before passing this repeated data from one attached device or LAN segment to the next.

Hubs

The terms hub and concentrator or intelligent concentrator are often used interchangeably. Distinctions can be made, however, between these two broad classes of wiring centers, although there is nothing to stop manufacturers from using the terms as they wish. A hub is often the term reserved for describing a stand-alone device with a fixed number of ports, which offers features beyond that of a simple repeater. The type of media connections and network architecture offered by the hub is determined at the time of manufacture as well. For example, a 10BaseT ethernet hub will offer a fixed number of RJ-45 twisted pair connections for an ethernet network. Additional types of media or network architectures are not usually supported.

MAUs

A MAU is IBM’s name for a token ring hub. A MAU would be manufactured with a fixed number of ports and connections for unshielded or shielded twisted pair. IBM uses special connectors for token ring over shielded twisted pair (STP) connections to a MAU. MAUs offer varying degrees of management capability.

Concentrators

The term concentrator or intelligent concentrator (or smart hub) is often reserved for a device characterized by its flexibility and expandability. A concentrator starts with a fairly empty, boxlike device often called a chassis. This chassis contains one or more power supplies and a builtin network backbone. This backbone might be ethernet, token ring, FDDI, or some combination of these. Into this backplane, individual cards or modules are inserted.

For instance, an 8- or 16-port twisted pair ethernet module could be purchased and slid into place in the concentrator chassis. A network management module supporting the SNMP (simple network management protocol) network management protocol could then be purchased and slid into the chassis next to the previously installed 10BaseT Port module. In this mix and match scenario, additional cards could be added for connection of PCs with token ring adapters, PCs, or workstations with FDDI adapters, or dumb asynchronous terminals.

This network in a box is now ready for workstations to be hooked up to it through twisted pair connections to the media interfaces on the network interface cards of the PCs or workstations. Remember that ethernet can run over UTP (unshielded twisted pair), STP, thick and thin coaxial as well as fiber.

Additional modules available for some, but not all, concentrators may allow data traffic from this network in box to travel to other local LANs via bridge or router add-on modules. (Bridges and routers will be discussed in the next section on internetworking.) These combination concentrators are sometimes called internetworking hubs. Communication to remote LANs or workstations may be available through the addition of other specialized cards, or modules, designed to provide access to wide area network services purchased from common carriers.

Switching Hubs

The network in a box or backbone in a box offered by concentrators and hubs shrinks the length of the network backbone but does not change the architectural characteristics of a particular network backbone. For instance, in an ethernet concentrator, multiple workstations may access the built in ethernet backbone via a variety of media, but the basic rules of ethernet, such as CSMA/CD access methodology still control performance on this ethernet in a box. Only one workstation at a time can broadcast its message onto the shared backbone.

A switching hub seeks to overcome this one at a time broadcast scheme, which can potentially lead to data collisions, retransmissions, and reduced throughput between high-bandwidth demanding devices such as engineering workstations or server-to-server communications.

The ethernet switch is actually able to create connections, or switch, between any two attached ethernet devices on a packet by packet basis. The one-at-time broadcast limitation previously associated with ethernet is overcome with an ethernet switch.

Wiring Centers Technology Analysis

Some of the major technical features to be used for comparative analysis are listed in Fig. 19.61. Before purchasing a hub of any type, consider the implications of these various possible features. To summarize, the following major criteria should be thoroughly considered before a hub or concentrator purchase:

image

(1) expandability (2) supported network architectures (3) supported media types (4) extended communications capabilities, that is, terminal support, internetworking options, and wide area networking options, (5) hub/concentrator management capabilities and (6) reliability features.

Network Interface Cards

Network adapter cards, also known as network interface cards are the physical link between a client or server PC and the shared media of the network. Providing this interface between the network and the PC or workstation requires that the network adapter card have the ability to adhere to the access methodology (CSMA/CD or token passing) of the network architecture to which it is attached. These software rules, implemented by the network adapter card which control the access to the shared network media, are known as media access control (MAC) protocols and are represented on the MAC sublayer of the data link layer (layer 2) of the OSI 7-layer reference model.

Since these are MAC layer interface cards and are, therefore, the keepers of the MAC layer interface protocol, it is fair to say that it is the adapter cards themselves that determine network architecture and its constituent protocols more than any other component. Take an ethernet adapter card out of the expansion slot of a PC and replace it with a token ring adapter card and you have a token ring workstation. In this same scenario, the media may not even need to be changed since ethernet, token ring, and FDDI/CDDI often work over the same media.

Role of Adapter Card Drivers

Assuring that the purchased adapter card interfaces successfully to the bus of the CPU as well as the chosen media of the network architecture will as sure hardware connectivity. Full interoperability, however, depends on the chosen network adapter card being able to communicate successfully with the network operating system and operating system of the PC into which it is installed.


Network Communication: General Principles of Network Analysis and Design and Personal Remote Connectivity.

19.7 Network Communication
19.7.1 General Principles of Network Analysis and Design

Use of Top-Down Business Oriented Approach

Network communication is the transport of data, voice, video, image, or facsimile (fax) from one location to another achieved by compatibly combining elements of hardware, software, and media. From a business perspective, network communications is delivering the right information to the right decision maker at the right place and time for the right cost. Because there are so many variables involved in the analysis, design, and implementation of such networks, a structured methodology must be followed in order to assure that the implemented network meets the communications needs of the intended business, organization, or individual.

image

One such structured methodology is known as the top-down approach. Such an approach can be graphically illustrated in a top-down model as shown in Fig. 19.54. Using a top-down approach as illustrated in the top-down model is relatively straight- forward.

One must start with the business level objectives. What is the company (organization, individual) trying to accomplish by installing this network? With- out a clear understanding of business level objectives, it is nearly impossible to configure and implement a successful network.

Once business level objectives are understood, one must understand the applications which will be running on the computer systems attached to these networks. After all, it is the applications that will be generating the traffic that will travel over the implemented network.

image

Once applications are understood and have been documented, the data which those applications generate must be examined. In this case, the term data is used in a general sense as today’s networks are likely to transport a variety of payloads including voice, video, image, and fax in addition to true data. Data traffic analysis must determine not only the amount of data to be transported, but also must determine important characteristics about the nature of that data. A summarization of data traffic analysis is outlined in Fig. 19.55. It is also during this stage of the top-down analysis in which the geographic proximity of the nodes of the network are examined.

Geographic proximity is one differentiating factor among different categories of networking, which will be examined further subsequently.

Once data traffic analysis has been completed, the following should be known:

1. Physical locations of data (Where?)

2. Data characteristics and compatibility issues (What?)

3. Amount of data generated and transported (How much?)

Given these requirements as determined by the upper layers of the top-down model, the next job is to determine the requirements of the network that will possess the capability to deliver this data in a timely, cost-effective manner. Details on the determination of these requirements comprise the remainder of this section on network communications. These network performance criteria could be referred to as what the implemented network must do in order to meet the business objectives outlined at the outset of this top-down analysis. These requirements are also sometimes referred to as the logical network design.

The technology layer analysis, in contrast, will determine how various hardware and software components will be combined to build a functional network which will meet predetermined business objectives. The delineation of required technology is often referred to as the physical network design.

Overall, the relationship between the layers of the top-down model could be described as follows: analysis at upper layers produces requirements that are passed down to lower layers while solutions meeting these requirements are passed back to upper layers. If this relationship among layers holds true throughout the business oriented network analysis, then the implemented technology (bottom layer) should meet the initially outlined business objectives (top layer).

image

Use of Open Systems Interconnection (OSI) Model

Determining which technology to employ to meet the requirements determined in the logical network de- sign (network layer) requires a structured methodology of its own. Fortunately, a framework for organizing networking technology solutions has been developed by the International Standards Organization (ISO) and is known as the open systems interconnection (OSI) model. The OSI model is illustrated in Fig. 19.56. The OSI model divides the communication between any two networked computing devices into seven layers or categories. The OSI model allows data communications technology developers as well as standards developers to talk about the interconnection of two networks or computers in common terms without dealing in proprietary vendor jargon.

These common terms are the result of the layered architecture of the seven-layer OSI model. The architecture breaks the task of two computers communicating to each other into separate but interrelated tasks, each represented by its own layer. As can be seen in Fig. 19.56, the top layer (layer 7) represents the application program running on each computer and is therefore aptly named the application layer. The bottom layer (layer 1) is concerned with the actual physical connection of the two computers or networks and is therefore named the physical layer. The remaining layers (2–6) may not be as obvious but, nonetheless, represent a sufficiently distinct logical group of functions required to connect two computers, as to justify a separate layer.

To use the OSI model, a network analyst lists the known protocols for each computing device or network node in the proper layer of its own seven-layer OSI model. The collection of these known protocols in their proper layers in known as the protocol stack of the network node. For example, the physical media employed, such as unshielded twisted pair, coaxial cable, or fiber optic cable, would be entered as a layer 1 protocol, whereas ethernet or token ring network architectures might be entered as a layer 2 protocol.

Other examples of possible protocols in respective layers will be explored in the remainder of this section. The OSI model allows network analysts to produce an accurate inventory of the protocols present on any given network node. This protocol profile represents a unique personality of each network node and gives the network analyst some insight into what protocol conversion, if any, may be necessary in order to get any two network nodes to communicate successfully. Ultimately, the OSI model provides a structured methodology for determining what hardware and software technology will be required in the physical network design in order to meet the requirements of the logical network design.

Perhaps the best analogy for the OSI reference model, which illustrates its architectural or framework purpose, is that of a blueprint for a large office building or skyscraper. The various subcontractors on the job may only be concerned with the layer of the plans that outlines their specific job specifications. However, each specific subcontractor needs to be able to depend on the work of the lower layers subcontractors just as the subcontractors of the upper layers depend on these subcontractors performing their function to specification. Similarly, each layer of the OSI model operates independently of all other layers, while depending on neighboring layers to perform according to specification while cooperating in the attainment of the overall task of communication between two computers or networks.

Differentiation Among Major Categories of Networking

As part of the top-down analysis, geographic proximity of computers or network nodes was mentioned as a key piece of analysis information. Although there are no hard and fast rules for network categorization, following are a few of the more common categories of networking:

✁ Remote connectivity: A single remote user wishes to access local network resources. This type of networking is particularly important to mobile professionals such as sales representatives, service technicians, field auditors, etc.

✁ Local area networking: Multiple users’ computers are interconnecting for the purpose of sharing applications, data, or etworked technology such as printers or CD-ROMs. Local area networks (LANs) may have anywhere from two or three users to several hundred. LANs are often limited to a single department or floor in a building, although technically any single location corporation could be networked via a LAN.

✁ Internetworking: Also known as LAN-to-LAN networking or connectivity, internetworking involves the connection of multiple LANs and is very common in corporations in which users on departmental LANs now need to share data or otherwise communicate. The challenge of internet working is in getting departmental LANs of different protocol stacks (as determined by use of the OSI model) to talk to each other, while only allowing authorized users access to the internetwork and other LANs. Variations of internetworking also deal with connecting LANs to mainframes or minicomputers rather than to other LANs.

✁ Wide area networking: Also known as enterprise networking, involves the connection of computers, network nodes, or LANs over a sufficient distance as to require the purchase of wide area network (WAN) service from the phone company or alternative carrier. In some cases, the wide area portion of the network may be owned and operated by the corporation itself. Nonetheless, the geographic distance between nodes is the determining factor in categorizing a wide area network. A subset of WANs known as metropolitan area networks (MANs) are confined to a campus or metropolitan area of usually not more than a few miles in diameter.

The important thing to remember is that categorization of networking is somewhat arbitrary and that what really matters is that the proper networking technology (hardware and software) is specified in any given networking opportunity in order to meet stated business objectives.

19.7.2 Personal Remote Connectivity

Applications

The overall methodology for analysis and design of remote connectivity networking can be summarized as follows:

1. Needs analysis

2. Logical topology choice

3. Physical topology or architecture choice

4. Technology review and specification

Remote Connectivity Needs Analysis

Remote connectivity needs analysis involves documenting the nature and extent of the use of local LAN resources by the remotely connected user. Choices of logical or physical topology for this remote LAN connectivity may be limited depending on the outcome of the remote connectivity needs analysis. Among the possible information sharing needs of remote users are the following: (1) exchange e-mail, (2) upload and download files, (3) run interactive application programs remotely, and (4) utilize LAN attached resources such as printers. One additional question will have a direct impact on topology choice: (5) How many remote users will require simultaneous access to local LAN attached resources?

Remote connectivity architectures comprise the combination of a chosen remote connectivity logical topology and a chosen remote connectivity physical topology.

Logical Topologies

Remote connectivity logical topologies are differentiated by: (1) location of application program execution (local or remote PC) and (2) nature of the data traffic between the local and remote PC. The two most common remote connectivity logical topologies or operations modes are: (1) remote client mode and (2) remote control mode.

Remote Client Mode

Remote client mode, alternatively known as remote access node, executes and often stores applications on the remote PC, using only shared data and other locally attached LAN resources connected to the local LAN server. A single local LAN server or specialized communications server can service multiple remote PC clients. The remote node has the same full capabilities as any local node on the network. The fact that the client PC is remote to the local server is transparent. The data traffic between the remote PC and local LAN server are data packets particular to the network operating system, which both the remote PC and local LAN server have installed.

Remote Control Mode

Remote control mode requires a dedicated local PC to be assigned to each remote PC since applications are stored and executed on the local PC. Shared data and other LAN-attached resources are accessed from the LAN server through the local PC. The remote PC is really nothing more than a simple input/output device. All processing is performed on the local PC. Only keystrokes and screen images are transmitted between the remote PC and the local PC. This setup is really just a remote keyboard and monitor for a local PC. The remote PC controls the local PC and all of its LAN attached resources, hence the name, remote control mode.

Figure 19.57 outlines some of the details, features and requirements of these two remote PC modes of operation or logical topologies.

Physical Topologies

Remote connectivity physical topologies refer to the physical arrangement of hardware and media which offers access to the local LAN for the remote user. As Fig. 19.58 illustrates, there are three basic ways in which a remote PC user can gain access to the local LAN resources. (1) a LAN attached PC, (2) communications server, and (3) LAN modem.

It is important to understand that the actual implementation of each of these LAN access arrangements may require additional hardware and/or software. They may also be limited in their ability to utilize all LAN attached resources.