Servo Systems : Introduction , Principles of Operation , Compensator Design , Power Stage , Motor Choice , Gearing and A Simple Example Application

Servo Systems
Introduction

During the past 60 years, many methods have been developed for accurately controlling dynamic systems. The vast majority of these systems employ sensors to measure what the system is actually doing. Then, based on these measurements, the input to the system is modified. These concepts were initially used in applications where only a single output was measured, and that measurement was used to modify a single input. For instance, position sensors measured the actual position of a motor, and the current or voltage put into the motor windings was modified based on these position readings. An early definition of these systems is the following:

A servosystem is defined as a combination of elements for the control of a source of power in which the output of the system, or some function of the output, is fed back for comparison with the input and the difference between these quantities is used in controlling the power (James, Nichols, and Phillips, 1947).

This definition is extremely broad and encompasses most of the concepts that are usually referred to today as the technical area of control systems. However, the technology and theory of control systems has changed significantly since that 1947 definition. There are now methods for controlling systems with multiple inputs and multiple outputs, many different design and optimization techniques, and intelligent control methodologies sometimes using neural networks and fuzzy logic. As these new theories have evolved, the definition of a servo system has gradually changed. Today, the term servo system often refers to motion control systems, usually employing electric motors. This change may have occurred simply because one of the most important applications of the early servo system theories was in rapid and accurate positioning. For the sake of brevity, this discussion will confine its treatment to motion control systems utilizing electric motors.

Principles of Operation

To obtain rapid and accurate motion control, servo systems employ the same basic principle just outlined, the principle of feedback. By measuring the output (usually the position or velocity of the motor) and feeding it back to the input, the performance can be improved. This output measurement is often subtracted

image

from a desired output signal to form an error signal. This error signal is then used to drive the motor. Figure 18.64 illustrates the components present in a typical system.

As the figure illustrates, each servo system consists of several separate components. First, a compensator takes the desired response (usually in terms of a position or velocity of the motor) and compares it to that measured by the sensing system. Based on this measurement, a new input for the motor is calculated. The compensator may be implemented with either analog or digital computing hardware. Since the compensator consists of computing electronics, it rarely has sufficient power to drive the motor directly. Consequently, the compensator’s output is used to command a power stage. The power stage amplifies that signal and drives the motor. There are a number of motors that can be used in servo systems. This chapter will briefly discuss DC motors, brushless DC motors, and hybrid stepping motors. To achieve a mechanical advantage, the motor shaft is usually connected to some gears that move the actual load. The performance of the motor is measured by either a single sensor or multiple sensors. Two common sensors, a tachometer (for velocity) and an encoder (for position), are shown. Finally, those measurements are fed back to the compensator.

Servo systems are called closed-loop devices be- cause the feedback elements form a loop, as can be seen in Fig. 18.64. In contrast, open-loop motion control devices, which do not require sensors, have become popular for some applications. Figure 18.65 depicts an open-loop motion control system. Obviously, it is much easier and less expensive to implement an open-loop control system because far fewer components are involved. The compensator and sensors have been eliminated completely.

image

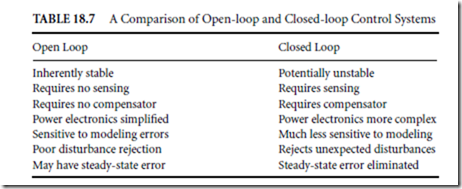
In addition, the power stage is often simplified because the signals it receives may not be as complex. For instance, switching transistors may replace linear amplifiers. On the other hand, it is difficult to construct an open-loop system with capabilities equal to a servo system’s capabilities. Table 18.7 compares open-loop and closed-loop systems.

image

image

The following sections will briefly describe the components that together are used to create a servo system. The emphasis will be on motor control applications.

Compensator Design

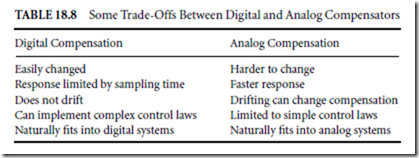
The compensator in Fig. 18.64 is in some ways the brains of a servo system. It takes a desired position or velocity trajectory that the motor system needs to move through, and, by comparing it to the actual movement measured by the sensors, calculates the appropriate input. This calculation can be performed using either digital or analog computing technology. Unlike other areas of computing, in which digital computers long ago replaced analog devices, analog means still are useful today for servo systems. This is mainly because the calculations required are usually simple (a few additions, multiplications, and perhaps integrations) and they must be performed with the utmost speed. On the other hand, digital compensators are increasingly popular because they are easy to change and are capable of more sophisticated control strategies. Table 18.8 compares digital and analog control.

As Table 18.8 indicates, the choice of digital vs. analog compensation depends in part on the control law chosen, since more complex algorithms can be easily implemented on digital computers. If a digital compensator is chosen, then digital control design techniques should be used. These techniques are able to account for the sampling effects inherent in digital compensators. As a rule of thumb, analog design techniques may be used even for digital compensators as long as the sampling frequency used by that digital compensator is at least five times higher than the bandwidth of the servo system.

Once the hardware used to implement the compensator has been selected, a control algorithm, which combines the desired position and/or velocity trajectories with the measurements, must be found. Many design techniques have been developed for determining a control law. In general, these techniques require that the dynamics of the system be identified. This dynamic model may come from a physical understanding of the device. For instance, suppose our servo system is used to move a heavy camera. Since the camera is fairly rigid, it might be modeled accurately as a lumped mass. Similarly, the motor’s rotor as well as the gearing will yield a mostly inertial load. The motor itself may be modeled as a device that inputs current and outputs torque. By putting these three observations together and writing elementary dynamics equations (e.g., Newton’s laws) a set of differential equations that model the actual system can be found. Alternatively, a similar set of differential equations may be found by gathering input and output data (e.g., the motor’s current input and the position and velocity output) and employing identification algorithms directly.

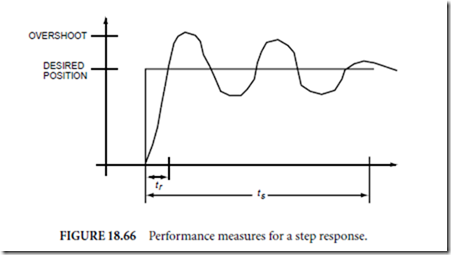
Once an adequate dynamic model has been found, it is possible to design a control law that will improve the servo system’s behavior in some manner. There are many ways of measuring the performance. Some of the most commonly used and oldest performance measures describe the system’s ability to respond to an instantaneous change, or a step. For instance, suppose you are covering a sports event and want to suddenly move the camera to catch the latest action. The camera should reach the desired angle as quickly as possible. The time it does take is termed rise time, tr . In addition, it should stop as quickly as possible so that jitter in the picture will be minimized. The time required to stop is termed settling time, ts . Finally, any excess oscillations will also increase jitter. The magnitude of the worst oscillation is called the overshoot. The overshoot divided by the total desired movement and multiplied by 100 gives the percent overshoot. These characteristics are depicted in Fig. 18.66.

A vast number of techniques have been developed for achieving these desirable characteristics. As an example, one particular method known as proportional integral derivative (PID) control will be considered.

image

This method is selected because it is intuitive and fairly easy to tune. First, an error signal is formed by subtracting the actual position from the desired position. The error is then

image

Next, this error signal is operated on mathematically to determine the input to the motor. The simplest form of this controller uses the following logic:

If the motor starts falling behind so θd >θ and e > 0, then increase the input to catch up. If the motor is getting ahead, decrease the input to slow down.

The logic can be mathematically written in the formula

u = K P e                                       (18.15)

where K P is a constant number called the proportional gain because the input is made proportional to the error.

To make the motor respond faster, it is helpful to know how quickly the motor is falling behind (or getting ahead). This information is contained in the derivative of the error

image

Finally, it is often necessary that the servo system exhibit zero steady-state error. This quality can be achieved by adding a term due to the integral of the error. The reason this works can be understood by considering what would happen should a steady-state error occur. The integrator would keep increasing the input ad infimum. Instead, an equilibrium point is reached with zero error. The complete PID control law is then

image

with K I a constant called the integral gain.

The choice of the controller gains (K P , K I , and K D ) greatly influences the behavior of the servo system.

If a good dynamic model has been found and it consists of linear time invariant differential (or difference) equations, then several methods may be employed for finding gains that best meet the performance requirements (the textbooks listed in the Further Information section provide an excellent and detailed treatment).

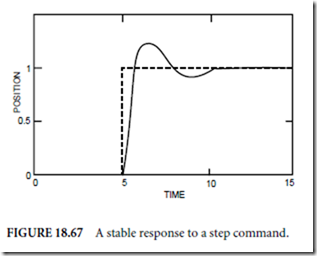
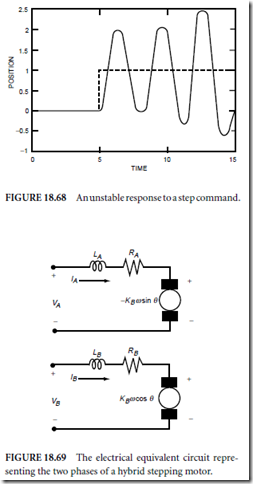
If not, the gains may be experimentally tuned using, for instance, the Ziegler–Nichols method (Franklin, Powell, and Workman, 1990). Care must be exercised when adjusting the gains because the system may become unstable. Figure 18.67 shows the response to a step change at t = 5 in the desired 0.5  position for a properly tuned servo system. The position response quickly tracks the change. Figure 18.68 plots an unstable response resulting from incorrectly tuned gains. The position error increases rapidly. Obviously, this undesirable behavior can be very destructive.

image

Power Stage

A variety of devices are used to implement the power stage, depending on the actuator used to move the servo system. These range from small DC motors to larger AC motors and even more powerful hydraulic systems. This section will briefly discuss the power stage options for the smaller, electric driven servo systems.

There are two distinct methods for electronically implementing the power stage: linear amplifiers and switching amplifiers. Either of these methods typically takes a low-power signal (usually a voltage) as input, and outputs either a desired voltage or current level. This output is regulated so that the voltage or current level remains virtually unchanged despite large changes in the loading caused by the motor.

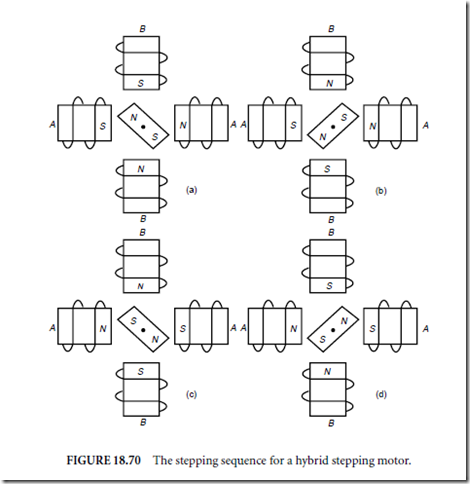
The motor loading does change dramatically as the motor moves because the back electromotive force (EMF) is proportional to the motor velocity ω. For hybrid stepping motors, it is also modulated by either the sine or cosine of the motor position, θ . Figure 18.69 shows the equivalent electric circuit for the two phases of a hybrid stepping motor.

image

Despite their similarities, linear and switching amplifiers differ markedly in how they achieve volt- age or current regulation. Linear amplifiers use a feedback strategy very similar to that described in the previous section. The result is a smooth, continuous output voltage or current. Switching amplifiers, on the other hand, can only turn the voltage to the motor fully on or off (or positive/negative). Consequently, every few microseconds the circuit checks a low-pass filtered version of the motor’s voltage or current level. If it is too high, the voltage is turned off. If it is too low, the voltage is turned on. This method works because the sampling is done on a microsecond scale, whereas the motor’s current or voltage can only change in a millisecond scale. All motors contain resistance and inductance due to the winding, and this resistor-inductor circuit acts as a low-pass filter. Thus, the motor filters out the high-frequency switching, and responds only to the low-frequency components contained within the switching. Care must be taken when using this technique to perform the switching at a frequency well beyond the bandwidth of the mechanical components so that the motor does not respond to the high-frequency switching.

If the desired output is a voltage, the amplifier is called a pulse-width-modulated (PWM) voltage amplifier. If the desired output is a current, the amplifier is usually termed a current chopper.

Both linear and switching amplifiers remain in use because each has particular advantages. Linear amplifiers do not introduce high-frequency harmonics to the system; thus, they can provide more accurate control with less vibrations. This is especially true if the servo system contains components that are somewhat flexible. On the other hand, if the system is rigid, the switching amplifier will provide satisfactory results at a lower cost.

Motor Choice

The choice of motor for a servo system can impact cost, complexity, and even the precision. Three motors will be described in this section. Although this is not by any means an exhaustive coverage, it will suffice for a variety of applications.

DC servomotors are the oldest and probably the most commonly used actuator for servo systems. The name arises because a constant (or DC) voltage applied to the motor input will produce motor movement. Over a linear range, these motors exhibit a torque that is proportional to the quantity of current flowing into the device. This can make the design of control laws particularly convenient since torque can often be easily included into the dynamic equations. The back EMF generated by the motor is strictly proportional to the motor velocity, and so a large input voltage is required to overcome this effect at large velocities. The chief disadvantage of the DC motor is caused by the brushes. Inside the motor, mechanical switching is performed with brushes. As you might imagine, these brushes are the first part of the motor to fail, since they are constantly rubbing and switching current. Consequently, they severely limit the reliability of DC motors as compared to other, more modern actuators. The brushes also limit the low-speed performance because the switching effects are not filtered out when the motor is turning slowly. Instead, the motor actually has time to react to each individual switching. For this reason, DC motors are normally run only at high speeds, and gearing is used to convert the speed to that needed for a particular application. Only very specialized designs of DC motors are suitable for highly precise direct drive applications in which no gearing is allowed.

One way to eliminate some of these problems is to use a brushless DC motor rather than an ordinary DC motor. The brushless DC operates in a manner identical to the DC motor. However, the motor construction is quite different. A typical brushless DC motor actually has three phases. Much like the DC motor, these phases are switched either on or off depending on the motor position. Whereas the DC motor accomplishes this switching mechanically with the brushes, the brushless DC contains Hall effect sensors. These sensors determine the position of the motor, then based on these measurements electronically perform the switching. The advantage is that brushes are no longer necessary. As a result, the brushless DC motor will last much longer than an ordinary DC motor. Unfortunately, since Hall effect sensors and more sophisticated switching electronics are required, brushless DC motors are more expensive than DC motors. In addition, since the basic principle still involves switching phases fully on or off, brushless DC motors also exhibit poor performance at low speeds.

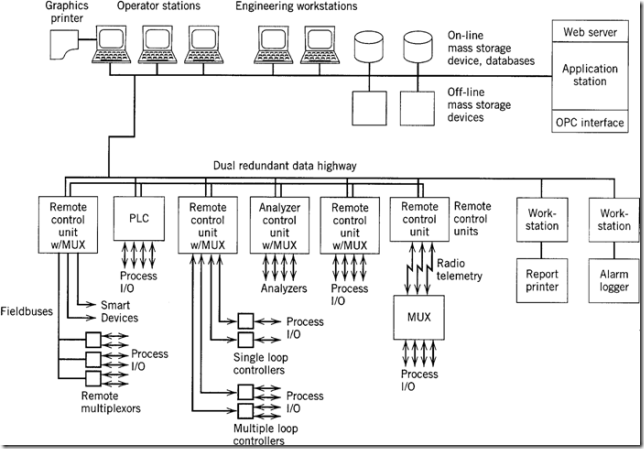
Both types of DC motors have become popular because they respond linearly (over a nominal operating range) to an input current command in that the output torque is roughly proportional to the input current. This is convenient because it allows the direct use of linear control design techniques. It was also especially important during early servo system development because it is easy to implement with analog computing devices. Advances in microcontroller computing technology and nonlinear control design techniques now provide many more options. One of these is the use of hybrid stepping motors in servo systems. These motors were originally developed for open-loop operation. They have shown considerable promise for closed-loop operation as well. Hybrid stepping motors typically have two phases. These windings are labeled A and B in Fig. 18.70(a). These two windings are energized in the sequence shown in

image

Fig. 18.70(a) to Fig. 70(d), thus causing the permanent magnet rotor to turn. Although Fig. 18.70 shows only four separate energizations (called steps) of the windings to complete a revolution, clever mechanical arrangements allow the number of steps per revolution to be greatly increased. Typical hybrid stepping motors have 200 steps/revolution. Consequently, a complete revolution is performed by repeating the four step sequence shown in Fig. 18.70, 50 times.

One advantage of these motors is that they allow fairly accurate positioning in open loop. As long as the motor has sufficient torque capabilities to resist any external torques, the motor position remains within the commanded step. Since open-loop systems are far less complicated (and therefore less expensive), these motors offer an economical alternative to the traditional closed-loop servo system. On the other hand, there are some accompanying disadvantages to open-loop operation. First, since the winding currents are switched on and off to energize the coils in the proper sequence, the motor exhibits a jerky motion at low speeds, much like the DC motors. Second, if an unexpectedly large disturbance torque occurs, the motor can be knocked into the wrong position. Since the operation is open loop and therefore does not employ any position sensor, the system will not correct the position, but will keep running. Finally, the speed of response and damping can be improved using closed-loop techniques.

In addition to the open-loop uses of hybrid stepping motors, methods exist for operating these motors in a closed-in a closed-loop fashion (Lofthus et al., 1994). The principle difficulty arises because hybrid stepping motors are nonlinear devices, so the plethora of design techniques available in linear control theory cannot be directly applied. Fortunately, these motors can be made to behave in a linear fashion by modulating the input currents by sinusoidal functions of the motor position. For instance, the currents through the two windings (IA and IB ) can be made equal to

image

where N is the number of motor pole pairs (50 for the typical 200-step/revolution motor) and θ is the motor’s angular position. Then the torque output by the motor is proportional to the new input, IC . IC can be determined using standard linear control designs such as the PID method outlined earlier.

In contrast to the DC motors, which employ current switching and therefore perform poorly at low speeds, this closed-loop method of controlling stepping motors performs quite accurately even at very low velocities. On the other hand, the generation of the sinusoidally modulated input currents requires both accurate position measurement and separate current choppers for each phase. Thus the implementation cost is somewhat higher than a servo system utilizing DC motors.

Gearing

As alluded to in the previous section, gearing is often used in servo systems so that the motor can operate in its optimum speed range while simultaneously obtaining the required speeds for the application. In addition, it allows the use of a much smaller motor due to the mechanical advantage. Along with these advantages come some disadvantages, the principle disadvantage being backlash. Backlash is caused by the small gaps that exist in gearing systems. In gearing systems, there always exist small gaps between a pair of mating gears. As a result of the gaps, the driven gear can wiggle independently from the driving gear. This wiggling is actually a nonlinear phenomena that can cause vibrations and decreases the accuracy that can be obtained. A similar effect occurs when using belt driven gearing because the belt stretches.

These inherent imperfections in gearing can become major problems if extreme accuracy is required in the servo system. Since these effects increase as the gear ratio increases, one way to reduce the effect of the gearing imperfections is to make the gear ratio as small as possible. Unfortunately, DC motors run smoother at higher speeds, so smaller gear ratios tend to accentuate the motor imperfections caused by switching. Consequently, a tradeoff between the inaccuracies caused by the gearing and the inaccuracies caused by the motor must be made. For highly precise systems, the gearing is sometimes completely eliminated. For such applications, a closed-loop hybrid stepping motor or a specialized DC motor are usually necessary to obtain good motion quality.

A Simple Example Application

To clarify some of the engineering choices that must be made when designing a servo system, a simple example of a servo system design for moving a camera will be discussed.

First, suppose the camera will be used in a surveillance application, to constantly pan back and forth across a store. For this application, an actual servo system employing feedback is probably not necessary and would prove too costly. The required precision is fairly low, and low cost is of the utmost importance. Consequently, an open-loop stepping motor powered by transistors switching on or off will probably be adequate. Alternatively, even a DC motor operated in open loop, with microswitches to determine when to reverse direction will suffice.

Now suppose the camera is used to visually inspect components as part of a robotic workcell. In this case, the requirements on precision are significantly higher. Consequently, a servo system using a geared DC motor and powered by a PWM voltage amplifier may be an appropriate choice. If the robotic workcell is used extensively, a more reliable system may be in order. Then a brushless DC motor may be substituted for a higher initial cost.

Finally, suppose the camera system is used to provide feedback to a surgeon performing intricate eye surgeries. In this case, an extremely precise and reliable system is required, and cost is a secondary consideration. To achieve the high accuracy, a direct drive system that does not use any gearing may provide exceptional results. Since the motor must move precisely at low speeds, simultaneously remaining very reliable, a closed-loop hybrid stepping motor may be used. To drive the hybrid stepping motor, either linear current amplifiers or current choppers (one for each of the two phases) will suffice. For this particular application, the hybrid stepping motor offers another advantage because it can be operated fairly accurately in open loop. Thus it offers redundancy if the compensator or sensors fail.

Defining Terms

Backlash: The errors introduced into geared systems due to unavoidable gaps between two mating gears.

Bandwidth: The frequency range over which the Bode plot of a system remains within 3 dB of its nominal value.

Closed-loop system: A system that measures its performance and uses that information to alter the input to the system.

Current chopper: A current amplifier that employs pulse-width-modulation.

Open-loop system: A system that does not use any measurements to alter the input to the system.

Overshoot: The peak magnitude of oscillations when responding to a step command.

Pulse-width-modulation: A means of digital-to-analog conversion that uses the average of high-frequency switchings. This can be performed at high-power levels.

Rise time: The time between an initial step command and the first instance of the system reaching that commanded level.

Settling time: The time between an initial step command and the system reaching equilibrium at the commanded level. Usually this is defined as staying within 2% of the commanded level.

References

Franklin, G.F., Powell, J.D., and Workman, M.L. 1990. Digital Control of Dynamic Systems, 2nd ed. Addison- Wesley, Reading, MA.

James, H.M., Nichols, N.B., and Phillips, R.S. 1947. Theory of Servomechanisms, Vol. 25, MIT Radiation Laboratory Series. McGraw-Hill, New York.

Lofthus, R.M., Schweid, S.A., McInroy, J.E., and Ota, Y. 1994. Processing back EMF signals of hybrid step motors. Control Engineering Practice, a journal of the International Federation of Automatic Control 3(1):1–10. (Updated in Vol. 3, No. 1, (Jan.) 1995, pp. 1–10.)

Further Information

Recent research results on the topic of servo systems and control systems in general is available from the following sources:

Control Systems magazine, a monthly periodical highlighting advanced control systems. It is published by the IEEE Press.

The IEEE Transactions on Automatic Control is a scholarly journal featuring new theoretical developments in the field of control systems.

Control Engineering Practice, a journal of the International Federation of Automatic Control, strives to meet the needs of industrial practitioners and industrially related academics and researchers. It is published by Pergamon Press.

In addition, the following books are recommended:

Brogan, W.L. 1985. Modern Control Theory. Prentice-Hall, Englewood Cliffs, NJ. Dorf, R.C. Modern Control Systems. Addison-Wesley. Reading, MA.

Jacquot, R.G. 1981. Modern Digital Control Systems. Marcel Dekker, New York.


Computer Control Systems : Distributed Control Systems (DCS) , Supervisory Control/Real-Time Optimization , Batch Control , Process Control Software , Digital Field Communications , Defining Terms and Further Information .

Computer Control Systems

Distributed Control Systems (DCS)

Microcomputer-based subsystems are standard in most computer control systems available today. The digital subsystems are interconnected through a digital communications network. Such systems are referred to as distributed digital instrumentation and control systems because of the network approach used to monitor and control the progress.

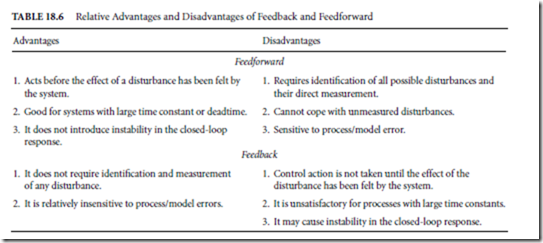
Figure 18.63 depicts a representative distributed control system (Seborg, Edgar, and Mellichamp, 2004). The DCS system consists of many commonly used DCS components, including multiplexers (MUXs), single-loop and multiple-loop controllers, PLCs, and smart devices. A system includes some or all of the following components:

1. Control network. The control network is the communication link between the individual com- ponents of a network. Coaxial cable and, more recently, fiber-optic cable have often been used. A redundant pair of cables (dual redundant highway) is normally supplied to reduce the possibility of link failure.

2. Workstations. Workstations are the most powerful computers in the system, and act both as an arbitrator unit to route internodal communications and the database server. Various peripheral devices are coordinated through the workstations. Computationally intensive tasks, such as real- time optimization or model predictive control, are implemented in a workstation.

3. Real-time clocks. Process control systems must respond to events in a timely manner and should have the capability of real-time control.

4. Operator stations. Operator stations typically consist of color graphics monitors with special key- boards to perform dedicated functions. Operators supervise and control processes from these workstations. Operator stations may be connected directly to printers for alarm logging, printing reports, or process graphics.

5. Engineering Workstations. They are similar to operator stations but can also be used as program- ming terminals to develop system software and applications programs.

6. Remote control units (RCUs). These components are used to implement basic control functions such as PID control. Some RCUs may be configured to acquire or supply set points to single-loop controllers. Radio telemetry (wireless) may be installed to communicate with MUX units located at great distances.

7. Programmable logic controllers (PLCs). These digital devices are used to control batch and sequential processes, but can also implement PID control.

8. Application stations. These separate computers run application software such as databases, spread- sheets, financial software, and simulation software via on OPC interface. OPC is an acronym for object linking and embedding for process control, a software architecture based on standard inter- faces. These stations can be used for e-mail and as webservers, for remote diagnosis, configuration, and even for operation of devices that have an IP (Internet protocol) address. Applications stations can communicate with the main database contained in on-line mass storage systems.

9. Mass storage devices. Typically, hard disk drives are used to store active data, including on-line and historical databases and nonmemory resident programs. Memory resident programs are also stored to allow loading at system start-up.


clip_image004

FIGURE 18.63 A typical distributed control system (DCS).

10. Fieldbuses/smart devices. An increasing number of field-mounted devices are available that support digital communication of the process I/O in addition to, or in place of, the traditional 4–20 mA current signal. These devices have greater functionality, resulting in reduced setup time, improved control, combined functionality of separate devices, and control-valve diagnostic capabilities.

Supervisory Control/Real-Time Optimization

The selection of set points in a distributed control network is called supervisory control. These set points may be determined in a control computer and then transmitted to specific devices (digital or analog controllers) in each control loop. Most supervisory control strategies are based on real-time optimization (RTO) calculations, wherein the set points (operating conditions) are determined by profitability analysis, that is, maximizing the difference between product value (income) and operating costs. For more details on real-time optimization methods such as linear and nonlinear programming or other search techniques see Seborg, Edgar, and Mellichamp (2004). RTO is often used in conjunction with model predictive control.

Batch Control

The increased availability of digital computer control and the emerging specialty chemical business has made batch control a very important component in process plants. Batch operations are of a start- stop nature; however, startup and shutdown of continuous plants must be treated in a similar fashion. Feedback control is of some value for batch processing, but it is more useful for operation near a set point in continuous operations.

The majority of batch steps encompass a wide variety of time-based operating conditions, which are sequential in nature. They can only be managed via a computer control system. Consider the operation of a batch reactor. The operation may include charging the reactor with several reactants (the recipe), applying the heat required to reach the desired reaction temperature, maintaining a specified level of operation until the reaction reaches completion, stopping the reaction, removing the product, and preparing the reactor for another batch.

Discrete functions are implemented via hardware or software to control discrete devices such as on/off valves, pumps, or agitators, based on status (on/off) of equipment or values of process variables. Interlock control can be provided via automatic actuation of a particular device only if certain process conditions sensed by various instruments are met. The two categories of interlocks are safety and permissive interlocks. Safety interlocks are designed to ensure the safety of operating personnel and to protect plant equipment. These types of fail-safe interlocks are associated with equipment malfunction or shutdown. Permissive interlocks establish orderly startup and shutdown of equipment. This prevents accumulation of material in tanks before it is needed. The triggers in the instructions can be time related or process related (temperature, pressure, etc.). Sequencing requires an end condition to be reached before the system can proceed to the next step. More details on batch control system design have been reported by Rosenhof and Ghosh (1987) and Seborg, Edgar, and Mellichamp (2004).

Process Control Software

The introduction of high-level programming languages such as Fortran and Basic in the 1960s was con- sidered a major breakthrough in the area of computer control. For process control applications, some companies have incorporated libraries of software routines for these languages, but others have developed speciality pseudo-languages. These implementations are characterized by their statement-oriented lan- guage structure. Although substantial savings in time and efforts can be realized, software development costs can be significant.

The most successful and user-friendly approach, which is now adopted by virtually all commercial systems, is the fill-in-the-forms or table-driven process control languages (PCL). The core of these languages is a number of basic functional blocks or software modules. All modules are defined as database points. Using a module is analogous to calling a subroutine in conventional programs.

In general, each module contains some inputs and an output. The programming involves softwiring outputs of blocks to inputs of other blocks. Some modules may require additional parameters to direct module execution. The users are required to fill in the sources of input values, the destinations of output values, and the parameters in the blanks of forms/tables prepared for the modules. The source and destination blanks may be filled with process I/Os when appropriate. To connect modules, some systems require filling the tag names of modules originating or receiving data. The blanks in a pair of interconnecting modules are filled with the tag name of the same data point. A completed control strategy resembles a data flow diagram. All process control languages contain PID controller blocks. The digital PID controller is normally programmed to execute in velocity (difference) form. A pulse duration output may be used to receive the velocity output directly. In addition to the tuning constants, a typical digital PID controller contains some entries not normally found in analog controllers:

✁ When a process error is below certain tolerable deadband, the controller ceases modifying the output. This is referred to as gap action.

✁ The magnitude of change in a velocity output is limited by a change clamp.

✁ A pair of output clamps is used to restrict a positional output value from exceeding specified limits.

✁ The controller action can be disabled by triggering a binary deactivate input signal, during process startup, shutdown, or when some abnormal conditions exist.

Although modules are supplied and their internal configurations are different from system to system, their basic functionalities are the same Another recent development has been the availability of flexible, yet powerful, software packages that support the controller design, controller testing, and implementation process. Probably, the most widely used program for this purpose is MATLAB® (The MathWorks, Inc.; www.mathworks.com), due to its flex- ibility. It allows one to implement and test controllers by either solving differential equations, using Laplace transforms, or with block diagrams. MATLAB® also provides a variety of routines that are commonly used for different controller design problems, e.g., optimal control, nonlinear control, optimization, etc. One of the main advantages of MATLAB® is that it is a programming language which provides control-related subroutines. This gives the process engineer flexibility with regard to the use of the software as well as how to extend or reuse already existing routines. It is also possible to exchange data with other software packages from within MATLAB®.

Digital Field Communications

A group of computers can become networked once intercomputer communication is established. Prior to the 1980s, all system suppliers used proprietary protocols to network their systems. The recent introduction of standardized protocols is based on the ISO-OSI∗ seven-layer model. The manufacturing automation protocol (MAP), which adopted the ISO-OSI standards as its basis, specifies a broadband backbone local area network (LAN). Originally intended for discrete component systems, MAP has evolved to address the integration of DCSs used in process control as well. TCP/IP (transmission control protocol/internet protocol) has been adopted for communication between nodes that have different operating systems.

Microprocessor-based process equipment, such as smart instruments and single-loop controllers, are now available with digital communications capability and are used extensively in process plants. A fieldbus, which is a low-cost protocol, provides efficient communication between the DCS and these devices.

Presently, there are several regional and industry-based fieldbus standards, including the French standard (FIP), the German standard (Profibus), and proprietary standards by DCS vendors, generally in the U.S., led by the Fieldbus Foundation. As of 2004, international standards organizations had adopted all of these fieldbus standards rather than a single unifying standard.

Several manufacturers provide fieldbus controllers that reside in the final control element or measurement transmitter. A suitable communications modem is present in the device to interface with a proprietary PC-based, or hybrid analog/digital bus network. Case studies in implementing such digital systems have shown significant reductions in cost of installation (mostly cabling and connections) vs. traditional analog field communication.

An example of a hybrid analog/digital protocol that is open (not proprietary) and in use by several vendors is the highway addressable remote transducer (HART) protocol. Digital communications utilize the same two wires that provide the 4 to 20 mA process control signal without disrupting the actual process signal. This is done by superimposing a frequency-dependent sinusoid ranging from −0.5 to +0.5 mA to represent a digital signal.

Defining Terms

Adaptive control: A control strategy that adjusts its control algorithm as the process changes.

Batch control: Control of a process where there is no inflow/outflow.

Cascade control: Nested multiloop strategy that uses intermediate measured variables to improve control.

Controlled variables: Measurable variables that quantify process performance.

Distributed control system: The standard computer architecture in process control, which involves multiple levels of computers.

Feedback control: A control structure where the controlled variable measurement is compared with the setpoint, generating an error acted upon by the controller.

Feedforward control: A control structure where the disturbance is measured directly and a control action is calculated to counteract it.

Fieldbus: A new communication protocol for digital communication between instruments and a central computer.

Manipulated variables: Input variables that can be adjusted to influence the controlled variables.

Model predictive control: An advanced control strategy that uses a model to optimize the loop performance.

Multivariable control: A control strategy for multiple inputs and multiple outputs.

Statistical process control: A control strategy that keeps a process between upper and lower limits (but not at the setpoint).

Supervisory control: The selection of set points, usually to maximize profitability or minimize costs.

Three-mode (PID) control: A feedback control algorithm that uses proportional, integral, and derivative action on the error signal.

References

Astrom, K.J. and Wittenmark, B. 1994. Adaptive Control, 2nd ed. Addison-Wesley, Reading, MA. Bequette, B.W. 2003. Process Control: Modeling, Design and Simulation. Prentice-Hall, Upper Saddle River, NJ.

Chien, I.L. and Fruehauf, P.S. 1990. Consider IMC tuning to improve controller performance. Chem. Engr.

Prog. 86:33.

Edgar, T.F., Smith, C.L., Shinsky, F.G., Gassman, G.W., Schafbuch, P.J., McAvoy, T.J., and Seborg, D.E.

1997. See. 8, Process control. Perry’s Chemical Engineering Handbook, 7th ed. McGraw-Hill, New York.

Grant, E.L. and Leavenworth, R.S. 1996. Statistical Quality Control, 7th ed. McGraw-Hill, New York.

Maciejowski, J.M. 2002. Predictive Control with Constraints. Prentice-Hall, Upper Saddle River, N.J.

McAvoy, T.J. 1983. Interaction Analysis. Instrument Society of America, Research Triangle Park, NC.

Montgomery, D.C. 2001. Introduction to Statistical Quality Control, 4th ed. Wiley, New York.

Ogunnaike, B. and Ray, W.H. 1995. Process Dynamics: Modeling and Control. Oxford Press, New York.

Qin, S.J. and Badgwell, T.A. 2003. A Survey of Industrial Model Predictive Control Technology, Control Engineering Practice, 11:733.

Rivera, D.E., Morari, M., and Skogestad, S. 1986. Internal model control. 4. PID controller design. Ind.

Eng. Chem. Process Des. Dev. 25:252.

Rosenhof, H.P. and Ghosh, A. 1987. Batch Process Automation. Van Nostrand Reinhold, New York.

Seborg, D.E., Edgar, T.F., and Mellichamp, D.A. 2004. Process Dynamics and Control, 2nd ed. Wiley, New York.

Shinskey, F.G. 1996. Process Control Systems, 4th ed. McGraw-Hill, New York.

Smith, C.A. and Corripio, A.B. 1997. Principles and Practice of Automatic Process Control, 2nd ed. Wiley, New York.

Further Information

Recent research results on specialized topics in process control are given in the following books and conference proceedings:

Astrom, K.J. and Wittenmark, B. 1984. Computer Controlled Systems—Theory and Design. Prentice-Hall, Englewood Cliffs, NJ.

Buckley, P.S., Luyben, W.L., and Shunta, J.P. 1985. Design of Distillation Column Control Systems. Instrument Society of America, Research Triangle Park, NC.

Camacho, E.F. and Bordons, C. 1999 Model Predictive Control. Springer-Verlag, New York.

Kantor, J.C. Garcia, C.E., and Carnahan, B. 1997. Chemical Process Control, CPC-V, AIChE Symp. Series, 93(316).

Liptak, B.G. 1995. Instrument Engineers Handbook. Chilton Book, Philadelphia, PA.

Marlin, T. 1995. Process Control: Designing Processes and Control Systems for Dynamic Performance.

McGraw-Hill, New York.

Rawlings, J.B. and Ogunnaike, B.A., eds. 2002. Chemical Process Control-CPC VI, AIChE Symp. Series, 98(208).


Advanced Control Techniques , Multivariable Control, Model Predictive Control , Feedforward Control , Adaptive Control and Autotuning and Statistical Process Control .

Advanced Control Techniques

Although the single-loop PID controller is satisfactory in many process applications, it does not perform well for processes with slow dynamics, time delays, frequent disturbances, or multivariable interactions. We discuss several advanced control methods next, which can be implemented via computer control.

One of the disadvantages of using conventional feedback control for processes with large time lags or delays is that disturbances are not recognized until after the controlled variable deviates from its setpoint. One way to improve the dynamic response to disturbances is by using a secondary measurement point and a secondary controller; the secondary measurement point is located so that it recognizes the upset condition before the primary controlled variable is affected.

One such approach is called cascade control, which is routinely used in most modern computer control systems. Consider a chemical reactor, where reactor temperature is to be controlled by coolant flow to the jacket of the reactor (Fig. 18.58). The reactor temperature can be influenced by changes in disturbance variables such as feed rate or feed temperature; a feedback controller could be employed to compensate for such disturbances by adjusting a valve on the coolant flow to the reactor jacket. However, suppose an increase occurs in the coolant temperature as a result of changes in the plant coolant system. This will cause a change in the reactor temperature measurement, although such a change will not occur quickly, and the corrective action taken by the controller will be delayed.

image

Cascade control is one solution to this problem (see Fig. 18.59). Here the jacket temperature is measured and an error signal is sent from this point to the coolant control valve; this reduces coolant flow, maintaining the heat transfer rate to the reactor at a constant level and rejecting the disturbance. The cascade control configuration will also adjust the setting of the coolant control valve when an error occurs in reactor temperature. The cascade control scheme shown in Fig. 18.59 contains two controllers. The primary controller is the reactor temperature coolant temperature controller. It measures the reactor temperature, compares it to the setpoint, and computes an output that is the setpoint for the coolant flow rate controller. This secondary controller (usually a proportional only controller) compares the setpoint to the coolant

image

temperature measurement and adjusts the valve. The principal advantage of cascade control is that the secondary measurement (jacket temperature) is located closer to a potential disturbance in order to improve the closed-loop response. See Shinskey (1996) for a discussion of other applications of cascade control.

Multivariable Control

Many processes contain several manipulated variables and controlled variables and are called multivariable systems. An example of a multivariable process was shown in Fig. 18.49, where there are two manipulated variables (flow rate and heat transfer rate) and two controlled variables (tank level and temperature). In many applications we can treat a multivariable process with a set of single-loop controllers by pairing inputs and outputs in the most favorable way. Then each loop can be tuned separately using the techniques mentioned previously. One design method employs the relative gain array (McAvoy, 1983). This formula provides guidelines on which variable pairings should be selected for feedback control as well as gives a measure of the potential quality of control for such a multiloop configuration.

If the loop interactions are not severe, then each single-loop controller can be designed using the techniques described earlier in this section. However, the presence of strong interactions requires that the controllers be detuned to reduce oscillations. A better approach is to utilize multivariable control techniques, such as model predictive control. Multivariable control is often used in distillation towers as well as in refinery operations such as cracking or reforming.

Model Predictive Control

The model-based control strategy that has been most widely applied in the process industries is model predictive control (MPC). It is a general method that is especially well suited for difficult multi-input, multi-output (MIMO) control problems where there are significant interactions between the manipu- lated inputs and the controlled outputs. Unlike other model-based control strategies, MPC can easily accommodate inequality constraints on input and output variables such as upper and lower limits, or rate of change limits (Ogunnaike and Ray, 1995). These problems are addressed by MPC by solving an optimization problem (Seborg, Edgar, and Mellichamp, 2004). One formulation of an objective function to be minimized is shown below:

image

where yk refers to the output vector at time k, ysp is the set point for this output, Λuk = uk uk−1 is the change of the input between time steps k − 1 and k, and Q and R are weighting matrices. This objective function will penalize deviations of the controlled variable from the desired set point over the prediction horizon of length P as well as changes in the manipulated variable over the control horizon of length M. The optimization determines a future input trajectory that minimizes the objective function subject to constraints on the manipulated as well as the controlled variables. The predictions yk are made based upon a model of the plant. This plant model will be updated using deviations between the predicted output and the real plant output from past data. An illustration of the trajectories for the manipulated (discrete trajectory) as well as the controlled variables (continuous trajectory) are shown in Figure 18.60.

A variety of different types of models can be used for the prediction. Choosing an appropriate model type is dependent upon the application to be controlled. The model can be based upon first-principles or it can be an empirical model. Also, the supplied model can be either linear or nonlinear, as long as the model predictive control software supports this type of model. Most industrial applications of MPC have relied on linear empirical models, because they can more easily be identified and solved and approximate most processes fairly well. Also, many MPC implementations change set points in order to move the plant to a desired steady state; the actual control changes are implemented by PID controllers in response to the set points. There are over 1000 applications of MPC techniques in oil refineries and petrochemical plants around the world. Thus, MPC has had a substantial impact and is currently the method of choice for difficult constrained multivariable control problems in these industries (Qin and Badgwell, 2003).

image

A key reason why MPC has become a major commercial and technical success is that there are numerous vendors who are licensed to market MPC products and install them on a turnkey basis. Consequently, even medium-sized companies are able to take advantage of this new technology. Payout times of 3–12 months have been reported. Refer to Maciejowski (2002) for further details on model predictive control.

image

Feedforward Control

If the process exhibits slow dynamic response and disturbances are frequent, then the addition of feed forward control with feedback control may be advantageous. Feedforward control differs from feedback control in that the primary disturbance is measured via a sensor and the manipulated variable is adjusted so that the controlled variable does not change (see Fig. 18.61). To determine the appropriate settings for the manipulated variable, one must develop mathematical models which relate:

✁ The effect of the manipulated variable on the controlled variable.

✁ The effect of the disturbance on the controlled variable.

These models can be based on steady-state or dynamic analysis. The performance of the feedforward controller depends on the accuracy of both models. If the models are exact, then feedforward control offers the potential of perfect control, that is, holding the controlled variable precisely at the setpoint at all times because of the ability to predict the appropriate control action. However, because most mathematical models are only approximate and not all disturbances are measurable, it is standard practice to utilize

image

feedforward control in conjunction with feedback control. Table 18.6 lists the relative advantages and disadvantages of feedforward and feedback control. By combining the two control methods, the strengths of both schemes can be utilized.

The tuning of the controller in the feedback loop can be theoretically performed independent of the feedforward loop, that is, the feedforward loop does not introduce instability in the closed-loop response. For more information on feedforward/feedback control applications and design of such controllers, refer to Shinskey (1996).

Adaptive Control and Autotuning

Process control problems inevitably require on-line tuning of the controller constants to achieve a satis- factory degree of control. If the process operating conditions or the environment changes significantly, the controller may have to be retuned. If these changes occur quite frequently, then adaptive control techniques should be considered. An adaptive control system is one in which the controller parameters are adjusted automatically to compensate for changing process conditions (Astrom and Wittenmark, 1994). Several adaptive controllers have been field-tested and commercialized in the U.S. and abroad.

Most commercial control systems have an autotuning function that is based on placing the process in a controlled oscillation at very low amplitude, comparable with that of the noise level of the process. This is done via a relay-type step function with hysteresis. The autotuner identifies the dynamic parameters of the process (the ultimate gain and period) and automatically calculates Kc , τI , and τD using empirical tuning rules. Gain scheduling can also be implemented with this controller, using several sets of PI or PID controller parameters.

Statistical Process Control

Statistical process control (SPC), also called statistical quality control (SQC), has found widespread application in recent years due to the growing focus on increased productivity. Another reason for its increasing use is that feedback control cannot be applied to many processes due to a lack of on-line measurements as is the case in many microelectronics fabrication processes. However, it is important to know if these processes are operating satisfactorily. While SPC is unable to take corrective action while the process is moving away from the desired target, it can serve as an indicator that product quality might not be satisfactory and that corrective action should be taken for future plant operations.

For a process that is operating satisfactorily the variation of product quality will fall within acceptable bounds. These bounds usually correspond to the minimum and maximum values of a specified product property. Normal operating data can be used to compute the mean y¯ and the standard deviation σ of a given process variable from a series of n observations y1, y2, ... , yn as follows:

image

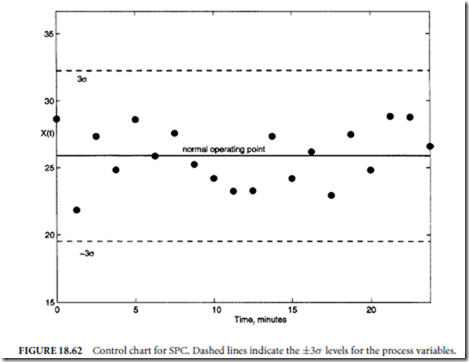
The standard deviation is a measure for how the values of y spread around their mean. A large value of σ indicates that wide variations in y occur. Assuming the process variable follows a normal probability distribution, then 99.7% of all observations should lie within an upper limit of y¯ + 3σ and a lower limit of y¯ − 3σ . These limits can be used to determine the quality of the control. If all data from a process lie within the ±3σ limits, then it can be concluded that nothing unusual has happened during the recorded time period, the process environment is relatively unchanged, and the product quality lies within specifications. On the other hand, if repeated violations of the limits occur, then the conclusion can be drawn that the process is out of control and that the process environment has changed. Once this has been determined, the process operator can take action in order to adjust operating conditions to counteract undesired changes that have occurred in the process conditions.

There are several specific rules that determine if a process is out of control. Some of the more widely used ones are the Western-Electric rules that state that a process is out of control if process data include

✁ One measurement outside the ±3σ control limit

✁ Any seven consecutive measurements lying on the same side of the mean

✁ A decreasing or increasing trend for any seven consecutive measurements

✁ Any nonrandom pattern in the process measurements

These rules can be applied to data in a control chart, such as a shown in Figure 18.62, where pressure measurements are plotted over a time horizon. It is then possible to read off from the control chart if the process is out of control or if it is operating within normal parameters.

image

Because a process that is out of control can have important economic consequences, such as product waste and customer dissatisfaction, it is important to keep track of the state of the process. Statistical process control provides a convenient method to continuously monitor process performance and product quality. However, it differs from automatic process control (such as feedback control) in that it serves as an indicator that the process is not operating within normal parameters. SPC does not automatically provide a controller setting that will bring the process back to its desired operating point or target.

More details on SPC can be found in References (Seborg, Edgar, and Mellichamp, 2004; Ogunnaike and Ray, 1995; Montgomery, 2001; Grant and Leavenworth, 1996).


Final Control Elements , Control Valves , Adjustable Speed Pumps , Feedback Control Systems , On-Off Controllers , Three Mode (PID) Controllers , Stability Considerations , Manual/Automatic Control Modes , Tuning of PID Controllers and On-Line Tuning .

Final Control Elements

A final control element is a device that receives the manipulated variable from the controller as input and takes action that influences the process in the desired manner. In the process industries valves and pumps are the most common final control elements, because of the necessity to adjust a fluid flow rate such as coolant, steam, or the main process stream.

Control Valves

The control valve is designed to be remotely positioned by the controller output, which is usually an air pressure signal. The valve design contains an opening with variable cross sectional area through which the

image

fluid can flow. A stem that travels up or down according to a change in the manipulated variable changes the area of the opening and thereby the flowrate. At the end of the stem is a plug of specific shape, which fits into a seat or ring on the perimeter of the valve port. This plug/seat combination is called the valve trim, and it determines the steady-state gain characteristics of the control valve. Based on safety considerations the control valve can be configured to be either air-to-open or air-to-close.

The inherent characteristics of control valves allow classification into three main groups, based on the relationship between valve flow and valve position under constant pressure: linear, equal-percentage, and quick opening (Seborg, Edgar, and Mellichamp, 2004; see Fig. 18.51). Usually in-plant testing is used to determine the actual valve characteristics because the dynamics of the valve can depend on other flow resistances in the process.

The response time of a pneumatic valve is related to the distance from the actuator to the valve, because the pneumatic signal has to travel the distance between the actuator and the valve. It is important for the design of the process that the response time of the valve is at least one order of magnitude faster than the process. Usually valve response times are several seconds, which is small compared to process time constants of minutes and hours. Pneumatic valve performance often suffers from nonideal behavior such as valve hysteresis. In order to achieve better reproducibility and a faster response a valve positioner can be installed to control the actual stem position rather than the diaphragm air pressure (Edgar, Smith, Shinskey, Gassman, Schafbuch, McAvoy, and Seborg, 1997).

Adjustable Speed Pumps

Instead of using fixed speed pumps and then throttling the process with a control valve, an adjustable speed pump can be used as the final control element. In these pumps speed can be varied by using variable- speed drivers such as turbines or electric motors. Adjustable speed pumps offer energy savings as well as performance advantages over throttling valves to offset their higher cost. One of these performance advantages is that, unlike a throttling valve, an adjustable pump does not contain dead time for small amplitude responses. Furthermore, nonlinearities associated with friction in the valve are not present in electronic adjustable speed pumps. However, adjustable speed pumps do not offer shutoff capability like control valves and extra flow check valves or automated on/off valves may be required.

Feedback Control Systems

Feedback control is a fundamental concept that is employed in PID controllers as well as in advanced process control techniques. Figure 18.52 shows a simplified instrumentation diagram for feedback control of the stirred tank discussed earlier, where the inlet flow is equal to the outlet flow (hence, no level control is needed) and outlet temperature is controlled by the steam pressure. Figure 18.53 shows a generic block diagram for a feedback control system. In feedback control the controlled variable is measured

image

and compared to the set point. The resulting error signal is then used by the controller to calculate the appropriate corrective action for the manipulated variable. The manipulated variable influences the controlled variable through the process, which is dynamic in nature.

In many industrial control problems, notably those involving temperature, pressure, and flow control, measurements of the controlled variable are available, and the manipulated variable is adjusted via a control valve. In feedback control, corrective action is taken regardless of the source of the disturbance. Its chief drawback is that no corrective action is taken until after the controlled variable deviates from the set point. Feedback control may also result in undesirable oscillations in the controlled variable if the controller is not tuned properly, that is, if the adjustable controller parameters are not set at appropriate values. The tuning of the controller can be aided by using a mathematical model of the dynamic process, although an experienced control engineer can use trial-and-error tuning to achieve satisfactory performance in many cases. Next, we discuss the two types of controllers used in most commercial applications.

On-Off Controllers

An on-off controller is the simplest type of feedback controller and is widely used in the thermostats of home heating systems and in domestic refrigerators because of its low cost. This type of controller is seldom used in industrial plants, however, because it causes continuous cycling of the controlled variable and excessive wear on the control valve.

In on-off control, the controller output has only two possible values:

image

Three Mode (PID) Controllers

Most applications of feedback control employ a controller with three modes: proportional (P), integral (I), and derivative (D). The ideal PID controller equation is

image

where p is the controller output, e is the error in the controlled variable, and p¯ is the bias, which is set at the desired controller output when the error signal is zero. The relative influence of each mode is determined by the parameters Kc , τI , and τD .

The PID controller input and output signals are continuous signals which are either pneumatic or electrical. The standard range for pneumatic signals is 3–15 psig, whereas several ranges are available for electronic controllers including 4–20 mA and 1–5 V. Thus, the controllers are designed to be compatible with conventional transmitters and control valves. If the PID controller is implemented as part of a digital control system, the discrete form of the PID equation is used,

image

where Λt is the sampling period for the control calculations and n denotes the current sampling time. Digital signals are scaled from 0 to 10 V DC.

The principle of proportional action requires that the amount of change in the manipulated variable (e.g., opening or closing of the control valve) vary directly with the size of the error. The controller gain Kc affects the sensitivity of the corrective action and is usually selected after the controller has been installed. The actual input-output behavior of a proportional controller has upper and lower bounds; the controller output saturates when the limits of 3 or 15 psig are reached. The sign of Kc depends on whether the controller is direct acting or reverse acting, that is, whether the control valve is air-to-open or air-to-close.

Integral action in the controller brings the controlled variable back to the set point in the presence of a sustained upset or disturbance. Because the elimination of offset (steady-state error) is an important control objective, integral action is normally employed, even though it may cause more oscillation. A potential difficulty associated with integral action is a phenomenon known as reset windup. If a sustained error occurs, then the integral term in Eq. (18.9) becomes quite large and the controller output eventually saturates. Reset windup commonly occurs during the start up of a batch process or after a large set-point change. Reset windup also occurs as a consequence of a large sustained load disturbance that is beyond the range of the manipulated variable. In this situation the physical limitations on the manipulated variable (e.g., control valve fully open or completely shut) prevent the controller from reducing the error signal to zero. Fortunately, many commercial controllers provide antireset windup by disabling the integral mode when the controller output is at a saturation limit.

Derivative control action is also referred to as rate action, preact, or anticipatory control. Its function is to anticipate the future behavior of the error signal by computing its rate of change; thus, the shape of the error signal influences the controller output. Derivative action is never used alone, but in conjunction with proportional and integral control. Derivative control is used to improve the dynamic response of the controlled variable by decreasing the process response time. If the process measurement is noisy, however, derivative action will amplify the noise unless the measurement is filtered. Consequently, derivative action is seldom used in flow controllers because flow control loops respond quickly and flow measurements tend to be noisy. In the chemical industry, there are more PI control loops than PID.

To illustrate the influence of each controller mode, consider the control system regulatory responses shown in Fig. 18.54. These curves illustrate the typical response of a controlled process for different types of feedback control after the process experiences a sustained disturbance. Without control the process slowly reaches a new steady state, which differs from the original steady state. The effect of proportional control is to speed up the process response and reduce the error from the set point at steady state, or offset. The addition of integral control eliminates offset but tends to make the response more oscillatory.

Adding derivative action reduces the degree of oscillation and the response time, that is, the time it takes the process to reach steady state. Although there are exceptions to Fig. 18.54, the responses shown are typical of what occurs in practice.

image

Stability Considerations

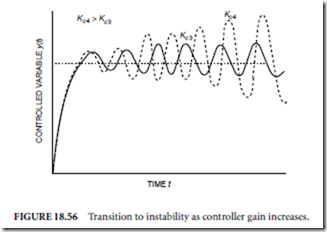
An important consequence of feedback control is that it can cause oscillations in closed-loop systems. If the oscillations damp out quickly, then the control system performance is generally considered to be acceptable. In some situations, however, the oscillations may persist or their amplitudes may increasewith time until a physical bound is reached, such as a control valve being fully open or completely shut. In the latter situation, the closed-loop system is said to be unstable. If the closed-loop response is unstable or too oscillatory, this undesirable behavior can usually be eliminated by proper adjustment of the PID controller constants, K , τ , and τ . Consider Kc 2 Kc 2 > Kc1 c I D the closed-loop response to a unit step change in setpoint for various values of controller gain Kc . For small values of Kc , say Kc 1 and Kc 2, typical closed-loop responses are shown in Fig. 18.55. If the controller gain is increased to a value of Kc 3, the sustained oscillation of Fig. 18.56 results; a larger gain, Kc 4 produces the unstable response shown in Fig. 18.56. Note that the amplitude of the unstable oscillation does not continue to grow indefinitely because a physical limit will eventually be reached, as previously noted. In general as the controller gain increases, the closed-loop response typically becomes more oscillatory and, for large values of Kc , can become unstable.

The conditions under which a feedback control system becomes unstable can be determined theoretically using a number of different techniques (Seborg, Edgar, and Mellichamp, 2004).

image

Manual/Automatic Control Modes

In certain situations the plant operator may wish to override the automatic mode and adjust the controller output manually. In this case there is no feedback loop. This manual mode of operation is very useful during plant start-up, shut-down, or in emergency situations. Testing of a process to obtain a mathematical model is also carried out in the manual mode. Commercial controllers have a manual automatic switch for switching from automatic mode to manual mode and vice versa. Bumpless transfers, which do not upset the process, can be achieved with commercial controllers.

Tuning of PID Controllers

Before tuning a controller, one needs to ask several questions about the process control system:

✁ Are there any potential safety problems with the nature of the closed-loop response?

✁ Are oscillations permissible?

✁ What types of disturbances or set-point changes are expected?

There are several approaches that can be used to tune PID controllers, including model-based correlations, response specification, and frequency response (Seborg, Edgar, and Mellichamp, 2004; Ogunnaike and Ray, 1995). One approach that has recently received much attention is model-based controller design. Model-based control requires that a dynamic model of the process is available. The dynamic model can be empirical, such as the popular first-order plus time delay type of model, or it can be of higher order.

For most processes it is possible to find a range of controller paramters (Kc , τI , τD ) that give closed loop stability; in fact, most design methods provide ∆y a reasonable margin of safety for stability and the controller parameters are chosen in order to meet dynamic performance criteria in addition to guaranteeing stability.

One well-known technique for determining an empirical model of a process is the process reaction curve (PRC) method. In the PRC technique, the actual process is operated under manual control, and a step change in the controller output (Λp) is carried 0 θ out. The size of the step is typically 5% of the span, depending on noise levels for the process variables.

One should be careful to take data when other plant fluctuations are minimized. For many processes, the response of the system Λy (change in the measured value of the controlled variable using a sensor) follows the curve shown in Fig. 18.57 (see case 6 in Fig. 18.50). Also shown is the graphical fit bya first order plus time delay model, which is described by three parameters:

1. the process gain K

2. the time delay θ

3. the dominant time constant τ

image

While nonlinear regression can be employed to find K , θ, and τ from step response data, graphical analysis of the step response can provide good estimates of θ and τ . In Fig. 18.57 the process gain is a steady-state characteristic of the process and is simply the ratio Λyp. The time delay θ is the time elapsed before Λy deviates from zero. The time to reach 63% of the final response is equal to θ + τ .

A variety of different tuning rules exists which are based on the assumption that the model can be accurately approximated by a first-order plus time delay model. One popular approach, which is not

image

restricted to this type of model but nevertheless achieves good performance for it, is internal model control (IMC) (Rivera, Morari, and Skogestad, 1986; Bequette, 2003; Seborg, Edgar, Mellichamp, 2004). Controller tuning using IMC requires only choosing the value of the desired time constant of the closed- loop system, τc , in order to compute the values of the three controller tuning parameters, KC , τI , τD . The value of τc can be further adjusted based on simulation or experimental behavior. The tuning relations for a PI and PID controller for a process which is described by a first-order plus time delay model are shown in Table 18.5 (Chien and Fruehauf, 1990). Tuning relations for other types of process models can be found in Seborg, Edgar, Mellichamp (2004).

Another popular tuning method uses integral error criteria such as the time-weighted integral absolute error (ITAE). The controller parameters are selected in order to minimize the integral of the error. ITAE weights errors at later times more heavily, giving a faster response. Seborg, Edgar, and Mellichamp (2004) have tabulated power law correlations for these PID controller settings for a range of first-order model parameters K, τ , and θ .

Other plant testing and controller design approaches such as frequency response can also be used for more complicated models; refer to Seborg, Edgar, and Mellichamp (2004) for more details.

On-Line Tuning

The model-based tuning of PID controllers presumes that the model is accurate; thus these settings are only a first estimate of the best parameters for an actual operating process. Minor on-line adjustments of Kc , τI , and τD are usually required. Another technique, called continuous cycling, actually operates the loop at the point of instability, but this approach has obvious safety and operational problems, so it is not used much today. A recent improvement on continuous cycling uses a relay feedback configuration, which puts the loop into a controlled oscillation. The amplitude and period of the oscillation can be used to set proportional and integral settings.


Process Dynamics and Control : Introduction , Objectives of Process Control and Development of a Mathematical Model .

Process Dynamics and Control
Introduction

The field of process dynamics and control is concerned with the analysis of dynamic behavior of processes, process simulation, design of automatic controllers, and associated instrumentation. Process control as practiced in the process industries has undergone significant changes since it was first introduced in the 1940s. Perhaps the most significant influence on the changes in process control technology has been the introduction of digital computers and instruments with greater capabilities than their analog predecessors. During the past 25 years automatic control has assumed increased importance in the process industries, which has led to the application of more sophisticated techniques (Seborg, Edgar, and Mellichamp, 2004; Ogunnaike and Ray, 1995).

For instrumenting and controlling a modern plant, it is necessary that an engineer has an understanding of the time-dependent behavior of typical processes. This in turn requires an appreciation of how mathematical tools can be employed in analysis and design of automatic control systems. In this chapter we present the basic ideas involved in developing dynamic models for typical processes and then discuss the use of control valves and proportional-integral-derivative (PID) feedback controllers for process control. Next, various types of advanced control methods that have seen commercial use are reviewed. Finally, some comments on computer control are included. For a thorough discussion of process instrumentation and measurement devices, the reader is referred to other entries in the section, “Control and Instrumentation Technology,” in this handbook.

Objectives of Process Control

The main economic objective of process control is to achieve maximum productivity or efficiency while maintaining a satisfactory level of product quality. Manufacturing facilities in the production of chemicals, paper, metals, power, food, and pharmaceuticals require accurate and precise control systems. Although the methods of production vary from industry to industry, the principles of automatic control are generic in nature and can be universally applied, regardless of the size of the plant.

Consider the control of the stirred tank reactor shown in Fig. 18.49. This system can be used to introduce basic concepts and definitions in process control, as given by the following:

1. Controlled variables: These are the variables that quantify the performance or quality of the final product, which are also called output variables. In Fig. 18.49, the controlled variables are the tank temperature T and the liquid level in the tank h. Controlling the temperature allows the chemical reaction to proceed at a specified rate. The tank level determines the residence time in the reactor. The desired operating point for each controlled variable is called the set point.

2. Manipulated variables: These input variables are adjusted dynamically to keep the controlled variables at their setpoints. There are two manipulated variables in Fig. 18.49, namely, the exit flow rate wo and the steam pressure Ps to the heat transfer coil in the tank.

3. Disturbance variables: These are also called load variables and represent input variables that can cause the controlled variables to deviate from their respective set points. For the stirred tank heater, both the feed rate wi and feed temperature Ti can change, causing the tank level and exit temperature to move away from the set points.

In the design of controllers for this process, two cases can be evaluated:

1. Set point change: This involves carrying out a change in the operating conditions, e.g., from a tank exit temperature of 125 to 150◦C while holding the level constant. The set-point signal is changed, and the heat transfer rate is adjusted appropriately to achieve the new operating conditions. The changing of set points is also called servomechanism (or servo) control, and it can require a time span as short as a few seconds to as long as several hours to carry out, depending on the process design variables. In Fig. 18.49, such design variables could include the flow rate and the tank holdup.

image

2. Disturbance change: This case relates to the process transient behavior when a disturbance enters, also called regulatory control. A control system should be able to return each controlled variable back to its set point.

Several other definitions need to be discussed here. Steady-state behavior pertains to the case where there is no variation in the process variables with respect to time. If the system is in equilibrium (at steady state), it can be described by algebraic equations, such as material and energy balances. Unsteady-state (dynamic) behavior occurs when the process variables change as a function of time. The required mathematical model for this case includes ordinary differential equations as well as algebraic relationships.

Three further classifications deal with how process control is implemented, namely:

✁ Open-loop or manual control

✁ Closed-loop or feedback control

Feedforward control

Manual control implies that the operator makes the changes in manipulated variable, which is used occasionally. Feedback control connotes that the manipulated variable is changed automatically in response to the error between the set point and controlled variable. The second approach serves as the basis for most automatic control schemes. Feedforward control is a technique where the manipulated variable is changed as a function of a disturbance variable. Both feedback and feedforward control are discussed in later sections of this chapter.

Development of a Mathematical Model

There are a number of modeling approaches that can be used with process control systems. Whereas mathematical models based on the chemistry and physics of the system represent one alternative, the typical process control model utilizes an empirical input/output relationship, the so-called black-box model. These models are found by experimental tests of the process. Mathematical models of the control system may include not only the process but also the controller, the final control element, and other electronic components such as measurement devices and transducers. Once these component models have been determined, one can proceed to analyze the overall system dynamics, the effect of different controllers in the operating process configuration, and the stability of the system, as well as obtain other useful information.

Mathematical models provide a convenient and compact way of expressing the behavior of a process as a function of process physical parameters and process inputs. The same mathematical model can be expressed in several ways; for example, a continuous-time model based on a differential equation can be converted to a discrete-time system, or it can be transformed to a different type of independent variable altogether (e.g., Laplace transforms or z transforms). Transform models generally feature a simplified notation, which greatly facilitates analysis of complicated systems.

A simple dynamic system with one input and one output can be represented by equations of the form

imagewhere y is the output, u is the input, and t is time. The time solution to this equation can be found by integrating Eq. (18.1) for a given input u(t), based on a specified initial condition for the output y(0). By letting dy/dt = 0, steady-state or equilibrium value(s) of y can be found for each selected value of u, the input, by solving the algebraic equation

imageTheoretical models of chemical processes normally involve sets of nonlinear differential equations that arise from mass and energy balances, thermodynamics, reaction kinetics, transport phenomena, and physical property relationships. Because of the difficulty of developing such theoretical models, simpler models are usually sought for the purposes of control, either by linearization of the nonlinear models or by making simplifying assumptions. On the other hand, a less time-consuming approach involves developing black box models, which are obtained by fitting experimental input-output data. This latter approach has been the historical basis of process control practice. During the past 10 years, however, there has been increasing use of fundamental models in design and control, largely due to the availability of modeling software packages.

Denoting K as the process gain, the simplest dynamic model used in process control is a first-order linear differential equation:

imagewhere τ is the time constant and K is the process gain.

At steady state, yss = K u. Linear dynamic models such as Eq. (18.3) provide a theoretical means to determine the time scale of the process. For a step change in u (= M), the solution to Eq. (18.3) can be found analytically,

imageFrom Eq. (18.4) we can conclude that the response of y reaches 63.2% of its final value when t = τ (1 − e−1) = 0.632. In this way, τ determines the speed of response for the system.

Experience in the process industries indicates that there are a limited number of expected dynamic behaviors that actually influence the controller design step. These behaviors can be categorized using the step response and are based on a transfer function representation of the process model, which is assumed to be linear or a linear approximation of a nonlinear model. A transfer function is found by taking the Laplace transform of the ordinary differential equation that describes the system; the mathematical definition of the Laplace transform is

imagewhere f (t) is a specified function of time.

The chief mathematical advantage of the Laplace transform is the conversion of the differential equation (such as Eq. (18.1)) to an algebraic equation. The resulting equation can be rearranged as a transfer function,

image

G (s ) describes the dynamic characteristics of the process. For linear systems it is independent of the input variable, so it applies for any time-dependent input signal. For the model in Eq. (18.3), the transfer function is

image

where K is the process gain and τ the time constant already mentioned.

Transfer functions can also be used to describe the dynamic behavior of instruments, controllers, and valves. For a temperature transmitter the steady-state gain is simply the output span divided by the input span; an electronic transmitter which has a 4–20 mA output and a 100–200◦F temperature input range gives a gain of (20 − 4)/(200 − 100) = 0.16 mA/◦F. Sensors usually have simple dynamics, typically described by a first-order transfer function. The characteristics of control valves are more complicated and are discussed in the next section.

The order of the transfer function is the power of the polynomial in s in the denominator of G (s ) and is equivalent to the order of the differential equation describing the process. There are a limited number of dynamic transfer functions that are important for process control; Fig. 18.50 shows the dynamic response

image

of nine different cases that result from a step change in the input variable. Simple approximate models are usually developed from experimental tests, and the model parameters are fitted either graphically or by nonlinear regression. In Fig. 18.50 only first- and second-order models are used. Some comments on each case are given next:

Case 1

This is the first-order system discussed previously, which is the analog of a resistance-capacitance circuit in electronics. It is mainly applicable to responses of instruments (sensors and valves) but usually is inadequate to describe dynamic behavior of actual chemical processes.

Case 2

The second-order system response provides a better approximation for many real processes dynamics, such as chemical reactors and distillation columns.

Case 3

Overshoot can occur in some open-loop systems as shown here, but this case is relatively rare. Some controllers exhibit this behavior.

Case 4

This behavior is called inverse response, where the output initially goes the opposite direction to the final value. This wrong-way behavior is seen in boilers and distillation columns.

Case 5

Pure delay or dead time usually occurs due to transportation lag, such as flow through a pipe. For a velocity

v and distance L , θ = L /v . Another case is a measurement delay, such as for a gas or liquid chromatograph.

Case 6

This is a more realistic response than case 1 because it allows for a time delay as well as first-order behavior, and can be applied to many chemical processes. The delay time may not be clearly identified as transport lag but may be imbedded in higher order dynamics. Hence, this is an approximate but very useful model, especially for staged systems such as distillation or extraction columns. An extension of this model is second order plus time-delay, the response of which is equivalent to case 2 or case 4 with an initial time delay. The advantage over first-order models is that an additional model parameter can give greater accuracy in fitting process data.

Case 7

The integrator describes the behavior of level systems, where the step input (such as a flow change) causes the level to increase with constant slope until the flow is reduced to its original value. There is no time constant here because the level does not reach steady state for a step input but continues to increase until the step input is terminated (or the vessel overflows).

Case 8

Oscillation in the step response is rare for chemical processes under open-loop or manual conditions. When feedback control is implemented, with processes described by cases 2–6, the occurrence of oscillation is quite common. In fact, a well-tuned feedback controller exhibits some degree of oscillation, as discussed later. The time constants for this case are not real values but are imaginary numbers.

Case 9

If any time constant is negative (τ in this case is not physically meaningful), the response is unstable. The output response becomes larger with time and is unbounded. No real system actually behaves this way since some constraint will eventually be reached; for example, a safety valve will open. A linear process is at the limit of instability if it oscillates without decay. Most processes are stable and do not require a controller for stability; however, such self-regulating processes may exhibit very slow responses unless feedback control is applied. On the other hand, when feedback control is used with some processes, instability can occur if the controller is incorrectly designed (see later discussion on controller tuning). There are a few processes, such as chemical reactors, which may be unstable in the open loop, but these can be stabilized by feedback control.

In summary, with all of the various dynamic behaviors shown in Fig. 18.50, it is important for plant engineers, instrument specialists, and even some operators to understand the general dynamic character- istics of a process. It is also crucial that they know how various processes respond under the influence of feedback control.


Common Issues with PC-based Data Acquisition , The Low-Noise Voltmeter Standard , Proper Wiring and Signal Connections , Source Impedance Considerations, Pinpointing Your Noise Problems , Noise Removal Strategies , Signal Amplification , Averaging , Filtering , Grounding , Grounded and Floating Signal Sources and Types of Measurement Inputs .

Common Issues with PC-based Data Acquisition

Aside from software and programming, the most common problem users run into when putting together DAQ systems is a noisy measurement. Unfortunately, noise in DAQ systems is a complicated issue and difficult to avoid. However, it is useful to understand where noise typically comes from, how much noise is to be expected, and some general techniques to reduce or avoid noise corruption.

The Low-Noise Voltmeter Standard

One of the most common questions asked of technical support personnel of DAQ vendors concerns the voltmeter. Users connect their signal leads to a handy voltmeter or digital multimeter (DMM), without worrying too much about cabling and grounding, and obtain a rock solid reading with little jitter. The user then duplicates the experiment with a DAQ board and is disappointed to find that the readings returned by the DAQ board look very noisy and very unstable.

The user decides there is a problem with the DAQ board and calls the technical support line for help. In fact, the user has just demonstrated the effects of two different measurement techniques, each with advantages and disadvantages. DAQ boards are designed as flexible, general-purpose measurement devices. The DAQ board front end typically consists of a gain amplifier and a sampling analog-to-digital converter. A sampling ADC takes an instantaneous measurement of the input signal. If the signal is noisy, the sampling ADC will digitize the signal as well as a noise. The digital voltmeter, on the other hand, will use an integrating ADC that integrates the signal over a given time period. This integration effectively filters out any high-frequency noise that is present in the signal.

Although the integrating input of the voltmeter is useful for measuring static, or DC signals, it is not very useful for measuring changing signals or digitizing waveforms, or for capturing transient signals. The plug-in DAQ for board, with its sampling ADC, has the flexibility to perform all of these types of measurements. With a little software, the DAQ board can also emulate the operation of the integrating voltmeter by digitizing the static signal at a higher rate and performing the integration, or averaging, of the signal in software.

Where Does Noise Come from?

There are basically four possible sources of noise in a DAQ system:

✁ Signal source, or transducer

✁ Environment (noise induced onto signal leads)

✁ PC environment

✁ DAQ board

Although the signal source is commonly a significant source of noise, that topic is beyond the scope of this chapter. Most measurement noise problems are the result of noise that is radiated, conducted, or coupled onto signal wires attaching the sensor or transducer to the DAQ equipment. Signal wires basically act as antennas for noise.

Placing a sensitive analog measurement device, like a plug-in DAQ board, inside a PC chassis might seem like asking for trouble. The high-speed digital traffic and power supplies inside a PC are prime candidates for noise radiation. For example, it is a good idea to not install your DAQ board directly next to your video card.

Probably the most dangerous area for your analog signals is not inside the PC, but on top of it. Keep your sig- nal wires clear of your video monitor, which can radiate large high-frequency noise levels onto your signal. The DAQ board itself can be a source of measurement noise. Poorly designed boards, for example, may not properly shield the analog sections from the digital logic sections that radiate high-frequency switching noise. Properly designed boards, with well-designed shielding and grounding, can provide very low-noise measurements in the relatively noisy environment of the PC.

Proper Wiring and Signal Connections

In most cases, the major source of noise is the environment through which the signal wires must travel. If your signal leads are relatively long, you will definitely want to pay careful attention to your cabling scheme. A variety of cable types are available for connecting sensors to DAQ systems. Unshielded wires or ribbon cables are inexpensive and work fine for high-level signals and short to moderate cable lengths. For low-level signals or longer signal paths, you will want to consider shielded or twisted-pair wiring. Tie the shield for each signal pair to ground reference at the source. Practically speaking, consider shielded, twisted-pair wiring if the signal is less than1V or must travel farther than approximately 1 m. If the signal has a bandwidth greater than 100 kHz, however, you will want to use coaxial cables.

Another useful tip for reducing noise corruption is to use a differential measurement. Differential inputs are available on most signal conditioning modules and DAQ boards. Because both the (+) and (−) signal lines travel from signal source to the measurement system, they pick up the same noise. A differential input will reject the voltages that are common to both signal lines. Differential inputs are also best when measuring signals that are referenced to ground. Differential inputs will avoid ground loops and reject any difference in ground potentials. On the other hand, single-ended measurements reference the input to ground, causing ground loops and measurement errors.

Other wiring tips:

✁ If possible, route your analog signals separately from any digital I/O lines. Separate cables for analog and digital signals are preferred.

✁ Keep signal cables as far as possible from AC and other power lines.

✁ Take caution when shielding analog and digital signals together. With a single-ended (not differential) DAQ board, noise coupled from the digital signals to the analog signals via the shield will appear as noise. If using a differential input DAQ board, the coupled noise will be rejected as common-mode noise (assuming the shield is tied to ground at one end only).

Source Impedance Considerations

When time-varying electric fields, such as AC power lines, are in the vicinity of your signal leads, noise is introduced onto the signal leads via capacitive coupling. The capacitive coupling increases in direct proportion to the frequency and amplitude of the noise source and to the impedance of the measurement circuit. Therefore, the source impedance of your sensor or transducer has a direct effect on the susceptibility of your measurement circuit to noise pickup. The higher the source impedance of your sensor or signal source, the larger the amount of capacitive coupling. The best defense against capacitive noise coupling is the shield that is grounded at the source end. Table 18.4 lists some common transducers and their impedance characteristic.

Pinpointing Your Noise Problems

If your system is resulting in noisy measurements, follow these steps to determine the source of the noise and how best to reduce it. The first step can also give you an idea of the noise performance of your DAQ board itself. The steps are

1. Short one of the analog input channels of the DAQ board to ground directly at the I/O connector of the board. Then, take a number of readings and plot the results. The amount of noise present is the amount of noise introduced by the PC and the DAQ board itself with a very low-impedance

image

input. Typical results are shown in Fig. 18.46. This plot shows a reading that jumps between 0.00 and 2.44 mV. Because this particular board uses a 12-b ADC and the amplifier was set to a gain of 1, this deviation corresponds to only 1 b, or LSB. In other words, the 12-b ADC toggled between binary values 0 and 1. If this test yields large amount of noise, your DAQ board is not operating properly, or another plug-in board in the PC may be radiating noise onto the DAQ board. Try removing other PC boards to see if the noise level decreases.

2. Attach your signal wires to the DAQ board. At your signal source or signal conditioning unit, ground or short the input leads. Acquire and plot a number of readings as in step 1. If the observed noise levels are roughly the same as those with the actual signal source instead of the short in place, the cabling and/or the environment in which the cabling is run is the culprit. You may need to try relocating your cabling farther from potential noise sources. If the noise source is not known, spectral analysis can help identify the source of the noise.

3. If the noise level in step 2 is less than with the actual signal source, replace the short with a resistor approximately equal to the output impedance of the signal source. This setup will show whether capacitive coupling in the cable due to high impedance is the problem. If the observed noise level is still less than with the actual signal source, then cabling and the environment can be dismissed as the problem. In this case, the culprit is either the signal source itself, or improper grounding configuration.

Noise Removal Strategies

After you have optimized your cabling and hardware setup, you may still need additional techniques to reduce noise that is unavoidable with proper cabling and grounding.

Signal Amplification

If you must pass very low-level signals through long signal leads, you will want to consider amplifying the signals near the source. An amplifying signal conditioner could boost the signal level before it is subject to the noise corruption of the environment. The same amount of noise will be radiated onto the signal, but will have a much smaller effect on the high-level signal.

image

image

Averaging

A very powerful technique for making low-noise measurements of static, or DC, signals is data averaging. For example, suppose you were monitoring the output of a thermocouple in an environment known to contain high amounts of 60-Hz power line noise. For each required temperature reading, therefore, you collect 100 readings over a time period of i /60 s, where i is some integer, and average the 100 data readings. Because the data were collected over an integer number of 60-Hz power cycles, the averaging of the data will average out any 60 Hz noise to zero. For 50-Hz power noise, collect the readings over a time period equal to i /50 s. This averaging has the same filtering effect as the integrating voltmeter.

Filtering

Of course, one method of removing noise from a electrical signal is with a hardware filter. There are a couple of options. First, you can use commercial signal conditioners that implement low-pass filters. Or, for simple filtering needs (moderate amounts of noise), you might consider building a simple RC filter on the input of your DAQ board. Figure 18.47 shows a single-pole RC filter that you could easily build and would attenuate signals with a frequency higher than the cutoff frequency Fc . Fc will be equal to

image

Grounding

Another very common source of problems in DAQ systems is grounding. In fact, noisy measurement problems are often due to improper grounding of the measurement circuit. You can avoid most grounding problems with the following steps before you configure your DAQ system:

1. Determine your signal source type—grounded or floating.

2. Identify and use the proper input measurement mode––nonreferenced (differential or nonreferenced single ended) or ground referenced (single ended).

3. If using a differential measurement system with a floating signal source, provide a ground reference for the signal.

Grounded and Floating Signal Sources

Signal sources can be grouped into two types, grounded or floating. A grounded source is one in which the voltage signal is referenced to the building system ground. Because they are connected to the building ground, they share a common ground with the DAQ board. The most common examples of a grounded source are devices that plug into the building ground, such as signal generators and power supplies.

A floating source is a source in which the voltage signal is not referred to an absolute reference, such as Earth or building ground. Some common examples of floating signal sources are batteries, battery-powered signal sources, thermocouples, transformers, isolation amplifiers, and any instrument that explicitly floats its output signal. Notice that neither terminal of the source is referred to the electrical outlet ground. Thus, each terminal is independent of Earth.

Types of Measurement Inputs

In general, with regards to ground-referencing of the inputs, there are three types of measurement systems. Following is a description of each type.

Differential Inputs

A differential, or nonreferenced, measurement system has neither of its inputs tied to a fixed reference such as Earth or building ground. DAQ boards with instrumentation amplifiers can be configured as differential measurement systems.

An ideal differential measurement system responds only to the potential difference between its two terminals, the (+) and (−) inputs. Any voltage measured with respect to the instrumentation amplifier ground present at both amplifier inputs is referred to as a common-mode voltage. The term common-mode voltage range measures the ability of a DAQ board in differential mode to reject the common-mode voltage signal.

Ground-Referenced Inputs

A grounded or ground-referenced measurement system is similar to a grounded source, in that the measurement is made with respect to ground. This is also referred to as a ground-referenced single-ended (GRSE) measurement system.

Nonreferenced Single-Ended Inputs

A variant of the single-ended measurement technique, known as nonreferenced single-ended (NRSE) measurement system, is often found in DAQ boards. In an NRSE measurement system, all measurements are still made with respect to a single-node analog sense, but the potential at this node can vary with respect to the measurement system ground.

Now that we have identified the different types of signal sources and measurement systems, we can discuss the proper measurement system for each type of signal source.

Measuring Grounded Signal Sources, Avoiding Loops

A grounded signal source is best measured with a differential or NRSE measurement system. With this configuration, the measured voltage Vm is the sum of the signal voltage Vs and the potential difference ΛVg that exists between the signal source ground and the measurement system ground. This potential difference is generally not a DC level; thus, the result is a noisy measurement system often showing power- line frequency (50 or 60 Hz) components in the readings. Ground-loop introduced noise may have both AC and DC components, thus introducing offset errors as well as noise in the measurements. The potential

difference between the two grounds causes a current to flow in the interconnection. This current is called ground-loop current.

The preferable input mode for a grounded signal is differential or NRSE mode. With either of these configurations, any potential difference between references of the source and the measuring device appears as common-mode voltage to the measurement system and is subtracted from the measured signal.

Measuring Floating Signals

You can use differential or single-ended inputs to measure a floating signal source. With a ground- referenced input, the DAQ board provides the one ground reference. When using differential inputs to measure signals that are not ground referenced, however, you must explicitly provide a ground reference to make accurate measurements. The differential input can be referenced by simple grounding of the (−) lead of the signal input. Alternatively, resistors can be connected from each signal lead to ground. This configuration maintains a balanced input and may be desirable for high-impedance signal sources. Many signal conditioning accessories include provisions for installing these resistors or direct connections to ground. Figure 18.48 summarizes the analog input connections.

Basic Signal Conditioning Functions

In general, signal conditioners exist to interface raw signals from transducers to a general-purpose measurement device, such as a plug-in DAQ board, while simultaneously boosting the quality and reliability of the measurement. To accomplish this goal, signal conditioners perform a number of functions, including the following.

Signal Amplification

Many transducers output very small voltages that can be difficult to measure accurately. For example, a J- type thermocouple signal varies only about 50 µV/◦C over most of its range. Most signal conditioners, there-fore, include amplifiers to boost the signal level to better match the input range of the analog-to-digital converter and improve resolution and sensitivity. Although many DAQ boards and I/O devices include onboard amplifiers for this reason, it may be necessary to locate an additional signal conditioner with amplification near the source of low-level signals, such as thermocouples, to increase their immunity to electrical noise from the environment. Otherwise, any small amount of noise picked up on lead wires can corrupt your data.

Filtering

Additionally, signal conditioners can include filters to reject unwanted noise within a certain frequency range. For example, most conditioners include low-pass filters to reduce high-frequency noise, such as the very common 60- or 50-Hz periodic noise from power systems or machinery. Some signal conditioners that are used for more dynamic measurements, such as vibration monitoring, include special antialiasing that feature programmable bandwidth (variable according to the sampling rate) and very sharp filter rolloff.

Isolation

One of the most common cause of measurement problems, noise, and damaged I/O equipment is improper grounding of the system. These nagging problems tend to disappear when isolated signal conditioners are introduced into the measurement system. Isolated conditioners pass the signal from its source to the mea- surement device without a galvanic or physical connection. Besides breaking ground loops, isolation blocks high-voltage surges and rejects high common-mode voltage, protecting expensive DAQ instrumentation. For example, suppose you are to monitor the temperature of an extrusion process. Although you are using thermocouples with output signals of 0 and 50 mV, the thermocouples are soldered to the extruder. The extruder machines are powered by a dedicated power system and your thermocouple leads are actually sitting at 50 V. Connecting the thermocouple leads directly to nonisolated DAQ board would probably damage the board. However, you can connect the thermocouple leads to an isolated signal, which rejects the common-mode voltage (50 V), safely passing the differential 50-mV differential signal on the DAQ board for measurement.

image

A common method for circuit isolation is using optical, capacitive, or transformer isolators. Capacitive and transformer isolators modulate the signal to convert it from a voltage to a frequency value. The frequency signal is then coupled across capacitors or a transformer, where it is then converted back to the proper voltage value. Optical isolators, commonly used for digital signals, use LEDs to convert the voltage on/off information into light signals to couple the signal across the isolation barrier.

Transducer Excitation and Interfacing

Many types of sensors and transducers have particular signal conditioning requirements. For example, thermocouples require cold-junction compensation for the thermoelectric voltages created where the thermocouple wires are connected to the data acquisition equipment. Resistive temperature devices (RTDs) require an accurate current excitation source to convert their small changes in electrical resistance into measurable changes in voltage. To avoid errors caused by the resistance in the lead wires, RTDs are often used in a 4-wire configuration. The 4-wire RTD measurement avoids lead resistance errors because two additional leads carry current to the RTD device, so that current does not flow in the sense, or measurement. Strain gauge transducers, on the other hand, are used in a Wheatstone bridge configuration with a constant voltage or current power source. The signal conditioning requirements for these and other common transducers are listed in Table 18.2.

Linearization

Most sensors exhibit an output that is nonlinear with respect to the measurand. Therefore, many signal conditioners include circuitry or onboard intelligence to linearize the transfer function of the sensor. This onboard linearization is designed to offload some of the processing requirements of the DAQ system. With the increased use of PCs, however, this need is diminished and you can easily perform this linearization function in software. Unlike hardware linearization, software linearization is a very flexible solution, making it possible for a single signal conditioning module to be easily adapted via software for a wide variety of sensors. In fact, you can even implement your own customized transducer linearization routines if necessary.

Variety of Signal Conditioning Architectures

Signal conditioning systems come in all different forms, ranging from single-channel I/O modules to multichannel chassis-based systems with sophisticated signal routing capabilities. In addition, several products commonly classified as signal conditioners include an onboard ADC with digital communications interface. Here, we will concentrate on nondigitizing conditioning systems used as a front-end for data acquisition and control systems, such as plug-in DAQ boards.

The typical single-channel I/O module is a fixed-function conditioner designed for a particular type of transducer and signal range. You cable the conditioned output signal, usually a voltage signal, directly to a DAQ board input channel. Some modules are DIN rail-mountable, whereas others install into a backplane that holds 8–16 modules. Newer versions of the single-channel modules feature programmability and added intelligence for scaling and diagnostics. Because the modules do not incorporate signal multiplexing, they are best suited for applications with fewer I/O channels.

Many DAQ board vendors supply specialized signal conditioning boards for use with their DAQ boards. These signal conditioning boards, usually designed for a particular transducer type, tend to provide a less flexible system. Meanwhile, other DAQ vendors incorporate signal conditioning directly on the PC plug-in DAQ board. Although this approach can provide a low-cost system for simpler applications, the benefits of locating your high-voltage isolation barrier inside the PC are questionable. In addition, you do not have the option of amplifying your low-level sensor signals before they enter the potentially noisy PC.

Signal Conditioners Offer I/O Expansion

A final class of signal conditioners incorporate signal multiplexing to significantly expand the I/O capabilities of the DAQ system. These systems consist of a chassis that houses a variety of signal conditioning modules. Instead of simply passing the conditioned signals to an outgoing connector, each module multiplexes the conditioned signals onto a single analog output channel. You can cable the multiplexed output directly to a DAQ board or pass it to the chassis backplane bus. This backplane bus routes the conditioned analog signals, as well as digital communications and timing control signals, among the modules. Such a system is expandable; adding channels is accomplished by plugging a new multiplexing module into the backplane bus. Because the bus also incorporates a digital communications path, you can also incorporate digital I/O and analog output modules into the same chassis.

The multiplexing architecture of these signal conditioning systems is especially well suited for applica- tions involving larger numbers of channels. For example, some systems can multiplex 3072 channels into a single PC plug-in DAQ board. More importantly, these multiplexing signal conditioners offer significant advantages in cost and physical space requirements. By switching multiple inputs into a single processing block, including amplification, filtering, isolation, and ADC, you can achieve a very low cost per channel not attainable with single-channel modules. Even though single-channel modules are being developed that are smaller and slimmer, systems with a multiplexing architecture will always be able to pack many more I/O channels into a given physical space.

Defining Terms

Alias: A false lower frequency component that appears in sampled data acquired at too low a sampling rate.

Conversion time: The time required, in an analog input or output system, from the moment a channel is interrogated (such as with a read instruction) to the moment that accurate data are available.

Data acquisition (DAQ): (1) Collecting and measuring electrical signals from sensors, transducers, and test probes or fixtures and inputting them to a computer for processing. (2) Collecting and measuring the same kinds of electrical signals with A/D and/or DIO boards plugged into a PC, and possibly generating control signals with D/A and/or DIO boards in the same PC.

Differential nonlinearity (DNL): A measure in LSB of the worst-case deviation of code widths from their ideal value of 1 LSB.

Integral nonlinearity (INL): A measure in LSB of the worst-case deviation from the ideal A/D or D/A transfer characteristic of the analog I/O circuitry.

Nyquist sampling theorem: A law of sampling theory stating that if a continuous bandwidth-limited signal contains no frequency components higher than half the frequency at which it is sampled, then the original signal can be recovered without distortion.

Relative accuracy: A measure in LSB of the accuracy of an ADC. It includes all nonlinearity and quantization errors. It does not include offset and gain errors of the circuitry feeding the ADC.

References

House, R. 1993. Understanding important DA specifications. Sensors 10(6):11–16.

House, R. 1994. Understanding inaccuracies due to settling time, linearity, and noise. National Instruments European User Symposium Proceedings, Nov. 10–11:17–26.

McConnell, E. 1994. PC-based data acquisition users face numerous challenges. ECN 38(8):11–12.

McConnell, E. 1995. Choosing a data-acquisition method. Electronic Design 43(13):147–156.

Potter, D. and Razdan, A. 1994. Fundamentals of PC-based data acquisition. Sensors 11(2).

Potter, D. 1994. Sensor to PC—Avoiding some common pitfalls. Sensors Expo Proceedings, Sept. 20:12–20.

Potter, D. 1995. Signal conditioners expand DAQ system capabilities. I&CS 68(8).

Further Information

Johnson, G.W. 1994. LabVIEW Graphical Programming. McGraw-Hill, New York.

McConnell, E. 1994. New achievements in counter/timer data acquisition technology. MessComp 1994 Proceedings, Sept. 13–15.

McConnell, E. 1995. Equivalent time sampling extends DA performance. Sensors 12(6).


Equivalent-Time Sampling : ETS Counter/Timer Operations , Hardware Analog Triggering , Factors Influencing the Accuracy of Your Measurements , Relative Accuracy , Integral Nonlinearity and Settling Time .

Equivalent-Time Sampling

If real-time sampling techniques are not fast enough to digitize the signal, then consider ETS as an approach. Unlike continuous, interval, or multirate scanning, complex counter/timers control ETS conversions, and ETS strictly requires that the input waveform be repetitive throughout the entire sampling period.

In ETS mode, an analog trigger arms a counter, which triggers an ADC conversion at progressively increasing time intervals beyond the occurrence of the analog trigger (as shown in Fig. 18.38). Instead of acquiring samples in rapid succession, the ADC digitizes only one sample per cycle. Samples from several cycles of the input waveform are then used to recreate the shape of the signal.

ETS Counter/Timer Operations

Four complex timing and triggering mechanisms are necessary for ETS. They include hardware analog triggering, retriggerable pulse generation, autoincrementing, and flexible data acquisition signal routing.

Hardware Analog Triggering

Analog trigger circuitry monitors the input voltage of the waveform and generates a pulse whenever the trigger conditions are met. Each time the repetitive waveform crosses the trigger level, the analog trigger circuitry arms the board for another acquisition.

image

Retriggerable Pulse Generation

The ADC samples when it receives a pulse for the conversion counter. In real-time sampling, the conversion counter generates a series of continuous pulses that cause the ADC to successively digitize multiple values. In ETS, however, the conversion counter generates only one pulse, which corresponds to one sample from one cycle of the waveform. This pulse is regenerated in response to a signal from the analog trigger circuitry, which occurs after each new cycle of the waveform.

Autoincrementing

If the ADC sampled every occurrence of the waveform using only retriggerable pulse generation, the same point along the repetitive signal would be digitized, namely, the point corresponding to the analog trigger. A method is needed to make the ADC sample different points along different cycles of the waveform. This method, known as autoincrementing, is the most important counter/timer functional for controlling ETS. An autoincrementing counter produces a series of delayed pulses.

Flexible Data Acquisition Signal Routing

As with seamlessly changing the sample rate, ETS uses signals from other parts of the board to control ADC conversions. The DAQ-STC generates autoincrementing retriggerable pulses.

Figure 18.39 details the timing signals used for ETS. As the input waveform crosses the trigger voltage 1, the analog trigger circuitry generates a pulse at the gate input of the autoincrementing counter. This counter generates a conversion pulse 2, which is used to trigger the ADC to take a sample 3. The timing process continues until a predetermined number of samples has been acquired. The delay time Dt is directly related to the relative sampling rate set. For example, for an effective sampling rate of 20 MS/s, Dt is equal to 50 ns. Because the waveform is repetitive over the complete acquisition, the points in the recreated waveform appear as if they were taken every 50 ns.

Considerations When Using ETS

Although ETS is useful in a number of applications, ETS users need to be aware of a few issues. First, the input waveform must be repetitive. ETS will not correctly reproduce a waveform that is nonrepetitive because the analog trigger will never occur at the same place along the waveform. One-shot acquisitions are not possible, because ETS digitizes a sample from several cycles of a repetitive waveform.

The accuracy of the conversion is limited to the accuracy of the counter/timer. Jitter in the counter/timer causes the sample to be taken within a multiple of 50 ns from the trigger. The sample may occur along a

image

slightly different portion of the input waveform than expected. For example, using a 12-b board to sample the 100-Hz, 10-V peak-to-peak sine wave in Fig. 18.31, the accuracy error is 0.13 LSB.

imageETS Application Examples

ETS techniques are useful in measuring the rise and fall times of TTL signals. ETS is also used to measure the impulse response of a 1-MHz, low-pass filter subject to a 2-ms repetitive impulse. The impulse response is a repetitive signal of pulses that also have a duration of 2 ms. Using a 20-MHz ETS conversion rate results in 40 digitized samples per input impulse. This is enough samples to display the impulse response in the time domain. Other applications for ETS include disk drive testing, nondestructive testing, ultrasonic testing, vibration analysis, laser diode characterization, and impact testing.

Factors Influencing the Accuracy of Your Measurements

How do you tell if the plug-in data acquisition board that you already have or the board that you are considering integrating into your system will give you the results you want? With a sophisticated measuring device like a plug-in DAQ board, you can obtain significantly different accuracies depending on which board you are using. For example, you can purchase DAQ products on the market today with 16-b analog to digital converters and get less than 12 b of useful data, or you can purchase a product with a 16-b ADC and actually get 16 b of useful data. This difference in accuracies causes confusion in the PC industry where everyone is used to switching out PCs, video cards, printers, and so on, and experiencing similar results between equipment.

The most important thing to do is to scrutinize more specifications than the resolution of the A/D converter that is used on the DAQ board. For DC-class measurements, you should at least consider the settling time of the instrumentation amplifier, differential non-linearity (DNL), relative accuracy, integral nonlinearity (INL), and noise. If the manufacturer of the board you are considering does not supply you with each of these specifications in the data sheets, you can ask the vendor to provide them or you can run tests yourself to determine these specifications of your DAQ board.

Linearity

Ideally, as you increase the level of voltage applied to a DAQ board, the digital codes from the ADC should also increase linearly. If you were to plot the voltage vs. the output code from an ideal ADC, the plot would be a straight line. Deviations from this ideal straight line are specified as the nonlinearity. Three specifications indicate how linear a DAQ boards transfer function is: differential nonlinearity, relative accuracy, and integral nonlinearity.

Differential Nonlinearity

For each digital output code, there is a continuous range of analog input values that produce it. This range is bounded on either side by transitions. The size of this range is known as the code width. Ideally, the width of all binary code values is identical and is equal to the smallest detectable voltage change,

image

where n is the resolution of the ADC. For example, a board that has a 12-b ADC, input range of 0–10, and a gain of 100 will have an ideal code width of

image

This ideal analog code width defines the analog unit called the least significant bit. DNL is a measure in LSB of the worst-case deviation of code widths from their ideal value of 1 LSB. An ideal DAQ board has a DNL of 0 LSB. Practically, a good DAQ board will have a DNL within ±0.5 LSB.

image

There is no upper limit on how wide a code can be. Codes do not have widths of less than 0 LSB, so the DNL is never worse than −1 LSB. A poorly performing DAQ board may have a code width equal to or very near zero, which indicates a missing code. No matter what voltage you input to the DAQ board with a missing code, the board will never quantize the voltage to the value represented by this code. Sometimes DNL is specified by stating that a DAQ board has no missing codes, which means that the DNL is bounded below by −1 LSB but does not make any specifications about the upper bound.

If the DAQ board in the previous example had a missing code at 120 µV, then increasing the voltage from 96 to 120 µV would not be detectable. Only when the voltage is increased another LSB, or in this example, 24 µV, will the voltage change be detectable (Fig. 18.40). As you can see, poor DNL reduces the resolution of the board.

To run your own DNL test:

1. Input a high-resolution, highly linear triangle wave into one channel of the DAQ board. The frequency of the triangle should be low and the amplitude should swing from minus full scale to plus full scale of the input to the DAQ board.

2. Start an acquisition on the plug-in board so that you acquire a large number of points. Recom- mended values are 1 × 10⁶ samples for a 12-b board and 20 × 106 million samples for a 16-b board.

3. Make a histogram of all the acquired binary codes. This will give you the relative frequency of each code occurrence.

4. Normalize the histogram by dividing by the averaged value of the histogram.

5. The DNL is the greatest deviation from the value of 1 LSB. Because the input was a triangle wave, it had a uniform distribution over the DAQ board codes. The probability of a code occurring is directly proportional to the code width, and therefore shows the DNL.

Figure 18.41 shows a section of the DNL plot of two products with the same 16-b ADC yet significantly different DNL. Ideally, the codewidth plot will be a straight line at 1 LSB. Figure 18.41(a) shows the codewidth plot of a product that has DNL of less than ±0.5 LSB. Because the codewidth is never 0, the product also has no missing codes. Figure 18.41(b) shows the codewidth plot of a product that has poor DNL. This product has many missing codes, a code width that is as much as 4.2 LSB at the code value 0, and is clearly not 16-b linear.

Relative Accuracy

Relative accuracy is a measure in LSBs of the worst-case deviation from the ideal DAQ board transfer function, a straight line. To run your own relative accuracy test:

1. Connect a high-accuracy analog voltage-generation source to one channel of the DAQ board. The source should be very linear and have a higher resolution than the DAQ board that you wish to test.

image

2. Generate a voltage that is near minus full scale.

3. Acquire at least 100 samples from the DAQ board and average them. The reason for averaging is to reduce the effects of any noise that is present.

4. Increase the voltage slightly and repeat step 3. Continue steps 3 and 4 until you have swept through the input range of the DAQ board.

5. Plot the averaged points on the computer. You will have a straight line, as shown in Fig. 18.42(a), unless the relative accuracy of your DAQ board is astonishingly bad.

6. To see the deviation from a straight line, you must first generate an actual straight line in software that starts at the minus full-scale reading and ends at the plus full-scale reading using a straight-line endpoint fit analysis routine.

7. Subtract the actual straight line from the waveform that you acquired. If you plot the resulting array, you should see a plot similar to Fig. 18.42(b).

8. The maximum deviation from zero is the relative accuracy of the DAQ board.

image

The driver software for a DAQ board will translate the binary code value of the ADC to voltage by multiplying by a constant. Good relative accuracy is important for a DAQ board because it ensures that the translation from the binary code of the ADC to the voltage value is accurate. Obtaining good relative accuracy requires that both the ADC and the surrounding analog support circuitry be designed properly.

Integral Nonlinearity

INL is a measure in LSB of the straightness of a DAQ board’s transfer function. Specifically, it indicates how far a plot of the DAQ boards transitions deviates from a straight line. Factors that contribute to poor INL on a DAQ board are the ADC, multiplexer, and instrumentation amplifier. The INL test is the most difficult to make:

1. Input a signal from a digital to analog converter that has higher resolution and linearity than the DAQ board that you are testing.

2. Starting at minus full scale, increase the codes to the DAC until the binary reading from the ADC flickers between two consecutive values. When the binary reading flickers evenly between codes, you have found the LSB transition for the DAQ board.

3. Record the DAC codes of all transitions.

4. Using an analysis routine, make an endpoint fit on the recorded DAC codes.

5. Subtract the endpoint fit line from the recorded DAC values.

6. The farthest deviation from zero is the INL.

Even though highly specified, the INL specification does not have as much value as the relative accuracy specification and is much more difficult to make. The relative accuracy specification is showing the deviation from the ideal straight line whereas the INL is showing the deviation of the transitions from an ideal straight line. Therefore, relative accuracy takes the quantization error, INL, and DNL into consideration.

Settling Time

On a typical plug-in DAQ board, an analog signal is first selected by a multiplexer, and then amplified by an instrumentation amplifier before it is converted to a digital signal by the ADC. This instrumentation amplifier must be able to track the output of the multiplexer as the multiplexer switches channels, and the instrumentation amplifier must be able to settle to the accuracy of the ADC. Otherwise, the ADC will convert an analog signal that has not settled to the value that you are trying to measure with your DAQ board. The time required for the instrumentation amplifier to settle to a specified accuracy is called the settling time. Poor settling time is a major problem because the amount of inaccuracy usually varies with gain and sampling rate. Because the errors occur in the analog stages of the DAQ board, the board cannot return an error message to the computer when the instrumentation amplifier does not settle.

The instrumentation amplifier is most likely not to settle when you are sampling multiple channels at high gains and high rates. When the application is sampling multiple channels, the multiplexer is switching among different channels that can have significant differences in voltage levels (Fig. 18.43). Instrumentation amplifiers can have difficulty tracking this significant difference in voltage. Typically, the higher the gain and the faster the channel switching time, the less likely it is that the instrumentation amplifier will settle. It is important to be aware of settling time problems so you know at what multichannel rates and gains you can run your DAQ board and maintain accurate readings. Running your own settling time test is relatively easy:

1. Apply a signal to one channel of your DAQ board that is nearly full scale. Be sure to take the range and gain into account when you select the levels of the signal you will apply. For example, if you are using a gain of 100 on a ±10 V input range on the DAQ board, apply a signal slightly less than 10 V/100 or +0.1-V signal to the channel.

2. Acquire at least 1000 samples from one channel only and average them. The averaged value will be the expected value of the DAQ board when the instrumentation amplifier settles properly.

3. Apply a minus full-scale signal to a second channel. Be sure to take range and gain into account, as described earlier.

image

4. Acquire at least 1000 samples from the second channel only and average them. This will give you the expected value for the second channel when the instrumentation amplifier settles properly.

5. Have the DAQ board sample both channels at the highest possible sampling rate so that the multiplexer is switching between the first and the second channels.

6. Average at least 100 samples from each channel.

7. The deviation between the values returned from the board when you sampled the channels using a single channel acquisition and the values returned when you sampled the channels using a multichannel acquisition will be the settling time error.

To plot the settling time error, repeat steps 5 and 6, but reduce the sampling rate each time. Then plot the greatest deviation at each sampling rate. A DAQ board settles to the accuracy of the ADC only when the settling time error is less than ±0.5 LSB. By plotting the settling time error, you can determine at what rate you can sample with your DAQ board and settle to the accuracy that your application requires. The settling-time plot will usually vary with gain and so you will want to repeat the test at different gains.

Figure 18.44 shows an example of two DAQ boards that have a 12-b resolution ADC, yet have significantly different settling times. For the tests, both boards were sampling two channels with a gain of 100. The settling-time plot for the first board, shown in Fig. 18.44(a), uses an off-the-shelf instrumentation amplifier, which has 34 LSBs of settling-time error when sampling at 100 kHz. Because the board was using an input range of 20 V at a gain of 100, 1 LSB = 48.8 µV. Therefore, data are inaccurate by as much as 1.7 mV due

image

to settling-time when the board is sampling at 100 kHz at a gain of 100. If you use this board you must either increase the sampling period to greater than 20 µs so that the board can settle, or be able to accept the settling-time inaccuracy. The settling-time plot for the second board, shown in Fig. 18.44(b), settles properly because it uses a custom instrumentation amplifier designed specifically to settle in DAQ board applications. Because the board settles to within ±0.5 LSB at the maximum sampling rate, you can run the board at all sampling rates and not have any detectable settling-time error.

Applications that are sampling only one channel, applications that are sampling multiple channels at very slow rates, or applications that are sampling multiple channels at low gains usually do not have a problem with settling time. For the other applications, your best solution is to purchase a DAQ board that will settle at all rates and all gains. Otherwise, you will have to either reduce your sampling rate or realize that your readings are not accurate to the specified value of the ADC.

Noise

Noise is any unwanted signal that appears in the digitized signal of the DAQ board. Because the PC is a noisy digital environment, acquiring data on a plug-in board takes a very careful layout on multilayer DAQ boards by skilled analog designers. Designers can use metal shielding on a DAQ board to help reduce noise. Proper shielding should not only be added around sensitive analog sections on a DAQ board, but must also be built into the DAQ board with ground planes.

Of all of the tests to run, a DC-class signal noise test is the easiest to run:

1. Connect the + and − inputs of the DAQ board directly to ground. If possible, make the connection directly on the I/O connector of the board. By doing this, you can measure only the noise introduced by the DAQ board instead of noise introduced by your cabling.

2. Acquire a large number of points (1 × 10⁶) with the DAQ board at the gain you choose in your application.

3. Make a histogram of the data and normalize the array of samples by dividing by the total number of points acquired.

4. Plot the normalized array.

5. The deviation, in LSB, from the highest probability of occurrence is the noise.

Figure 18.45 shows the DC-noise plot of two DAQ products, both of which use the same ADC. You can determine two qualities of the DAQ board from the noise plots—range of noise and the distribution.

image

The plot in Fig. 18.45(a) has a high distribution of samples at 0 and a very small number of points occurring at other codes. The distribution is Gaussian, which is what is expected from random noise. From the plot, the noise level is within ±3 LSB. The plot in Fig. 18.45(b) is a very noisy DAQ product, which does not have the expected distribution and has a noise greater than ±20 LSB, with many samples occurring at points other than the expected value. For the DAQ product in Fig. 18.45(b), the tests were run with an input range of ±10 V and a gain of 10. Therefore, 1 LSB = 31 µV, thus a noise level of 20 LSB is equivalent to 620 µV of noise.


Data Acquisition Software , Board Register-Level Programming , Driver Software , Real-Time Sampling Techniques , Preventing Aliasing , Software Polling , External Sampling , Continuous Scanning , Multirate Scanning , Simultaneous Sampling , Interval Scanning and Seamless Changing of the Sampling Rate .

Data Acquisition Software

The software is often the most critical component of the data acquisition system. Properly chosen software can save you a great deal of time and money. Likewise, poorly chosen software can cost you time and money. A whole spectrum of software options exists, with important tradeoffs and advantages.

Board Register-Level Programming

The first option is not to use vendor-supplied software and program the DAQ board yourself at the hardware level. DAQ boards are typically register based, that is, they include a number of digital registers that control the operation of the board. The developer may use any standard programming language to write series of binary codes to the DAQ board to control its operation.

Driver Software

clip_image001Driver software typically consists of a library of function calls usable from a standard programming language. These function calls provide a high-level interface to control the standard functions of the plug- in board. For example, a function called SCAN OP may configure, initiate, and complete a multiple channel scanning data acquisition operation of a predetermined number of points. The function call would include parameters to indicate the channels to be scanned, the amplifier gains to be used, the sampling rate, and the total number of data points to collect. The driver responds to this one function call by programming the plug-in board, the DMA controller, the interrupt controller, and CPU to scan the channels as requested.

Digital Sampling

Every DAQ system has the task of gathering information about analog signals. To do this, the system captures a series of instantaneous snapshots or samples of the signal at definite time intervals. Each sample contains information about the signal at a specific instant. Knowing the exact conversion time and the value of the sample, you can reconstruct, analyze, and display the digitized waveform.

Two classifications of sample timing techniques are used to control the ADC conversions, real-time sampling and equivalent-time sampling (ETS). Depending on the type of signal you acquire and the rate of acquisition, one sampling technique may be better than the other.

Real-Time Sampling Techniques

In real-time sampling, you immediately see the changes, as the signal changes (Fig. 18.27). According to the Nyquist theorem, you must sample at least twice the rate of the maximum frequency component in that signal to prevent aliasing. The frequency at one-half the sampling frequency is referred to as the Nyquist frequency. Theoretically, it is possible to recover information about those signals with frequencies at or below the Nyquist frequency. Frequencies above the Nyquist frequency will alias to appear between DC and the Nyquist frequency.

image

For example, assume the sampling frequency f s, is 100 Hz. Also assume the input signal to be sampled contains the following frequencies: 25, 70, 160, and 510 Hz. Figure 18.28 shows a spectral representation of the input signal. The mathematics of sampling theory show us that a sampled signal is shifted in the frequency domain by an amount equal to integer multiples of the sampling frequency, f s.

Figure 18.29 shows the spectral content of the input signal after sampling. Frequencies below 50 Hz, the NYQUIST FREQUENCY SAMPLING FREQUENCY Nyquist frequency ( f s/2), appear correctly. How ever, frequencies above the Nyquist appear as aliases below the Nyquist frequency. For example, F1 appears correctly; however, both F2, F3, and F4 have aliases at 30, 40, and 10 Hz, respectively.

The resulting frequency of aliased signals can be calculated with the following formula:

image

Preventing Aliasing

You can prevent aliasing by using filters on the front end of your DAQ system. These antialiasing filters are set to cut off any frequencies above the Nyquist frequency (half the sampling rate). The perfect filter would reject all frequencies above the Nyquist; how ever, because perfect filters exist only in textbooks, you must compromise between sampling rate and selecting filters. In many applications, one- or two pole passive filters are satisfactory. By oversampling (5–10 times) and using these filters, you can sample adequately in most cases.

image

Alternatively, you can use active antialiasing filters with programmable cutoff frequencies and very sharp attenuation of frequencies above the cutoff.

Because these filters exhibit a very steep rolloff, you can sample at two to three times the filter cutoff frequency. Figure 18.30 shows a transfer function of a high-quality antialiasing filter.

The computer uses digital values to recreate or to analyze the waveform. Because the signal could be anything between each sample, the DAQ board may be unaware of any changes in the signal between samples. There are several sampling methods optimized for the different classes of data; they include software polling, external sampling, continuous scanning, multirate scanning, simultaneous sampling, interval scanning, and seamless changing of the sample rate.

Software Polling

A software loop polls a timing signal and starts the ADC conversion via a software command when the edge of the timing signal is detected. The timing signal may originate from the computer’s internal clock or from a clock on the DAQ board. Software polling is useful in simple, low-speed applications, such as temperature measurements.

image

The software loop must be fast enough to detect the timing signal and trigger a conversion. Otherwise, a window of uncertainty, also known as jitter, will exist between two successive samples. Within the window of uncertainty, the input waveform could change enough to drastically reduce the accuracy of the ADC.

Suppose a 100-Hz, 10-V full-scale sine wave is digitized (Fig. 18.31). If the polling loop takes 5 ms to detect the timing signal and to trigger a conversion, then the voltage of the input sine wave will change as much as 31 mV (ΛV − 10 sin(2π × 100 × 5 × 10−6)). For a 12-b ADC operating over an input range of 10 V and a gain of 1, 1 least significant bit (LSB) of error represents 2.44 mV

image

External Sampling

Some DAQ applications must perform a conversion based on another physical event that triggers the data conversion. The event could be a pulse from an optical encoder measuring the rotation of a cylinder. A sample would be taken every time the encoder generates a pulse corresponding to n degrees of rotation. External triggering is advantageous when trying to measure signals whose occurrence is relative to another physical phenomena.

image

image

Continuous Scanning

When a DAQ board acquires data, several components on the board convert the analog signal to a digital value. These components include the analog multiplexer (mux), the instrumentation amplifier, the sample- and-hold circuitry, and the ADC. When acquiring data from several input channels, the analog mux connects each signal to the ADC at a constant rate. This method, known as continuous scanning, is significantly less expensive than having a separate amplifier and ADC for each input channel.

Continuous scanning is advantageous because it eliminates jitter and is easy to implement. However, it is not possible to simultaneously sample multiple channels. Because the mux switches between channels, a time skew occurs between any two successive channel samples. Continuous scanning is appropriate for applications where the time relationship between each sampled point is unimportant or where the skew is relatively negligible compared to the speed of the channel scan.

If you are using samples from two signals to generate a third value, then continuous scanning can lead to significant errors if the time skew is large. In Fig. 18.32, two channels are continuously sampled and added together to produce a third value. Because the two sine waves are 90◦ out of phase, the sum of the signals should always be zero. But because the skew time between the samples, an erroneous sawtooth signal results.

Multirate Scanning

Multirate scanning, a method that scans multiple channels at different scan rates, is a special case of continuous scanning. Applications that digitize multiple signals with a variety of frequencies use multirate scanning to minimize the amount of buffer space needed to store the sampled signals. You can use channel-independent ADCs to implement hardware multirate scanning; however, this method is extremely expensive. Instead of multiple ADCs, only one ADC is used. A channel/gain configuration register stores the scan rate per channel and software divides down the scan clock based on the per-channel scan rate. Software-controlled multirate scanning works by sampling each input channel at a rate that is a fraction of the specified scan rate.

Suppose you want to scan channels 0–3 at 10 kilosamples/sec, channel 4 at 5 kilosamples/sec, and channels 5–7 at 1 kilosamples/sec. You should choose a base scan rate of 10 kilosamples/sec. Channels 0–3 are acquired at the base scan rate. Software and hardware divide the base scan rate by 2 to sample channel 4 at 5 kilosamples/sec, and by 10 to sample channels 5–7 at 1 kilosamples/sec.

Simultaneous Sampling

For applications where the time relationship between the input signals is important, such as phase analysis of AC signals, you must use simultaneous sampling. DAQ boards capable of simultaneous sampling typically use independent instrumentation amplifiers and sample-and-hold circuitry for each input channel, along with an analog mux, which routes the input signals to the ADC for conversion (as shown in Fig. 18.33).

To demonstrate the need for a simultaneous- sampling DAQ board, consider a system consist- ing of four 50-kHz input signals sampled at 200 kilosamples/sec. If the DAQ board uses continuous scanning, the skew between each channel is 5 µs (1 S/200 kilosamples/sec) which represents a 270◦ (15 µs/20 µs × 360◦) shift in phase between the  first channel and fourth channel. Alternately, with a simultaneous-sampling board with a maximum 5 ns interchannel time offset, the phase shift is only 0.09◦ (5 ns/20 µs × 360◦). This phenomenon is illustrated in Fig. 18.34.

image

Interval Scanning

For low-frequency signals, interval scanning creates the effect of simultaneous sampling, yet maintains the cost benefits of a continuous scanning system. This method scans the input channels at one rate and uses a second rate to control when the next scan begins. You can scan the input channels at the fastest rate of the ADC, creating the effect of simultaneous sampling. Interval scanning is appropriate for slow moving signals, such as temperature and pressure. Interval scanning results in a jitter-free sample rate and minimal skew time between channel samples. For example, consider a DAQ system with 10 temperature signals. Using interval scanning, you can set up the DAQ board to scan all channels with an interchannel delay of 5 µs, then repeat the scan every second. This method creates the effect of simultaneously sampling 10 channels at 1 S/s, as shown in Fig. 18.35.

image

To illustrate the difference between continuous and interval scanning, consider an application that monitors the torque and revolutions per minute (RPMs) of an automobile engine and computes the engine horsepower. Two signals, proportional to torque and RPM, are easily sampled by a DAQ board at a rate of 1000 S/s. The values are multiplied together to determine the horsepower as a function of time. A continuously scanning DAQ board must sample at an aggregate rate of 2000 S/s. The time between which the torque signal is sampled and the RPM signal is sampled will always be 0.5 ms (1/2000). If either signal changes within 0.5 ms, then the calculated horsepower is incorrect. But using interval scanning at a rate of 1000 S/s, the DAQ board samples the torque signal every 1 ms, and the RPM signal is sampled as quickly as possible after the torque is sampled. If a 5-µs interchannel delay exists between the torque and RPM samples, then the time skew is reduced by 99% ((0.5 ms − 5 µs))/0.5 ms), and the chance of an incorrect calculation is reduced.

Seamless Changing of the Sampling Rate

This technique, a variation of real-time sampling, is used to vary the sampling rate of the ADC without having to stop and reprogram the counter/timer for different conversion rates. For example, you may want to start sampling slowly, and then, following a trigger, begin sampling quickly; this is particularly useful when performing transient analysis. The ADC samples slowly until the input crosses a voltage level, and then the ADC samples quickly to capture the transient.

Four complex timing and triggering mechanisms are necessary to seamlessly change the sampling rate. They include hardware analog triggering, frequency shift keying (FSK), flexible data acquisition signal routing, and buffered relative-time stamping.

Hardware Analog Triggering

A trigger level serves as the reference point at which the sampling rate changes. Analog trigger circuitry monitors the input voltage of the waveform and generates a transistor-transmitter logic (TTL) high level whenever the voltage input is greater than the trigger voltage V set; and a TTL low level when the voltage input is less than the trigger voltage. Therefore, as the waveform crosses the trigger level, the analog trigger circuitry signals the counter to count at a different frequency.

Frequency Shift Keying

Frequency shift keying (FSK) occurs when the frequency of a digital pulse varies over time. Frequency modulation (FM) in the analog domain is analogous to FSK in the digital domain. FSK determines the frequency of a generated pulse train relative to the level present at the gate of a counter. For example, when the gate signal is a TTL high level, the pulse train frequency is three times greater than the pulse train frequency when the gate signal is a TTL low level.

Flexible Data Acquisition Signal Routing

For continuous or interval scanning, a simple, dedicated sample timer directly controls ADC conversions. But for more complex sampling techniques, such as seamlessly changing the sampling rate, signals from other parts of the DAQ board control ADC conversions. The DAQ-STC ASIC provides 20 possible signal sources to time each ADC conversion. One of the sources is the output of the general-purpose counter 0, which is more flexible than a dedicated timer. In particular, the general-purpose counter generates the FSK signal that is routed to the ADC to control the sampling rate.

Buffered Relative-Time Stamping

Because different sample rates are used to acquire the signal, keeping track of the various acquisition rates is a challenge for the board and software. The sampled values must have an acquisition time associated with them in order for the signal to be correctly displayed. While values are sampled by the ADC, the DAQ-STC counter/timers measure the relative time between each sample using a technique called buffered relative- time stamping. The measured time is then transferred from the counter/timer registers to PC memory via direct memory access.

The counter continuously measures the time interval between successive, same-polarity transitions of the FSK pulse with a measurement resolution of 50 ns. Countings begin at 0. The counter contents are

image

stored in a buffer after an edge of the appropriate polarity is detected. Then, the counting begins again at 0. Software routines use DMA to transfer data from the counter to a buffer until the buffer is filled.

For example, in Fig. 18.36, the period of an FSK signal is measured. The first period is 150 ns (3 clock cycles × 50-ns resolution); the second, third, and fourth periods are 100 ns (2 clock cycles × 50 ns); the

fifth period is 150 ns. For a 10-MHz board that can change its sampling rate seamlessly, the FSK signal determines the ADC conversions; the effective sampling rate is 6.7 MHz for the first part of the signal and 10 MHz for the second part of the signal.

Figure 18.37 details the timing signals necessary to change the sampling rate of the ADC without missing data. As the input waveform crosses the trigger voltage 1 the analog trigger circuitry generates a low on its output. The output signal is routed to a general-purpose counter, which generates pulses at a predetermined frequency 2. Each high-to-low transition of the FSK signal causes the ADC to sample the waveform 3. When the input waveform crosses the trigger level again, the analog trigger circuit generates a high, which causes the general-purpose counter to generate pulses at a second frequency. This timing process continues until a predetermined number of samples has been acquired.

Considerations When Seamlessly Changing the Sampling Rate

The intention of seamlessly changing the sampling rate is to switch between rates, yet not miss significant changes in the signal. Selecting the various rates and the instance at which the rate changes requires some

image

thought. For instance, when switching between a sampling rate of 10 S/s and 20 kilosamples/sec, the analog trigger circuitry checks for a trigger condition every 1/10 of a second. This means that, at most, 0.1 s will pass before the DAQ board is aware of the trigger and increases the sampling rate to 20 kilosamples/sec. If the ADC is switching between a rate of 20 kilosamples/sec and 10 S/s, the trigger condition is checked every 50 ms, and the board will take, at most, 50 ms to switch to the 10 S/s rate. Thus, you should set the trigger condition so that you can detect the trigger and start the faster rate before the signal changes significantly.

Suppose automatic braking systems (ABS) are tested by monitoring signal transients. The test requires a few samples to be recorded before and after the transient, as well as the transient signal. The test specifies a sample rate of 400 kilosamples/sec. If the DAQ board continuously samples the system, you must sample the entire signal at 400 kilosamples/sec. For a signal that is stable for 1 min before the transient, then 24 × 106 samples are acquired before the transient even occurs. If the data are stored on disk, a large hard disk is needed. But if the stable portion of the signal is sampled more slowly, such as 40 S/s, the amount of unnecessary data acquired is reduced. If the sampling rate is changed on the fly, then the board can sample at 40 S/s before and after the transient and at 400 kilosamples/sec during the transient. In the 1 min before the transient, only 2400 samples are logged. Once the transient occurs, the board samples at 400 kilosamples/sec. Once the transient passes, the ADC begins to sample at 40 S/s again. Using this method, exactly the number of samples needed relative to the signal are logged to disk.


Data Acquisition : Fundamentals of Data Acquisition , Signals , Plug-In DAQ Boards , Types of ADCs , Analog Input Architecture , Basic Analog Specifications

Data Acquisition
Fundamentals of Data Acquisition

The fundamental task of a data acquisition system is the measurement or generation of real-world physical signals. Before a physical signal can be measured by a computer-based system, you must use a sensor or transducer to convert the physical signal into an electrical signal, such as voltage or current. Often only the plug-in data acquisition (DAQ) board is considered the data acquisition system; however, it is only one of the components in the system. Unlike stand-alone instruments, signals often cannot be directly connected to the DAQ board. The signals may need to be conditioned by some signal conditioning accessory before they are converted to digital information by the plug-in DAQ board. Finally, software controls the data acquisition system—acquiring the raw data, analyzing the data, and presenting the results. The components are shown in Fig. 18.24.

image


image

Signals

Signals are defined as any physical variable whose magnitude or variation with time contains information. Signals are measured because they contain some types of useful information. Therefore, the first question you should ask about your signal is: What information does the signal contain, and how is it conveyed? The functionality of the system is determined by the physical characteristics of the signals and the type of information conveyed by the signals. Generally, information is conveyed by a signal through one or more of the following signal parameters: state, rate, level, shape, or frequency content.

All signals are, fundamentally, analog, time-varying signals. For the purpose of discussing the methods of signal measurement using a plug-in DAQ board, a given signal should be classified as one of five signals types. Because the method of signal measurement is determined by the way the signal conveys the needed information, a classification based on these criteria is useful in understanding the fundamental building blocks of a data acquisition system.

As shown in the Fig. 18.25, any signal can generally be classified as analog or digital. A digital, or binary, signal has only two possible discrete levels of interest, a high (on) level and a low (off) level. An analog signal, on the other hand, contains information in the continuous variation of the signal with time. The two digital signal types are the on-off signals and the pulse train signal. The three analog signal types are the DC signal, the time-domain signal, and the frequency-domain signal. The two digital types and three analog types of signals are unique in the information conveyed by each. The category to which a signal belongs depends on the characteristic of the signal to be measured. You can closely parallel the five types of signals with the five basic types of signal information: state, rate, level, shape, and frequency content.

Plug-In DAQ Boards

The fundamental component of a data acquisition system is the plug-in DAQ board. These boards plug directly into a slot in a PC and are available with analog, digital, and timing inputs and outputs. The most versatile of the plug-in DAQ boards is the multifunction input/output (I/O) board. As the name implies, this board typically contains various combinations of analog-to-digital convertors (ADCs), digital-to-analog convertors (DACs), digital I/O lines, and counters/timers. ADCs and DACs measure and generate analog

image

voltage signals, respectively. The digital I/O lines sense and control digital signals. Counters/timers measure pulse rates, widths, delays, and generate timing signals. These many features make the multifunction DAQ board useful for a wide range of applications.

Multifunction boards are commonly used to measure analog signals. It is done by the ADC, which converts the analog voltage level into a digital number that the computer can interpret. The analog multiplexer (MUX), the instrumentation amplifier, the sample-and-hold (S/H) circuitry, and the ADC comprise the analog input section of a multifunction board (see Fig. 18.26).

Typically, multifunction DAQ boards have one ADC. Multiplexing is a common technique for measuring multiple channels (generally 16 single ended or 8 differential) with a single ADC. The analog mux switches between channels and passes the signal to the instrumentation amplifier and the sample-and-hold circuitry. The multiplexer architecture is the most common approach taken with plug-in DAQ boards. Although plug-in boards typically include up to only 16 single-ended or 8 differential inputs, you can further expanded the number of analog input channels with external multiplexer accessories.

Instrumentation amplifiers typically provide a differential input and selectable gain by jumper or software. The differential input rejects small common-mode voltages. The gain is often software programmable. In addition, many DAQ boards also include the capability to change the amplifier gain while scanning channels at high rates. Therefore, you can easily monitor signals with different ranges of amplitudes. The output of the amplifier is sampled, or held at a constant voltage, by the sample-and-hold device at measurement time so that voltage does not change during digitization.

The ADC digitizes the analog signal into a digital value, which is ultimately sent to computer memory. There are several important parameters of A/D conversion. The fundamental parameter of an ADC is the number of bits. The number of bits of an ADC determines the range of values for the binary output of the ADC conversion. For example, many ADCs are 12 b, so a voltage within the input range of the ADC will produce a binary value that has one of 212 = 4096 different values. The more bits that an ADC has, the higher the resolution of the measurement. The resolution determines the smallest amount of change that can be detected by the ADC. Depending on your background, you may be more familiar with resolution expressed as number of digits of a voltmeter or dynamic range in decibels, than with bits. Table 18.2 shows the relation between bits, number of digits, and dynamic range in decibels.

The resolution of the A/D conversion is also determined by the input range of the ADC and the gain.

DAQ boards usually include an instrumentation amplifier that amplifies the analog signal by a gain factor

image

prior to the conversion. You use this gain to amplify low-level signals so that you can make more accurate measurements.

Together, the input range of the ADC, the gain, and the number of bits of the board determine the maximum accuracy of the measurement. For example, suppose you are measuring a low-level ±-30 mV signal with a 12-b A/D convertor that has a ±-5 V input range. If the system includes an amplifier with a gain of 100, the resulting resolution of the measurement will be range/(gain × 2bits) = resolution, or 10 V/(100 × 212) = 0.0244 mV.

Finally, an important parameter of digitization is the rate at which A/D conversions are made, referred to as the sampling rate. The A/D system must be able to sample the input signal fast enough to accurately measure the important waveform attributes. To meet this criterion, the ADC must be able to convert the analog signal to digital form quickly enough.

When scanning multiple channels with a multiplexing data acquisition system, other factors can affect the throughput of the system. Specifically, the instrumentation amplifier must be able to settle to the needed accuracy before the A/D conversion occurs. With the multiplexed signals, multiple signals are being switched into one instrumentation amplifier. Most amplifiers, especially when amplifying the signals with larger gains, will not be able to settle to the full accuracy of the ADC when scanning channels at high rates. To avoid this situation, consult the specified settling times of the DAQ board for the gains and sampling rates required by your application.

Types of ADCs

Different DAQ boards use different types of ADCs to digitize the signal. The most popular type of ADC on plug-in DAQ boards is the successive approximation ADC, because it offers high speed and high resolution at a modest cost. Subranging (also called half-flash) ADCs offer very high-speed conversion with sampling speeds up to several million samples per second. Delta-sigma modulating ADCs sample at high rates, are able to achieve high resolution, and offer the best linearity of all ADCs. Integrating and flash ADCs are mature technologies still used on DAQ boards. Integrating ADCs are able to digitize with high resolution but must sacrifice sampling speed to obtain it. Flash ADCs are able to achieve the highest sampling rate (GHz) but typically with low resolution. The different types of ADCs are summarized in Table 18.3.

Analog Input Architecture

With the typical DAQ board, the multiplexer switches among analog input channels. The analog signal on the channel selected by the multiplexer then passes to the programmable gain instrumentation amplifier (PGIA), which amplifies the signal. After the signal is amplified, the sample and hold keeps the analog signal constant so that the A/D converter can determine the digital representation of the analog signal. A good DAQ board will then place the digital signal in a first-in first-out (FIFO) buffer, so that no data

image

will be lost if the sample cannot transfer immediately over the PC I/O channel to computer memory. Having a FIFO becomes especially important when the board is run under operating systems that have large interrupt latencies.

Basic Analog Specifications

Almost every DAQ board data sheet specifies the number of channels, the maximum sampling rate, the resolution, and the input range and gain.

The number of channels, which is determined by the multiplexer, is usually specified in two forms, differential and single ended. Differential inputs are inputs that have different reference points for each channel, none of which is grounded by the board. Differential inputs are the best way to connect signals to the DAQ board because they provide the best noise immunity.

Single-ended inputs are inputs that are referenced to a common ground point. Because single-ended inputs are referenced to a common ground, they are not as good as differential inputs for rejecting noise. They do have a larger number of channels, however. You can use the single-ended inputs when the input signals are high level (greater than 1 V), the leads from the signal source to the analog input hardware are short (less than 15 ft), and all input signals share a common reference.

Some boards have pseudodifferential inputs, which have all inputs referenced to the same common—like single-ended inputs—but the common is not referenced to ground. Using these boards, you have the benefit of a large number of input channels, like single-ended inputs, and the ability to remove some common mode noise, especially if the common mode noise is consistent across all channels. Differential inputs are still preferable to pseudodifferential, however, because differential is more immune to magnetic noise.

Sampling rate determines how fast the analog signal is converted to a digital signal. If you are measuring AC signals, you will want to sample at least two times faster than the highest frequency of your input signal. Even if you are measuring DC signals, you can sample faster than you need to and then average the samples to increase the accuracy of the signal by reducing the effects of noise.

If you have multiple DC-class signals, you will want to select a board with interval scanning. With interval scanning, all channels are scanned at one sample interval (usually the fastest rate of the board), with a second interval (usually slow) determining the time before repeating the scan. Interval scanning gives the effects of simultaneously sampling for slowly varying signals without requiring the addition cost of input circuitry for true simultaneous sampling.

Resolution is the number of bits that are used to represent the analog signal. The higher the resolution, the higher the number of divisions the input range is broken into and, therefore, the smaller the possible detectable voltage. Unfortunately, some data acquisition specifications are misleading when they specify the resolution associated with the DAQ board. Many DAQ boards specifications state the resolution of the ADC without stating the linearity’s and noise and, therefore, do not give you the information you need to determine the resolution of the entire board. Resolution of the ADC, combined with the settling time, integral non-linearity, differential non linearity, and noise will give you an understanding of the accuracy of the board.

Input range and gain tell you what level of signal you can connect to the board. Usually, the range and gain are specified separately, so you must combine the two to determine the actual signal input range as

signal input range = range/gain

For example, a board using an input range of ±10 V with a gain of 2 will have a signal input range of ±5 V. The closer the signal input range is to the range of your signal, the more accurate your readings from the DAQ board will be. If your signals have different input ranges, you will want to look for a DAQ board that has the capability of different gains per channel.


Transducer Performance , Loading and Transducer Compliance .

Transducer Performance

images

The operation of a transducer within a control system can be described in terms of its static performance and its dynamic performance. The static characteristics of greatest interest are

Scale factor (or sensitivity)

Accuracy, uncertainty, precision, and system error (or bias)

Threshold, resolution, dead band, and hysteresis

Linearity

Analog drift

The dynamic characteristics of greatest interest are

Time constant, response time, and rise time

Overshoot, settling time, and damped frequency

Frequency response

Static performance is documented through calibration, which consists of applying a known input (quantity or phenomenon to be measured) and observing and recording the transducer output. In a typical calibration procedure, the input is increased in increments from the lower range limit to the upper range limit of the transducer, then decreased to the lower range limit. The range of a component consists of all allowable input values. The difference between the upper and lower range limits is the input span of the component; the difference between the output at the upper range limit and the output at the lower range limit is the output span.

Dynamic performance is documented by applying a known change, usually a step, in the input and observing and recording the transducer output.

Loading and Transducer Compliance

A prime requirement for an appropriate transducer is that it be compliant at its input. Compliance in this sense means that the input energy required for proper operation of the transducer, and hence a correct measurement of the controlled output, does not significantly alter the controlled output. A transducer that does not have this compliance is said to load the controlled output. For example, a voltmeter must have a high-impedance input in order that the voltage measurement does not significantly alter circuit current and, hence, alter the voltage being measured.

Defining Terms

Controlled output: The principal product of an automatic control system; the quantity or physical activity to be measured for automatic control.

Feedback path: The cascaded connection of transducer and signal conditioning components in an automatic control system.

Forward path: The cascaded connection of controller, actuator, and plant or process in an automatic control system.

Motion transducer: A transducer used to measure the controlled output of a servomechanism; usually understood to include transducers for static force measurements.

Plant or process: The controlled device that produces the principal output in an automatic control system.

Process control: The term used to refer to the control of industrial processes; most frequently used in reference to control of temperature, fluid pressure, fluid flow, and liquid level.

Process transducer: A transducer used to measure the controlled output of an automatic control system used in process control.

Reference input: The signal provided to an automatic control system to establish the required controlled output; also called setpoint.

Servomechanism: A system in which some form of motion is the controlled output.

Signal conditioning: In this context, the term used to refer to the modification of the signal in the feedback path of an automatic control system; signal conditioning converts the sensor output to an electrical signal suitable for comparison to the reference input (setpoint); the term can also be applied to modification of forward path signals.

Transducer: The device used to measure the controlled output in an automatic control system; usually consists of a sensor or pickup and signal conditioning components.

References

Bateson, R.N. 1993. Introduction to Control System Technology, 4th ed. Merrill, Columbus, OH.

Berlin, H.M. and Getz, F.C., Jr. 1988. Principles of Electronic Instrumentation and Measurement. Merrill, Columbus, OH.

Buchla, D. and McLachlan, W. 1992. Applied Electronic Instrumentation and Measurement. Macmillan, New York.

Chaplin, J.W. 1992. Instrumentation and Automation for Manufacturing. Delmar, Albany, NY. Doeblin, E.O. 1990. Measurement Systems Application and Design, 4th ed. McGraw-Hill, New York. Dorf, R.C. and Bishop, R.H. 1995. Modern Control Systems, 7th ed. Addison-Wesley, Reading, MA.

O’Dell, T.H. 1991. Circuits for Electronic Instrumentation. Cambridge University Press, Cambridge, England, UK.

Seippel, R.G. 1983. Transducers, Sensors, and Detectors. Reston Pub., Reston, VA.

Webb, J. and Greshock, K. 1993. Industrial Control Electronics, 2nd ed. Macmillan, New York.

Further Information

Manufacturers and vendors catalogs, data documents, handbooks, and applications notes, particularly the handbook series by Omega Engineering, Inc.:

The Flow and Level Handbook

The Pressure, Strain, and Force Handbook

The Temperature Handbook

Trade journals, magazines, and newsletters, particularly:

Instrumentation Newsletter (National Instruments)

Personal Engineering and Instrumentation News

Test and Measurement World