Phase Changes
It is a daily experience that matter changes between phases: ice will melt, water will boil and evaporate, dew will condense out of moist air, and so on.
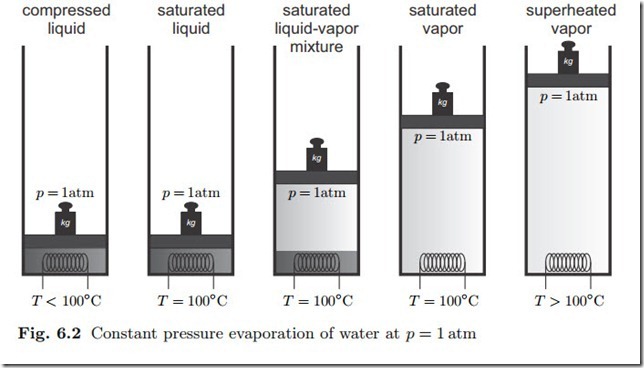
We study the evaporation of liquid water at constant pressure p = 1atm, as depicted in Fig. 6.2. Water is confined in a piston-cylinder system with a moving piston, the mass of the piston fixes the pressure in the system.
We go through the figure from left to right: At temperatures below 100 ◦C (and above 0 ◦C) only the liquid phase is found, we speak of compressed liquid. Isobaric heat supply increases the temperature of the compressed liquid. When the temperature reaches 100 ◦C, the water starts to evaporate. Further heat supply does not increase the temperature, which still is 100 ◦C, but leads to more evaporation. As evaporation occurs, liquid and vapor are in an equilibrium state where both phases coexist, the saturated state. The corresponding liquid and vapor states are denoted as saturated liquid and
saturated vapor, respectively. Finally, when all liquid is evaporated, further heat supply increases the temperature of the vapor above 100 ◦C, we speak of superheated vapor.
When heat is withdrawn, the opposite process happens: the superheated vapor will cool down until it reaches 100 ◦C, then vapor will start to con- dense. After all vapor is condensed, the compressed liquid cools to lower temperatures.
The saturation temperature depends on pressure, we write Tsat (p). The inversion gives the saturation pressure, denoted as psat (T ). In the example we have Tsat (1 atm) = 100 ◦C and psat (100 ◦C) = 1 atm. Figure 6.3 shows a sketch of the saturation curve of water in the p-T-diagram. The curve begins in the triple point (611 Pa, 0.01 ◦C) and ends in the critical point (22.09 MPa, 374.14 ◦C).
For temperatures above the critical temperature, and for pressures above the critical pressure, a saturated liquid-vapor equilibrium is not possible. In the critical point all properties agree between vapor and liquid, and above the critical point only one phase exists, one speaks of supercritical fluid.
The triple point gives the lowest temperature/pressure at which a saturated liquid-vapor equilibrium is possible; only at this point all three phases, solid, liquid and vapor, can coexist.
Apart from the liquid-vapor phase change, i.e., evaporation and condensation, one observes the phase changes between solid and liquid, i.e., melting and freezing (solidification), and between solid and vapor, i.e., sublimation and deposition. For each, phase equilibrium is only possible for values of pressure and temperature T and pressure p on the corresponding saturation curve, psat (T ).
Figure 6.4 shows the saturation curves for water as ice, liquid, and vapor in a p-T-diagram. Note the large number of different ice phases, which reflect different lattice configurations.1 Phase equilibria (coexistence of two phases) are only possible on those curves which are given by the saturation pressure psat (T ) for the respective phase equilibrium, or, alternatively, by the saturation temperature Tsat (p) which is the inverse function. All three phases can coexist in only one point, the triple point. Away from the saturation lines the substance will be in just one of the phases as indicated in the figure. An interesting information that can be drawn from the diagram is that no liquid water exists at temperatures below −23 ◦C.
A particular feature of water is the negative slope of its melting curve which implies that ice will melt under pressure. This behavior is related to the volume change: A given amount of ice has a larger volume than the same amount of liquid water, as can be seen by ice swimming on water. Melting reduces the volume and thus counteracts the pressure increase. Melting under pressure might play a role in the flow of glaciers, but does not explain the slipperiness of ice, see Sec. 17.12.
Sublimation can be observed in winter, where snow evaporates, in particular on dry sunny days, without melting. An industrial application of
sublimation is the process of freeze-drying which is used to produce instant coffee: coffee is frozen at a temperature TC , and then subjected to a pressure pC below the sublimation pressure, pC < psub (TC ); this forces direct evaporation of ice.
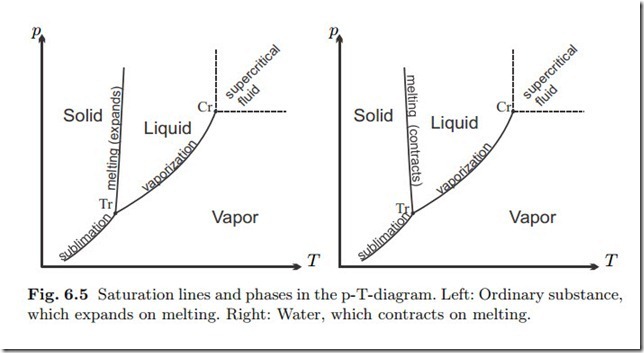
Saturation curves for other substances show the same principal characteristics as those for water, in particular the existence of critical and triple points. However, for almost all other substances the solid has a smaller volume than the liquid, and the solid-liquid line has a positive slope. Figure 6.5 shows p-T-diagrams with the saturation lines for sublimation, melting and vaporization, and indication of the solid, liquid, and vapor regions. For supercritical fluid there is no distinction between liquid and vapor.
Phase changes are related to volume changes. For most substances the volume of the liquid is larger than that of the solid (see the left Fig. 6.5), with water being an exception (see the right Fig. 6.5). Other substances that exhibit expansion on freezing are silicon, gallium and bismuth. Vapor volume is always larger than liquid volume at the same pressure. The volume differences do not become apparent in the p-T-diagram, where the saturated states appear as lines, but in the pressure-volume diagram (p-v-diagram). For a substance that contracts on freezing, such a diagram is sketched in Fig. 6.6.
Saturated state lines in the diagram are indicated. There are two lines for saturated liquid, one describes phase equilibrium with saturated vapor, the
ther phase equilibrium with saturated solid. In the two-phase regions (solid + liquid, liquid + vapor, solid + vapor) one observes mixtures of saturated states, as discussed in the next section. On the triple line, one observes mixtures of all three phases, solid (volume vtr ), liquid (vtr ) and vapor (vtr ) where s l v all three phases are at triple point pressure and temperature,
We could also plot a T-v-diagram, but instead we show, in Fig. 6.7, the p- v-T-surface of an ordinary substance (contracts on freezing). The p-T-, p-v-, and T-v-diagrams are just the appropriate projections of the surface.


