p-v- and T-s-Diagrams
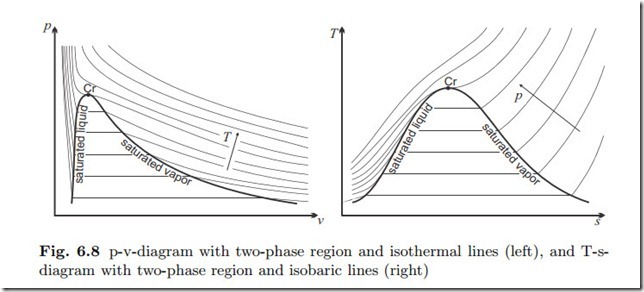
An indispensable tool for thermodynamic analysis are plots of processes in suitable diagrams. The diagrams most often used are the p-v- and the T-s- diagram. For most processes only liquid and vapor or gas phases are encountered, and thus one uses diagrams that only show liquid and vapor states, and the corresponding two-phase region.
Figure 6.8 shows both diagrams including saturation lines and critical point. Isothermal lines (constant temperature) are sketched in the p-v-diagram, and isobaric lines (constant pressure) are sketched in the T-s-diagram. Note that both are horizontal in the two-phase region, where pressure and temperature are related through the saturation equation p = psat (T ). Obviously, in the p-v-diagram constant pressure lines are horizontal, and constant volume lines are vertical; in the T-s-diagram constant temperature lines are horizontal, and constant entropy lines are vertical.
