The efficiency correlation of Smith (1965)
All manufacturers of steam and gas turbines keep large databases of measured efficiency of axial- flow turbine stages as functions of the duty parameters (flow coefficient, φ, and stage loading coefficient, ψ). Smith (1965) devised a widely used efficiency correlation based upon data obtained from 70 Rolls-Royce aircraft gas turbines, such as the Avon, Dart, Spey, Conway, and others, including the special four-stage turbine test facility at Rolls-Royce, Derby, England. The data points and
efficiency curves found by him are shown in Figure 4.11. It is worth knowing that all stages tested were constant axial velocity, the reactions were between 0.2 and 0.6 and the blade aspect ratio (blade height to chord ratio) was relatively large, between 3 and 4. Another important factor to remember was that all efficiencies were corrected to eliminate tip leakage loss so that, in actual operation, the efficiencies would be higher than those expected for the equivalent real turbines. The tip leakage losses (which can be very large) were found by repeating tests with different amounts of tip clearance and extrapolating the results back to zero clearance to get the desired result.
Every turbine was tested over a range of pressure ratios to find its point of maximum efficiency and to determine the corresponding values of ψ and φ. Each point plotted in Figure 4.11 represents
just one test turbine at its best efficiency point and the value of its efficiency is shown adjacent to that point. Confirmatory tests made by Kacker and Okapuu (1982) and others have shown the use- fulness of the chart in preliminary turbine design.
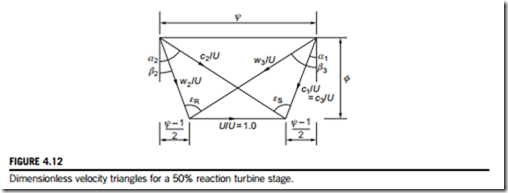
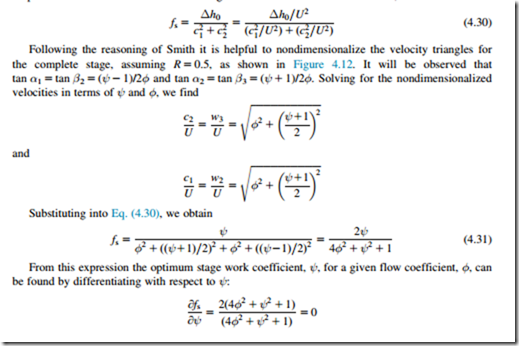
Smith developed a simple theoretical analysis to explain the shape of the efficiency curves. He argued that the losses in any blade row were proportional to the average absolute kinetic energy, ð1=2Þðc2 1 c2Þ, for that row. For R 5 0.5, Smith defined a factor, fs, as the ratio of the shaft work output to the sum of the mean kinetic energies within the rotor and stator. Thus,
Figure 4.13 is a carpet plot of ψ versus φ for various values of fs. Superimposed on this plot is the locus of the optimum curve defined by Eq. (4.32). It has been noted that this curve tends to fol- low the trend of the optimum efficiency of the Rolls-Royce efficiency correlation given in Figure 4.13. It has been reported by Lewis (1996) that a more accurate representation of the opti- mum can be picked out from the Rolls-Royce data as
It is worth knowing that Lewis (1996) developed Smith’s method of analysis to include the blade aerodynamics and blade loss coefficients adding further insight into the method.


