Example: Condensation of Saturated Steam
As an example we consider the isochoric (constant volume) condensation of saturated steam from an initial temperature of T1 = 280 ◦C to T2 = 200 ◦C. In the initial state, the properties are just at the saturation values, which can be read from Fig. 6.10 as
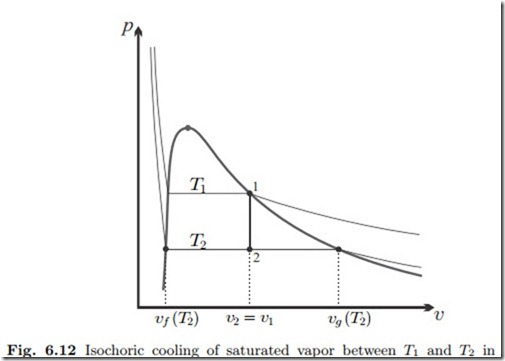
The values of two properties—two bits of information—are required to fix a state. In state 1 these are the temperature and the knowledge that the steam is saturated. For state 2, we know its temperature T2, and its volume, which is unchanged, v2 = v1. To learn more about the final state, it is best to draw the process into a p-v-diagram. As shown in Fig. 6.12, the isochoric process to lower temperature is a vertical line downwards from the saturated vapor curve, and the final state 2 lies in the two-phase region between the saturation lines. Hence, this state is a mixture of saturated liquid at volume vf (T2), and saturated vapor at volume vg (T2), which we find from the table
The values for uf (T2) , ufg (T2) etc. are taken from the table. The verification of the above results is left to the reader.
We recall that quality must have values between 0 and 1. If one computes a quality outside this range, the corresponding state is not a saturated state, but either compressed liquid or superheated vapor, for which the property data must be found in the appropriate tables.


