PID (PROPORTIONAL-INTEGRAL-DERIVATIVE) CONTROLLERS
A PID (proportional-integral-derivative) controller is a standard feedback-loop component that measures an output of a process and controls an input, with the goal of maintaining the output at a target value, called the set-point. An example of a PID application is the control of a process temperature, although it can be used to control any measurable variable which can be affected by manipulating some other process variable, such as pressure level, flow rate, chemical composition, force, speed, or a number of other variables. Automobile cruise control is an example of a PID application area outside the process industries.
PID control mechanism
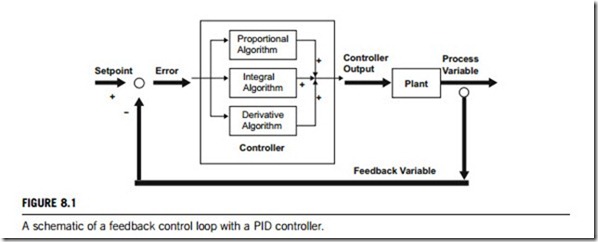
PID can be described as a group of rules by which the precise regulation of a closed-loop feedback control system is obtained. Closed-loop feedback control means that the real-time measurement of the process being controlled is constantly fed back to the controller, to ensure that the target value is, in fact, being realized. The mission of the controlling device is to make the measured value, usually known as the process variable, equal to the desired value, usually known as the set-point. It uses the control algorithm we know as three-mode; proportional þ integration þ derivative. Figure 8.1 is a schematic of a feedback control loop with a PID controller.
The most important element of the algorithm, proportional control, determines the magnitude of the difference between the set-point and the process variable, which is defined as error. Then it applies appropriate proportional changes to the controller output to eliminate error. Many control systems will in fact, work quite well with only proportional control. Integral control examines the offset of set-point and the process variable over time and corrects it when and if necessary. Derivative control monitors
the rate of change of the process variable and makes changes to the controller output to accommodate unusual changes.
Each of the three control functions is governed by a user-defined parameter, which vary immensely from one control system to another, and, as such, need to be adjusted to optimize the precision of control. The process of determining the values of these parameters is known as PID tuning which can be done by a number of different methods. Certain PID tuning methods require more equipment than others, but usually result in more accurate results with less effort.
PID controller implementation
Like all feedback controllers, a PID controller usually uses an actuator to affect the process and a sensor to measure it. Virtually all PID controllers determine their output by observing the error between the set-point and a measurement of the process variable. Errors occur when an operator changes the set-point intentionally or when a disturbance or a load on the process changes the process variable accidentally. The mission of the controller is to eliminate the error automatically.
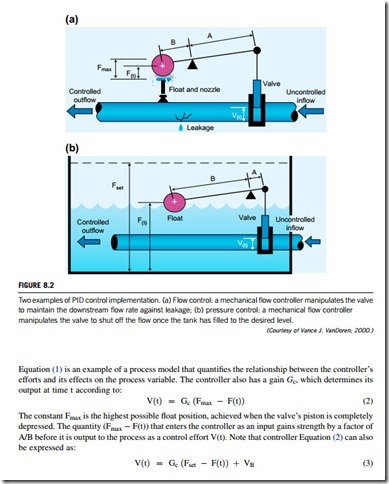
Consider, for example, the mechanical flow controller depicted in Figure 8.2(a). A portion of the water flowing through the tube is bled off through the nozzle on the left, driving the spherical float upwards in proportion to the flow rate. If the flow rate slows because of a disturbance such as a leakage, the float falls and the valve opens until the desired flow rate is restored.
In this example, the water flowing through the tube is a continuous process, and its flow rate is the process variable that is to be measured and controlled. The lever arm serves as the controller, taking the process variable measured by the float’s position and generating an output that moves the valve’s piston. Adjusting the length of the piston rod sets the desired flow rate; a longer rod corresponds to a lower set-point and vice versa.
Suppose that at time t, the valve is open by V(t) inches and the resulting flow rate is sufficient to push the float to a height of F(t) inches. This process is said to have a gain of Gp ¼ F(t)/V(t). The gain shows how much the process variable changes when the controller output changes. In this case,
where Fset is the desired float position (achieved when the flow rate equals the set-point) and VB ¼ Gc (Fmax – Fset) is a constant known as the bias. A controller’s bias represents the control effort required to maintain the process variable at its set-point in the absence of a load.
(1) Proportional control
Equation (3) shows how this simple mechanical controller computes its output as a result of the error between the process variable and the set-point. It is a proportional controller because its output changes in proportion to a change in the measured error. The greater the error, the greater the control effort; and as long as the error remains, the controller will continue to try to generate a corrective effort.
A possible problem in the example shown in Figure 8.2(a) is that a proportional controller tends to settle on the wrong corrective effort. As a result, it will generally leave a steady-state error (offset) between the set-point and the process variable after it has finished responding to a set-point change or a load. Suppose the process gain Gp is 1, so that any valve position V(t) will cause an identical float position F(t). Suppose also the controller gain Gc is 1 and the controller’s bias VB is 1. If the set-point for the flow rate requires Fset to be 3 inches and the actual float position is only 2 inches, there will be an error of (Fset – F(t)) ¼ 1 inch. The controller will amplify that 1 inch error to a 2 inch valve opening according to Equation (3). However, since that 2 inch valve opening will in turn cause the float position to remain at 2 inches, the controller will make no further change to its output and the error will remain at 1 inch.
(2) Integral control
One of the first solutions to overcome this problem was integral control. An integral controller generates a corrective effort proportional, not to the present error, but to the sum of all previous errors. The level controller depicted in Figure 8.2(b) illustrates this point. It is essentially the same float-and-lever mechanism from the flow control example (see Figure 8.2(a)) except that it is now surrounded by a tank, and the float no longer hovers over a nozzle but rests on the surface of the water. This arrangement should look familiar to anyone who has inspected the workings of a common household toilet.
As in the first example (see Figure 8.2(a)), the controller uses the valve to control the flow rate of the water. However, its new objective is to refill the tank to a specified level whenever a load (i.e., a flush) empties the tank. The float position F(t) still serves as the process variable, but it now represents the level of the water in the tank, rather than the water’s flow rate. The set-point, Fset, is the level at which the tank is full.
The process model is no longer a simple gain Equation like (1), since the water level is proportional to the total volume of water that has passed through the valve. That is:
FðtÞ ¼ Integral ðGp VðtÞ dtÞ (4) Equation (4) shows that tank level F(t) depends not only on the size of the valve opening V(t) but also on how long the valve has been open.
The controller itself is the same, but the addition of the integral action in the process makes it more
effective. Specifically, a controller that contains its own integral action, or acts on a process with inherent integral action will generally not permit a steady-state error. This phenomenon becomes apparent in this example. The water level in the tank will continue to rise until the tank is full and the valve shuts off. On the other hand, if both the controller and the process happened to be pure inte- grators as in Equation (4), the tank would overflow because back-to-back integrators in a closed loop cause the steady-state error to grow without bound.
(3) Derivative control
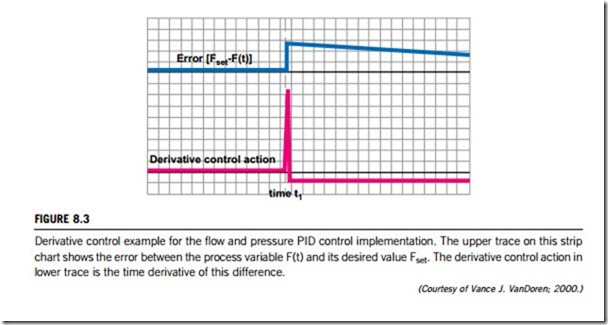
The basic idea of derivative control is to generate one large corrective effort immediately after a load change in order to begin eliminating the error as quickly as possible. The strip chart in Figure 8.3 shows how a derivative controller achieves this. At time t1, the error, shown in the upper trace, has increased abruptly because a load on the process has dramatically changed the process variable. The derivative controller generates a control action proportional to the time derivative of the error signal.
The derivative of the error signal is shown in the lower trace which could be given by Equation (5).
FðtÞ ¼ Derivative ðFset – FðtÞÞ (5) Note the spike at time t1. This happens because the derivative of a rapidly increasing step-like function is itself an even more rapidly increasing impulse function. However, since the error signal is much more level after time t1, the derivative of the error returns to roughly zero thereafter. Derivative control action is zero when the error is constant and spikes dramatically when the error changes abruptly.
In many cases, adding this “kick” to the controller’s output solves the performance problem nicely. The derivative action does not produce a particularly precise corrective effort, but it generally gets the process moving in the right direction much faster than a PI controller would.
(4) Combined PID control
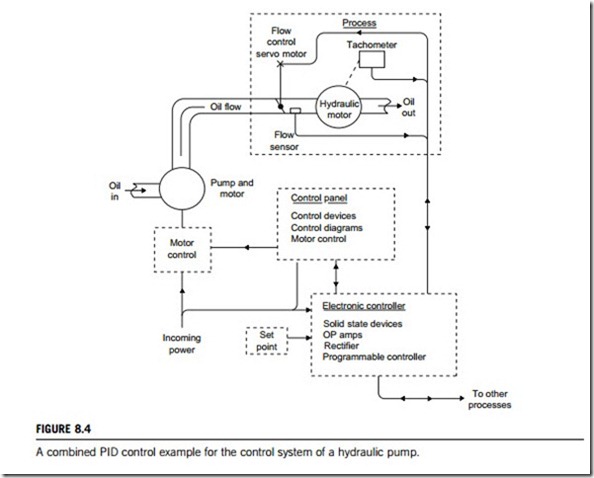
A combined PID controller is able to perform these three control mechanisms automatically: Proportional control þ integral control þ derivative control. An illustration of a system using PID control is shown in Figure 8.4. This system needs a precise oil output flow rate controlled by pump motor speed. This is controlled through a control panel consisting of a variable-speed drive. In turn, the drive’s speed control output is controlled by an electronic controller, whose output to the drive is determined by two factors.
The first factor is the set-point, determined by a dial setting (or equivalent device). Second, a flow sensor feeds back the actual output flow rate to the electronic controller. The controller compares the set point and the actual flow. If they differ for some reason, a corrective signal is sent to the motor controller, which changes motor speed accordingly, by changing the voltage applied to the motor. For example, if the output oil flow rate goes below the set point, a signal to speed up the motor is sent. The controller then uses PID control to make the correction promptly and accurately to return to the set point flow. If the dial is changed to a new setting, the function of the PID system is to reach the new set- point as quickly and accurately as possible.
If interested, a reader can analyze this example in Figure 8.4 to explain what the proportional control is, what the integral control is, and what the derivative control is.
PID controller tuning rules
Over the past decades, PID controllers have been very popular in industry due the simplicity of this control law and the small number of tuning parameters needed for PID controllers. Hundreds of tools,
methods and theories are available for this purpose. However, finding appropriate parameters for PID controllers is still a difficult task, so in practice control engineers still often use trial and error for the tuning process.
There are many rules, sometimes called methods, for the proper tuning of PID controls, most of which require a considerable amount of trial and error as well as a technician endowed with a lot of patience. This technique will not solve every problem, but it has worked for many. This subsection describes two basic methods for tuning PID controllers to help readers get started.
(1) Ziegler Nichols tuning rules
There are two common techniques, the process reaction curve technique and the closed-loop cycling method, for tuning PID controllers. These two methods were first formally described in an article by
J.G. Ziegler and N.B. Nichols in 1942.
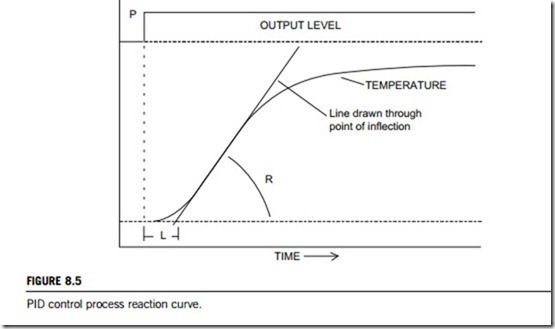
Figure 8.5 describes the process reaction curve technique. It should be understood that optimal tuning, as defined by J.G. Ziegler and N.B. Nichols, is achieved when the system responds to a perturbation with a 4:1 decay ratio. That is to say that, for example, given an initial perturbation of þ40o, the controller’s subsequent response would yield an undershoot of -40o followed by an overshoot of þ2.5o. This definition of optimal tuning may not suit every application, so the trade-offs must be understood.
In the closed-loop cycling method, estimate the ultimate gain Ku and ultimate period Tu when a proportional part of the controller is acting alone. Follow these steps:
(a) Monitor the temperature response curve over time using an oscilloscope.
(b) Set the proportional gain low enough to prevent any oscillation in the response (temperature).
(c) Increase the gain in steps of 2x the previous gain. After each increase, if there is no oscillation, change the set-point slightly to trigger an oscillation.
(d) Adjust the gain so that the oscillation is sustained, that is, continues at the same amplitude. If the
oscillation increases, decrease the gain slightly. If it is decreasing, increase the gain slightly.
(e) Make note of the gain that causes sustained oscillations and the period of oscillation. These are the ultimate gain Ku and the ultimate period Tu, respectively.
(2) Tuning an ON OFF control system
If the controller contains integral and derivative adjustments, tune them to zero before adjusting the proportional band. This adjustment selects the response speed (sometimes called gain) a proportional controller requires to achieve stability in the system, and must be wider in degrees than the normal oscillations of the system but not so wide as to dampen the system response. Start out with the narrowest setting for the proportional band. If there are oscillations, slowly increase the proportional band in small increments, allowing the system to settle out for a few minutes after each step adjustment until the point at which the offset droop begins to increase. At this point, the process variable should be in a state of equilibrium at some point under the set-point. The next step is to tune the integral or reset action. If the controller has a manual reset adjustment, simply adjust the reset until the process droop is eliminated. The problem with manual reset adjustments is that once the set-point is changed to a value other than the original, the droop will probably return and the reset will once again need to be adjusted.
If the control has automatic reset, the reset adjustment adjusts the auto reset time constant (repeats per minute). The initial setting should be at the lowest number of repeats per minute to allow for equilibrium in the system. In other words, adjust the auto reset in small steps, allowing the system to settle after each step, until minor oscillations begin to occur. Then back off on the adjustment to the point at which the oscillations stop and the equilibrium is reestablished. The system will then auto- matically adjust for offset errors (droop). The last control parameter to adjust is the rate or derivative function. It is crucial to remember to always adjust this function last, because if the rate adjustment is turned on before the reset adjustment is made, the reset will be pulled out of adjustment when the rate adjustment is turned on. The tuning procedure is then complete.
The function of the rate adjustment is to reduce any overshoot as much as possible. The rate adjustment is a time-based adjustment measured in minutes, which is tuned to work with the overall system response time. The initial rate adjustment should be the minimum number of minutes possible. Increase the adjustment in very small increments. After each adjustment let it settle down for a few minutes. Then increase the set-point by a moderate amount. Watch the control action as the set-point is reached. If an overshoot occurs, increase the rate adjustment by another small amount and repeat the procedure until the overshoot is eliminated. Sometimes the system will become sluggish and never reach set-point at all. If this occurs, decrease the rate adjustment until the process reaches set-point. There may still be a slight overshoot but this is a trade-off situation.
PID controller software design
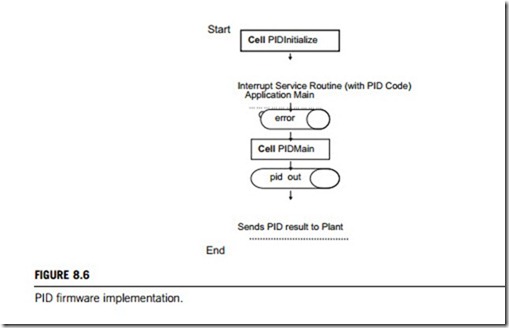
There is no specific way a PID should be implemented in firmware; the methods described here only touch on a few of the many possibilities. The PID routine is configured in a manner that makes it modular. It is intended to be plugged into an existing piece of firmware, where the PID routine is passed the 8-bit or 16-bit or 32-bit error value that equals the difference between the desired plant response and the measured plant response. The actual error value is calculated outside the PID routine, but if necessary, the code could be easily modified to do this calculation within it. The PID can be configured to receive the error in one of two ways, either as a percentage with a range of 0 100% (8- bit), or a range of 0 4000 (16-bit) or even higher (32-bit). This option is configured by a #define statement at the top of the PID source code with the PID’s variable declarations, if the programming language used is C or Cþþ. The gains for proportional, integral, and derivative all have a range of 0 15. For resolution purposes, the gains are scaled by a factor of 16 with an 8-bit maximum of 255. A general flow showing how the PID routine would be implemented in the main application code is presented in Figure 8.6.
There are two methods for handling the signed numbers. The first method is to use signed mathematical routines to handle all of the PID calculations. The second is to use unsigned mathematical routines and maintain a sign bit in a status register. If the latter is implemented, there are five variables that require a sign bit to be maintained: (1) error, (2) a error,(3) p error, (4) d error, (5) pid error. All of these sign bits are maintained in the register defined as, for example, pid stat1 register.
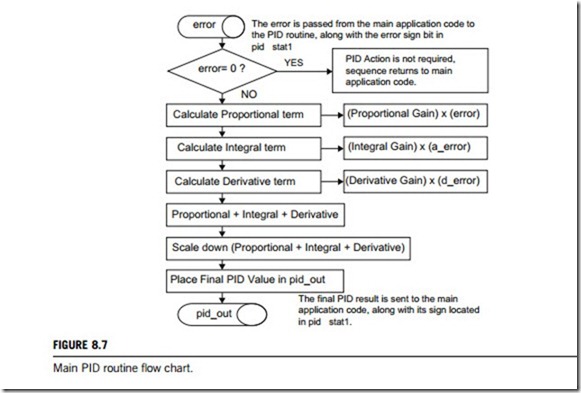
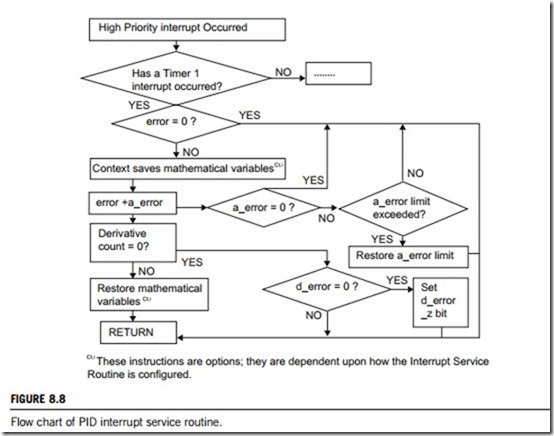
Flowcharts for the PID main routine and the PID Interrupt service routine functions are shown in Figures 8.7 and 8.8, respectively. The PID main routine is intended to be called from the main application code that updates the error variable, as well as the pid stat1 error sign bit. Once in the PID main routine, the PID value will be calculated and put into the pid out variable, with its sign bit in pid stat1. The value in pid out is converted by the application code to the correct value so that it can be applied to the plant. The PID interrupt service routine is configured for a high priority interrupt. The
instructions within this interrupt service routine can be placed into an existing interrupt service routine, or kept as is and plugged into the application code.
The proportional is the simplest term. The error is multiplied by the proportional gain: (error) x (proportional gain). The result is stored in the variable, prop. This value will be used later in the code to calculate the overall value needed to go to the plant. To obtain the integral term, the accumulated error must be retrieved. The accumulated error, a error, is the sum of past errors. For this reason, the integral is known for looking at a system’s history for correction. The derivative term is calculated in similar fashion to the integral term. Considering that the derivative term is based on the rate at which the system is changing, the derivative routine calculates d error. This is the difference between the current error and the previous error. The rate at which this calculation takes place is dependent upon the Timer1 overflow. The derivative term can be extremely aggressive when it is acting on the error of the system. An alternative to this is to calculate the derivative term from the output of the system and not the error. The error will be used here. To keep the derivative term from being too aggressive, a derivative counter variable has been installed. This variable allows d error to be calculated once for an x number of Timer1 overflows (unlike the accumulated error, which is calculated every Timer1 overflow). To get the derivative term, the previous error is subtracted from the current error (d error ¼ error – p error). The difference is then multiplied by the derivative gain and this result is placed in the variable, deriv, which is added to the proportional and integral terms.
