Analog signals, closed loop control and intelligent modules
Introduction
So far we have considered signals that are essentially digital (on/off ) in nature plus numerical data from timers and counters. In many systems (and the majority of small systems) these signals are all that is required. Often, though, a PLC will be required to measure, or control, plant signals which can assume any value in some predetermined range. Typical signals of this type are temperatures, flows, pressure, speeds, etc. These are known as analog signals.
In a similar way a PLC may have to produce analog output signals to drive meters and proportional valves, or provide a speed reference for a motor drive controller.
To meet these requirements a PLC needs analog input and output cards. These have somewhat different characteristics to the simple digital cards we have discussed so far. This chapter considers analog signals, the way they are handled and the related topic of other ‘smart’ PLC modules. First it is useful to briefly review the types of analog signals that are likely to be encountered.
Common analog signals
Temperature
Measurement of temperature is probably the commonest analog function. Although the simplest measuring device is the common mercury in glass thermometer, it is not readily adaptable to give a remote reading. In industry, remote temperature measurements are primarily made by three methods.
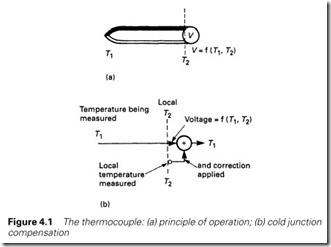
The first of these is the thermocouple, shown in Figure 4.1, where two dissimilar metals are joined together at the point whose temperature is to be measured, and linked to a sensitive voltmeter at some remote location. The voltmeter reading is a function of the two temperatures T1 and T2. Variation in the local temperature T2 will cause errors, so ‘cold
junction compensation’ is normally applied by measuring the local temperature with some separate device and adding a correction signal as in Figure 4.1(b).
Many types of metal combinations can be used for different tem- perature ranges, and are denoted by a letter. An R-type thermocouple, for example, uses platinum with an alloy of platinum/rhodium and has a range from 0 to 1700 °C; the commoner type-K thermocouple uses chromel/alumel and has a range of 0–1100 °C. The signals from all of these are very small; just 42 mV per °C for a type-K thermocouple.
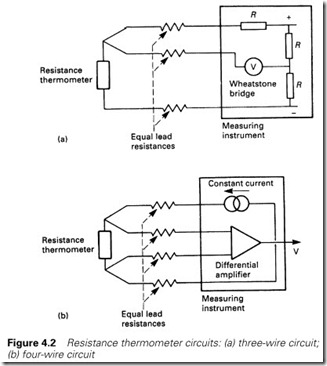
The next form of thermometer uses the variation of resistance with temperature. A platinum wire constructed with a resistance of 100 W at 0 °C will have a resistance of 138.5 W at 100 °C. Such devices are known as PT100 sensors (PT for platinum and 100 for the resistance at 0 °C). These can be used over the range -200 °C to +800 °C. To reduce the error from the connecting cable resistance (which can be around 1 W) the three- and four-wire connections of Figure 4.2 are used, which allow
the PT100 resistance to be read accurately with a bridge circuit. Vari- ations on the resistance thermometer use semiconductor materials. These devices, called thermistors, exhibit larger, but non-linear, changes in resistance.
The final type of common thermometer is called the pyrometer and measures the infrared radiation emitted from a hot surface. Pyrometers have the advantage that they can be remote from the object being measured, but they can only be used above 500 °C.
Pressure
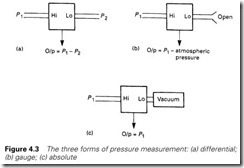
With pressure measurement, it is important to appreciate that there are three distinct forms of sensor, although all are really variations on the differential pressure transducer of Figure 4.3(a). This gives an output
signal proportional to the difference in pressure between its two ports. The gauge pressure transducer measures pressure with respect to atmosphere; easily achieved by leaving one port open as in Figure 4.3(b). Gauge pressures usually have a ‘g’ suffix, 1.4 psig, for example. The final method connects one port to a vacuum to give absolute pressure as in Figure 4.3(c). With normal atmospheric pressure at about 1 bar,
2.4 bar gauge would be 3.4 bar absolute.
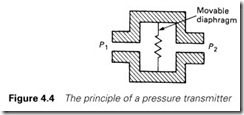
The basic measurement method illustrated in Figure 4.4 applies the two pressures to a diaphragm, and infers the pressure difference by observing the diaphragm deflection or measuring the force needed from an electrical solenoid to keep the diaphragm central. The latter technique is known as the force balance principle.
Flow
Flow measurement is important in many processes. There are, again, several types of flow. Mass flow refers to the mass of fluid passing a given point per unit of time (e.g. kilograms per minute). Volumetric flow refers to the volume of fluid per unit time (e.g. litres per second). With gases, which are compressible, volumetric flow needs to consider temperature and pressure and refer the fluid back to some standard condition (usually 0 °C and 1 bar, called STP for Standard Temperature and Pressure). Finally we have flow velocity, which is the speed of the fluid (e.g. metres/second).
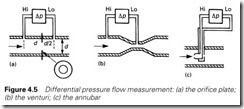
The commonest method of flow measurement generates a pressure drop across a restriction in the pipe. The simplest of these is the orifice plate of Figure 4.5(a) (with tappings at d and d/ 2 where d is the pipe diameter). Variations on this theme are the venturi tube of Figure 4.5(b) and the annubar of Figure 4.5(c).
There is, however, one disadvantage. The pressure drop (i.e. the dif- ferential pressure) is proportional to the square of the flow, i.e.
Pd = kF 2
where Pd is the differential pressure, F the flow and k a scaling constant. This limits the turndown (the ratio between maximum and minimum flow) to about 4:1, and requires a square root function to be available to convert the differential pressure to linear flow (i.e. F = B Pd where B is a constant). PLCs capable of reading analog inputs invariably include a square root function. Needless to say, floating point (real) numbers are needed if accuracy is not to be lost.
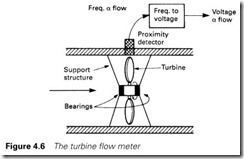
Where a large turndown is needed, the turbine flow meter of Figure 4.6 can be used. The rotation of the turbine blades is sensed by a proximity detector to give a signal which is proportional to flow
(i.e. no square root extractor needed) and a large turndown (typically 10:1). The disadvantage is wear in the bearings.
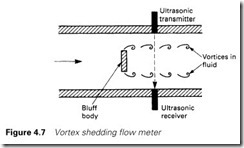
The vortex shedding flow meter of Figure 4.7 also gives a linear signal proportional to flow and measures flow by detecting the small vortices generated downstream of a bluff obstruction in the flow path. (Similar vortices can be seen when moving a hand through water.) In Figure 4.7 an ultrasonic beam is used to detect the vortices.
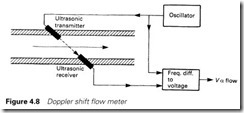
The final method of Figure 4.8 also uses an ultrasonic beam to measure the flow, with the frequency change caused by Doppler shift (change of frequency with velocity) being measured to indicate flow. This method has the advantage that no intrusion into the pipe is required.
Speed
Speed of motors, pumps, conveyors, etc. is often an indication of process throughput. The commonest way of measuring speed is a DC tachometer, which is simply a DC generator with an output voltage proportional to the rotational speed. A typical device, the GEC BD Tacho, has an output of 100 volts per 1000 rev/min.
Digital pulse tachos use a toothed wheel in front of a proximity detector, or a spoked wheel in front of a photocell, to give a pulse train whose frequency is proportional to speed. A simple electronic circuit can convert the frequency to a linear voltage.
Weighing systems
There are two basic methods of finding the weight of an object; these are known as a strain weigher, or a force balance weigher. In the first type, of which a spring balance is an example, the object to be weighed dis- torts the support structure, and this distortion is measured to give an indication of the weight. In the second type, of which two-pan kitchen scales to which weights are added or removed is typical, the weight of the object is balanced by some force (electrical, pneumatic or hydraulic) which can then be measured.
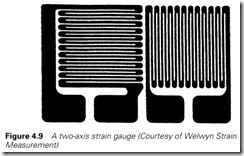
Most industrial weighing systems are strain weighers, and use a load cell as the primary measuring element. In its commonest form this is a cylinder to which strain gauges have been attached. These consist of a fine web of thin wires similar to Figure 4.9 which, when subjected to a strain, experience a small change in resistance as their length and cross-section change. Because the gauges are attached to the cylinder of the load cell, their deflection is determined by the changes in the dimension of the cylinder caused by the load.
The resistance changes are very small (typically less than 0.1 W on a base resistance of 100 W) and similar changes can occur from temperature changes (see Section 4.2.1). It is usual, therefore, to arrange four strain gauges per load cell with two loaded and two at 90 degrees unloaded which, in a Wheatstone bridge, will give an output purely dependent on the load and not on temperature.
Weighing is something of a ‘black art’, and care needs to be taken to ensure that the load is carried solely by the load cells, and jamming or undesirable support by, say, pipes or cables is not occurring. Impact shocks from falling objects should also be considered if damage is not to occur.
Level
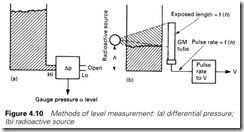
Liquid level is needed in many process industries. The simplest, and most reliable, method uses the fact that the gauge pressure in a liquid is directly proportional to the head of liquid above it, as shown in Figure 4.10. The pressure is given by
P = rgh for SI units (pascals) or
P = rh for Imperial Units (psi)
where r is the liquid density, g is the acceleration due to gravity and h is the liquid head. Care must be taken to ensure that the pressure transducer is compatible with the fluid.
Other methods use floats (whose position can be measured) and techniques using low-level radioactive sources, as in Figure 4.10(b), where the liquid blocks the radiation, altering the signal from a detector (such as a Geiger-Muller tube) on the other side of the tank.
Position
Position is often measured not only as a signal in its own right (measuring the position of a drill head, for example) but also to infer the value of some other variable. The measurement of level is sometimes achieved with a float whose position is recorded.
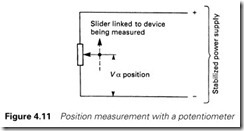
A simple position measurement system can be obtained with a free-moving linear or rotational potentiometer and a stabilized power supply to give an output voltage directly related to the slider position (Figure 4.11).
A more accurate device, with no contact friction and minimal movement force, is the LVDT (for linear variable differential trans- former) of Figure 4.12. The AC input signal Vin produces voltages V1 and V2 in the two secondaries of the transformer whose relative magnitudes depend on the position of the moveable core. A phase- sensitive rectifier produces a DC output signal whose amplitude varies as the core movement. Optical encoders are also often used for accurate
position measurement. These are described further in Section 9.10.
Output signals
So far we have considered analog signals which appear as inputs to the PLC. Output signals are also needed, typical examples being to drive meters, control proportional valves or provide required values (set- points) for other controlling devices. A PLC dealing with analog devices thus needs to be able to handle both input and output signals.
Signals and standards
It is apparent from the previous sections that the ‘raw’ signals from the plant sensors are many and varied, ranging from a few millivolts (for a thermocouple) to perhaps over a hundred volts for a tacho, and exhibiting variations in DC volts, AC volts or even resistance. Some form of standardization is obviously desirable if a vast range of analog input cards is not to be required.
The general form of an input signal can therefore be represented by Figure 4.13. The raw signal from the sensor is converted to some standard signal by a local electronics unit, the sensor and the local electronics unit being known as a transmitter or a transducer. The standardized signal representing the plant variable being measured can then be connected to a standard analog input card.
The obvious question is what this standardized signal should be. Analog signals are low level and hence susceptible to electrical interference (or noise as it is more generally known). A signal represented by an
electric current is less affected by noise than a signal represented by a voltage, so a current loop is usually chosen. The transducer and the receiving device are connected as Figure 4.14 with the current signal being locally converted to a voltage by a suitable ballast resistor. A current loop can also be used with several receivers (meter, chart recorder and PLC input, for example) connected in series.
The commonest standard represents an analog signal as a current within the range 4–20 mA, with 4 mA representing the minimum signal level, and 20 mA the maximum. If, for example, a pressure transducer gave a 4–20-mA signal representing a pressure range of 0–10 bar, a pressure of 8 bar would be represented by a current of 8 ´ (20 – 4)/10 + 4 mA = 16.8 mA. A 4–20-mA signal is often converted to a 1–5-V signal by a local 250-W ballast resistor.
The 4-mA ‘zero’ signal (called the offset) serves two purposes. The first is protection against transducer or cable damage. If the transducer fails, or the signal cable is open or short circuit, the current through the local ballast resistor will be zero, giving a ‘negative’ signal of 0 V at the receiver. This is easily detected and can be used to give a ‘transducer fault’ alarm.
The 4-mA offset current can also simplify installation. In Figure 4.14 we assumed that the transducer was provided with a local power supply and sourced the signal current. Such devices are available, but the arrangement of Figure 4.15 is commoner (and simpler). Here the power supply (usually 24–30 V DC) is mounted local to the receiving device, and the signal lines serve both to power the transducer and transmit the current. The transducer draws current from the power supply in the range 4–20 mA according to the signal being measured. This current is converted to a voltage by a ballast resistor as before.
The 4-mA offset provides the current that the transducer needs to keep working. Obviously a transducer with a signal range of 0–20 mA could not operate in this manner. Transducers similar to Figure 4.15 are commonly called two-wire transducers.
Analog interfacing
Resolution
An analog interface card converts a continuously varying analog signal to a digital form that can be used inside a PLC program. The analog signal is generally represented, initially at least, as an integer number.
This analog to digital conversion (usually known by the initials ADC) is inherently accompanied by a loss of resolution which depends on the number of bits used. An 8-bit byte, for example, can represent an integer in the range 0–255. If this was used to represent an analog signal measuring a flow with a span (range) from 0 to 1800 l/min, one bit will represent approximately 7 l/min (given by 1800/255). Any control strategy in the program based on finer resolution is meaningless. (Particular care should be taken with comparisons, as some values can never be obtained; a flow of 138 l/min, for example, would never be given by our 8-bit system; it would jump from 134 l/min to 141 l/min.
Comparisons should always be based on (greater than or equal to) or (less than or equal to).
A commoner resolution is 12 bits. This gives a representation as an integer from 0 to 4095. With our flow of 0–1800 l/min, one bit would represent just under 0.5 l/min (1800/4095 = 0.44).
This ‘coarseness’ is not the problem it might at first appear. Although an analog transducer can give any value in its span, it will have inherent errors. Many first-line transducers are only 2% accurate. If our flow transducer had 2% accuracy, its measurement could be in error by 36 l/min. Alongside this error, the 7-l/min resolution is probably quite reasonable.
It is therefore useful to think of the resolution in terms of an error which is to be added to the error from the transducer itself, as in Table 4.1.
Few industrial transducers have an accuracy better than 0.1%, and a 12-bit conversion will add little error in most applications.
Multiplexed inputs
As we have seen earlier, a PLC generally works with a 16-bit word. If our analog input card occupies one slot in a rack, and reads just one analog input, it will be wasteful of I/O space (and very expensive). For comparison, a normal digital input card reads 16 signals, and costs about a quarter as much as an analog input card.
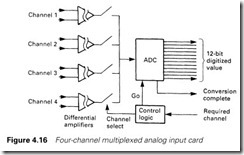
The cost, and I/O usage, can be reduced by using multiplexing, shown as a block diagram in Figure 4.16. Here four analog input signals, separated from each other by isolation amplifiers, are selected in turn by electronic switches and converted to a digital number by a common ADC. Such cards commonly deal with four, eight or sixteen input signals.
If the card is occupying a single card slot, there obviously has to be some way for the PLC to link the sequential readings from the ADC with the actual input signals. This is a problem we shall return to in Sections 4.4.4 and 4.4.5.
Conversion times
The conversion from analog to digital signal is not instantaneous (although extremely fast ADCs with conversion times of nanoseconds are used in digital TV systems). In most industrial systems there is a high probability that electrical noise from the local AC mains (50 or 60 Hz, depending on the country) will be present on the signal.
A technique called dual slope integration ties the conversion time to the local mains frequency, giving a high degree of AC mains-related noise rejection. This gives conversion times of 20 ms in the UK (50-Hz supply) and 16.67 ms in the USA (60-Hz supply).
With a four-way multiplexer stepping round each channel in turn, a signal will thus be sampled once every 80 ms. To this must be added the program scan time and the remote scan time if the analog card resides in a remote rack.
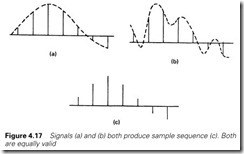
An analog input card thus works by taking ‘snapshot’ samples of the plant signals. A sampled system only knows about the values of its samples. It cannot infer any other information about the signals it is dealing with. Both of the signals of Figure 4.17(a) and (b) would produce the same result of Figure 4.17(c) if sampled at the same rate. An obvious question, therefore, is what sample rate we should choose if our samples are to accurately represent the original signals.
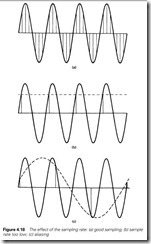
In Figure 4.18(a) a sine wave is being sampled at a relatively fast rate. Intuitively one would assume this sampling rate is adequate. In Figure 4.18(b) the sample rate and the frequency are the same. This is obviously too low as the samples imply a constant unchanging output.
In Figure 4.18(c) the sample rate is lower than the frequency and the sample values are implying a sine wave of much lower frequency than the signal. This latter case is called aliasing. A visual effect of aliasing can be seen on cinema screens where moving wheels often appear to go backwards. This effect occurs because the camera samples the world at about 50 times per second.
Any continuous signal will have a frequency range of interest (called its bandwidth). To permit an accurate representation of the original signal to be rebuilt the sampling frequency should be at least twice this frequency bandwidth. This, somewhat simplified, is known as Shannon’s sampling theorem.
Any real life system will not, however, have a well-defined bandwidth
and sharp cut-off point. Noise and similar effects will cause any real signal to have a significant component at higher frequencies. Aliasing may occur with these high-frequency components and cause apparent variations in the frequency band of interest. Before sampling, therefore, any signal should be passed through a low pass anti-aliasing filter to ensure only the bandwidth of interest is sampled.
Most industrial control signals have a bandwidth of a few Hz, so sampling within Shannon’s limit is not normally a problem. Normally the bandwidth is not known precisely so a sample rate of about 5 to 10 times the envisaged bandwidth is used. For example, with a typical 2 Hz signal a 10 Hz sampling rate would be adequate requiring a sample time of 100 ms.
Surprisingly, this rarely gives problems. Practical industrial systems, dealing with real plant signals concerned with materials with significant
mass, rarely have bandwidths greater than 0.5 Hz, and any frequency higher than this can be considered to be extraneous noise and filtered out. Temperature loops, for example, can often be sampled as slowly as once every few minutes without introducing any errors. The designer should, however, always be aware of Shannon’s sampling theorem and check that the ADC conversion time is compatible with the signals being measured.
Channel selection and conversion to engineering units
A typical eight way analog input card will provide eight 12-bit signals, each ranging from 0 to 4095 in their ‘raw’ form. Generally these will need to be accessed via the PLC program and converted to engineering units such as °C, or psi, or l/min. If, for example, the range 0–4095 represents a flow of 0–1000 l/min, a resolution of about 0.25 l/min will theoretically be achievable.
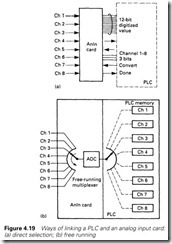
The PLC must therefore address two problems; how to access the multiplexed data via the signal card, and how to use the data in the pro- gram. There are essentially two ways of accessing the data, summarized in Figure 4.19.
In Figure 4.19(a) the PLC selects which channel it wants to read by sending a 3- or 4-bit address as an output instruction to the card along with a ‘convert’ command. The card returns the digitized 12-bit value and a ‘done’ signal which can be read with a normal word input command. This method has the advantage that the programmer can select different sample rates for different signals.
The commoner method, though, is shown in Figure 4.19(b). A block of storage locations in the PLC store is directly associated with the analog input card. The card ‘free runs’, writing digitized values into the store from where they can be read by the rest of the program. In Siemens PLCs with fixed slot addressing, for example, the store addresses are determined directly by the analog card position in the rack; a card in slot 2 of the first rack will write its values to a block of stores starting at location 192.
Conversion from a raw 12-bit signal to engineering units can have subtle traps for the unwary. In theory the conversion is simple. If N is the raw signal, HR the high-range signal (corresponding to 4095) and LR the low-range signal (corresponding to zero) then the measured value, MV, is simply
If the calculation is done with real (floating point) numbers there should be no problem, and equation (4.1) can be used directly.
If, however, integer numbers have to be used, great care must be taken. If the multiplication N´(HR- LR) is performed first, arithmetic overspill is likely unless 32-bit results can be accommodated. If the division N/4095 is performed first, the equation will not work as N is always less than 4095, giving an integer result of zero (and an MV of LR). Wherever possible real numbers should be used if equation (4.1) has to be performed.
To avoid this problem, the different manufacturers have devised methods to read analog input signals. In the ABB Master, for example,
the database definitions for each signal define HR, LR, the sample rate and a name by which the signal will be referred to in the program. There are, obviously, detail differences, so in the next section we will look, by way of an example, at the way analog signals are read by an Allen Bradley PLC-5.
Analog input cards
The Allen Bradley PLC-5 reads analog signals with an analog input card (1771-IFE) which can, in its simplest form, read eight analog inputs.
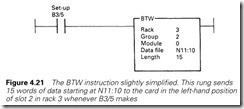
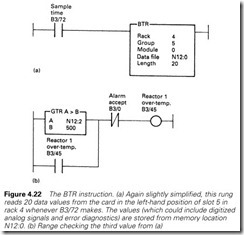
The PLC communicates with the card via instructions called ‘block transfers’ which transfer data to (or from) a block of store locations. Data transfers from the PLC to a card are called ‘block transfer writes’ (BTW) and, not surprisingly, transfers from a card to the store are ‘block transfer reads’ (BTR). For each type of instruction, somewhat simplified, the programmer states:
(a) the direction of transfer (BTW or BTR)
(b) the card address (rack, slot and slot half, left or right)
(c) the store location address
(d) the number of 16-bit words to be transferred
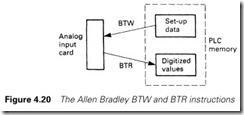
The analog input card uses both BTW and BTR instructions, the BTW being used once, after power up, to configure the module and the BTRs subsequently to read the data as summarized in Figure 4.20.
The post-power-up BTW in Figure 4.21 sets how the module is to behave; whether it gives data in binary or BCD, whether the module uses eight differential signals or 16 signals referenced to a common 0 V, and the maximum and minimum values for the input range (HR and LR in equation (4.1)) on each channel. The card uses these to return readings in engineering units (in 12-bit binary integer, two’s complement format or 12-bit BCD).
Once set up, values can be read at the required time intervals with a BTR as in Figure 4.22(a). This gives signal values in the specified store locations along with over-range and similar alarms. The values can then be used in the program; in Figure 4.22(b) an over-temperature check is being made on the third analog signal from Figure 4.22(a).
Filtering
The set-up data in Figure 4.21 include a filter time constant to provide a first-order filter on the input signal. This helps to remove any noise on the signal. If the analog readings on another system are unfiltered, or an unusually long time constant is needed (the 1771-IFE of Figure 4.20 can provide a time constant of up to about one second), the programmer can provide a separate filter routine.
A first-order filter can be represented by the simple differential equation
where x is the input signal (corresponding to the raw value from the input card), y is the filtered signal and T is the time constant.
In a PLC system we do not have continuous values for y and x, but sampled values of y and x taken at intervals D t (the update time of the card, or the rate at which samples are initiated).
We thus have a snapshot input sequence xn, xn – 1, x n – 2, where xn is the most recent, and x n – 1 the previous, and a similar output sequence yn, y n – 1, etc.
We can approximate:
Substituting back into equation (4.2) gives
Solving for the filtered value yn gives
This requires one store location to hold the last value of y (denoted by yn – 1) and can be easily performed by the simple sequence of Figure 4.23. Note that for equation (4.5) and Figure 4.23 to work, the update time
Dt must be consistent and known.
Analog output signals
PLCs are often required to drive analog output signals as well as read analog inputs. Common applications are driving analog meters or chart recorders and providing reference signals such as the desired speed for a thyristor drive. Like analog inputs, these signals have standard voltage ranges of 1–5V or 0–10 V or the current range of 4–20 mA.
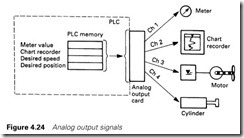
A typical analog output card, the Allen Bradley 1771-OFE, has four output channels, each turning a 12-bit (0–4095) digital signal into an analog output. Isolation amplifiers are used on the outputs to reduce the effects of noise and allow the signals to connect into external devices fed from different electrical supplies. The digital signals come from storage locations inside the PLC as shown in Figure 4.24. This action is known as a digital to analog conversion, or DAC.
For best resolution the PLC should use the full 0–4095 range, but this is frequently impossible. If the PLC, for example, is setting the speed range of a motor from 0 to 1350 rev/min, it will need to convert 0–1350 into the range 4–20 mA. Equation (4.1) can be rearranged as
where VDAC is the value passed to the DAC (in the range 0–4095). N is the output number in engineering units, and HR/LR are the high- and low-range values. As before, great care must be taken with equation (4.6) to avoid overspill or loss of resolution.
The PLC-5 communicates with the 1771-OFE with the BTW instruc- tion described in the previous section. The programmer sets up a block of 12 words as in Figure 4.25(a), the first four of which contain the values, and the balance the set-up data such as HR and LR. The block of data is then written to the card with a BTW. Figure 4.25(b) shows a typical example where an analog speed reference can be raised or lowered by operator-controlled pushbuttons. Note the use of Greater Than (GTR) and Less Than (LES) instructions to confine the counter value within the allowed range of 0–1350 rev/min.
Ranging as in Figure 4.25 allows engineering units to be used inside the program; the counter in Figure 4.25, for example, holds the speed directly in rev/min, but this is accompanied by a loss of resolution, as explained earlier. For the range 0–1350 rev/min, we have a resolution of about 0.1%, compared with the theoretical 0.025% resolution available from the card.
Analog-related program functions
There are other operations that can be performed on analog signals. A typical list, for the GEM-80, is
SQRT Square root, mainly used with differential pressure flow measuring devices (such as orifice plates)
LINCON Performs X*(A/B) + C with limiting
FGEN Multipoint straightline function generator used for linearizing and similar functions (see Figure 4.26(a))
LIMIT Performs limiting of signals as shown in Figure 4.26(b)
RAMP Rate limiting (with different rise and fall rates).
DEDBAND Deadband functions as in Figure 4.26(c). Useful for preventing ‘dither’ in closed loop control when PV and SP are close.
ANALAG First-order lag. Used for filtering (see also Section 4.4.6).
Closed loop control
Introduction to control theory
Many industrial processes require some plant variable (temperature, pressure or flow, for example) to be kept at a fixed value or to follow some profile. These schemes are normally based on the block diagram of Figure 4.27 where the actual value is fed back from the plant and compared with the desired value. This is known as feedback or closed loop control.
The required value, denoted by SP for Setpoint, is compared with the actual value PV, for process variable, to give an error E, which is simply
E = SP – PV (4.7)
This is multiplied by a gain K to give an output OP from the control mechanism where
OP = KE = K(SP – PV) (4.8)
This output causes a change in the plant, giving the output PV. In a well-ordered plant, PV will be directly related to OP, allowing us to write
PV = A X OP (4.9)
where A is a simple gain factor.
Combining equations (4.7) to (4.9) allows us to write
i.e. the plant signal PV will follow the SP multiplied by a scaling factor AK/(1 + AK ). The term AK is known as the open loop gain, and is often denoted by G, allowing us to write
It can be seen that for large values of G, the error between PV and SP will be small. For G = 10, for example,
PV = 0.91SP
A large value of G can be obtained by using a large value of gain, K. Unfortunately, in practical systems this often leads to instability, a topic discussed in the following section.
Figure 4.28 shows a modified type of control strategy, where the output signal is the sum of the error plus the time integral of the error, i.e.
This is known, for obvious reasons, as PI control, for proportional plus integral control.
The integral term will cause OP to change as long as there is an error and OP will only be constant when the error is zero and SP = PV. (The full analysis of a PI controller requires a knowledge of calculus. Interested readers are referred to control theory textbooks such as the author’s Industrial Control Handbook published by Butterworth-Heinemann.) A PI controller thus provides zero error in the steady state without the need for a high gain.
In practical controllers, the term M in equation (4.12) is replaced by 1/Ti giving
where Ti is known as the integral time. The reason for this change arises out of the underlying mathematics.
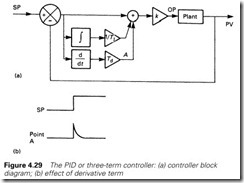
A further modification is shown in Figure 4.29. Here a time derivative (rate of change) term has been added, giving
Not surprisingly this is known as a three-term or PID (for proportional plus integral plus derivative) controller. The multiplier Td is known as the derivative time.
The derivative term brings two benefits. Because it responds to the rate of change of error it will ‘kick’ the output as in Figure 4.29(b), when the setpoint changes rapidly. The derivative term can also make a system more stable and reduce overshoot.
So far we have considered a plant signal following a setpoint. Closed loop control is also useful where a plant is subject to disturbances from the outside world as summarized in Figure 4.30. A level control system, for example, could be affected by changes in the outflow rate, a temperature control system will be affected by changes in ambient temperature and the temperature of the material it is heating, and a flow control system will be sensitive to changes in source pressure. Because all of these will produce a change in PV, the controller will detect them and modify OP to make PV = SP again, and remove the effect of the disturbance.
Stability and loop tuning
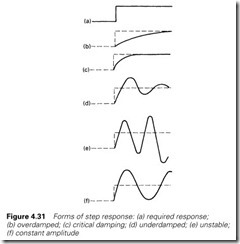
Ideally we want PV to equal SP at all times. A real plant has finite reaction times and non-linearities, and the ideal response is impossible. Figure 4.31 shows some possible responses to a step change in SP (similar curves could be obtained for a step disturbance).
An achievable practical response is usually similar to the somewhat underdamped Figure 4.31(d). A common standard, known as quarter- amplitude damping, aims for each overshoot to be 25% of the previous.
The engineer has control over the response by adjustment of the gain K, the integral time Ti and the derivative time Td. These can be set by trial and error (a good starting point is often K = 0.5, Ti = 20 s, Td = 5 s) or a good deal of time can be spent analysing the mathematics governing the plant (again see the author’s Industrial Control Handbook).
The required values can also be determined by experiment (although the reader should be aware that the effects on the plant can be severe and safety implications should be considered). The experimental method described below, known as the Ziegler–Nichols method, should give a quarter-amplitude response.
The controller is initially set up as a proportional-only controller (Ti = infinity, and Td = zero). Varying the gain K will change the step response from the underdamped Figure 4.31(d) to the unstable Figure 4.31(e). There will be a critical value of gain Kc where constant oscillation will occur as in Figure 4.31(f ). The period of these oscillations, Tc, is then measured. The required controller settings are then
PI
K = 0.45Kc
Ti = 0.8Tc PID
K = 0.6Kc
Ti = 0.5Tc
Td = 0.12Tc
These values are best viewed as initial settings, which can be tuned for best response. Increasing the gain, or decreasing Ti, makes a system respond faster but decreases the stability. A good rule of thumb is to make Td = Ti/4 when derivative action is used.
Further tuning techniques are given in the author’s Industrial Control Handbook.
Closed loop control and PLCs
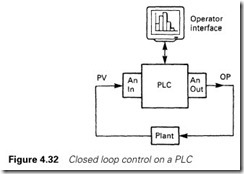
A closed loop system based on PLCs will be similar to Figure 4.32. The plant variable, PV, is read by an analog input card, and the output OP provided by analog output cards. The setpoint, SP, is provided by the operator (via a graphics terminal in Figure 4.32) or by some program sequence. The PID algorithm is then provided by the program.
It is possible to write PID algorithms with four-function (+-* /) math- ematics, but it needs great care. The program scan time must be known for the integral and derivative routines, and protection against output
actuator saturation must be built in to overcome an effect called integral wind-up.
In most, if not all, PLCs which can support analog input and output cards, the manufacturer supplies a PID function in the program library. In this section we will look at the way the GEM-80 handles closed loop control.
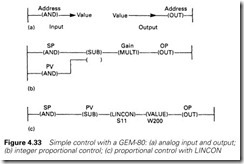
The GEM-80 gets a value from the outside world with an AND address instruction, and sends values to the outside world with OUT addresses as in Figure 4.33(a) (from Sections 4.4.5 and 4.5 it will be apparent that this is a simplification of what is really going on). Input
addresses have the form An (e.g. A4) and output addresses the form Bn (e.g. B3). The GEM-80 can also store numbers in W locations (e.g. a value can be stored in W112).
Let us first consider a simple proportional-only controller, where E = (SP – PV). We could write OP = K(SP – PV) and perform the oper- ation with integer math functions as in Figure 4.33(b). This, however, has the disadvantage that the output will change in large steps. If K, for example, has the value 4, the output will change in steps of 4.
The GEM-80 has many built-in functions working with real numbers. One of these is a linear function Y = AX + B, denoted by LINCON-S11. We can use this as a gain function by setting B = 0. Combining this with a more succinct way of writing the subtraction function gives us the single rung of Figure 4.33(c). The A and B values for the LINCON are stored in the addresses defined in the VALUE function.
A full PID block, PIDABS-S34, is available and is used in its simplest form as in Figure 4.34. The addresses for K, Ti, Td are specified in the VALUE block following the PIDABS block. As written, these start at address W220. Altogether, there are 15 storage locations concerned with PIDABS. These include
Fault Code
Settings for K, Ti, Td Changeable by the programmer or by the program
itself to allow, for example, settings to be used in different circumstances
Output limits
Rate limits Maximum rate of change of output
Hold mode Drives output to a fixed value
Suicide mode Drives output to zero
These are all accessible by the program, and can be used to make complex control schemes.
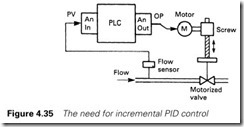
A close relation of the PIDABS is the PIDINC function used when the controller drives a motorized valve as in Figure 4.35. Here the motor acts as an integrator itself, since
If a conventional PID controller is used here, instability will result. The PIDINC is the derivative of PIDABs and has the function
When combined with the integral action of the motorized valve, a normal PID action results.
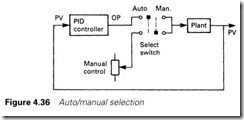
So far we have been concerned with purely automatic actions. Often a manual mode is required, with an automatic changeover selection as shown in Figure 4.36. There is a hidden problem here.
When manual is selected the PID function is still active, and as it is highly unlikely that PV will equal SP in manual, the integral term in the PID controller will cause the output from the PID function to rise to full output or drop to zero. When auto is reselected, PV will swing wildly for some time until the PID function regains control.
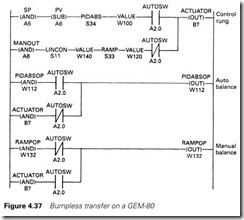
What is needed is a bumpless transfer which matches automatic and manual values on changeover. In a GEM-80 this can be achieved with the three rungs of Figure 4.37. The operating mode, automatic or manual, is selected by a switch connected to digital input A2.0, which is energized for automatic. (Note the good design practice; a lost supply to the switch will make the control change to manual and will hold the last output value.)
The first rung selects the output from the PIDABS function (for automatic) or from the manual control (in manual). The RAMP function limits the rate of change of the manual signal.
The second and third rungs perform the balance. W112 holds the output value of the PIDABS function (with block starting at address W100) and W132 holds the output value of the ramp function (block starting at address W120).
In automatic, rung 2 has no effect, but rung 3 writes the output value B7 back to the ramp output W132. When a change takes place from automatic to manual, the ramp will start at the last automatic value.
Similarly, in manual, rung 2 writes the output B7 to the PIDABS output W112, so on a change from manual to automatic, the PID function starts at the last manual value. Rung 3 has no effect in manual.
A bumpless transfer is thus achieved in both directions.
Specialist control processors
PLCs are not, of course, the only devices capable of performing closed loop control. Three-term controllers are readily available (even as plug-in modules for a PLC rack) and controller manufacturers overlap with PLCs by providing programmable analog controllers.
Typical of these is the TCS Tactician, which uses a graphical programming method to link together standard signal-processing blocks. The ‘program’ is built on the screen with a mouse.
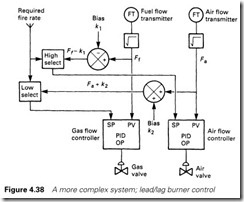
Figure 4.38 shows a control scheme for temperature control of an oil-fired furnace. There are three PID controllers, one for the tempera- ture loop, and one each for the air and oil flow. The correct ratio is maintained between the oil and air flows, with the air leading for increasing heat and the oil leading for decreasing heat (known as lead/ lag control). This structure is literally drawn on a VDU screen.
Schemes such as Figure 4.38 are much easier to program in control- based schemes such as the Tactician, but general arithmetical and sequencing schemes are simpler in PLCs. Which is used in a specific scheme is a matter of judgement for the project engineer.
Bar codes
All articles bought in supermarkets are labelled with a bar code which identifies the country of origin, manufacturer and the item itself. These bar codes are read at the checkout by a scanner, and the price found automatically from the store’s computer and added to the customer’s
bill. This is a typical application of bar code technology which is being widely introduced in industry and commerce as a way of tracking and keeping inventory control of items with minimal human intervention. For example, the ISBN numbers used to identify books are now read by bar code readers in libraries and used to keep track of library loans for the UK Public Lending Right (PLR) scheme.
The structure of a bar code is shown in Figure 4.39. It consists of a series of bars and spaces used to encode alphanumeric symbols in a machine readable format. At either end is a quiet zone to allow the reading system to sense the start and finish of the bar code. A quiet zone is needed because not all bar code representations are of a consistent length. The bearer bars are added when there is a danger that a mis- aligned read scan may not catch all of the bar code data. The bearer bars will then give a broad pulse which the reader will detect and cause the read to be rejected.
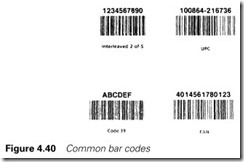
There is not a single universal bar code, and many different codings are in use throughout the world. Some of the commoner ones are shown in Figure 4.40. Code 39 uses nine bar elements per digit, three of which are wide (hence the name). The nine elements are always made up of four spaces and five bars.
EAN stands for European Article Number and was derived from the earlier American UPC or Universal Product Code. Both use characters constructed from two bars and two spaces occupying seven positions. Only numeric data can be represented. EAN and UPC have long data streams which can be subdivided into subsets by longer twin bars. Supermarkets in the UK use EAN product coding, with three groups denoting country of manufacture (UK is 5, France is 3 and so on), the manufacturer (012427 is the Scottish soup maker Baxter) and the product itself (020108 is Royal Game Soup). EAN is also used for ISBN book markings.
Interleaved 2 of 5 is again a numeric only coding and it represents characters in pairs, one by the bars and one by the spaces. Each character uses five positions, two of which are wide.
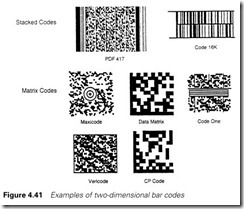
The amount of data that can be held in a linear bar code is determined by the length. Where a large amount of data is required, two dimensional bar codes may be used. Some of the commonest 2D codes are shown in Figure 4.41. These allow over 3 kbytes of data to be encoded. Typically 1800 characters can be held in a 50 mm by 50 mm square. All have extensive error detection and error correction built into the codes.
There are two methods of encoding data in two dimensions. The first, called stacked codes, is essentially multiple rows of linear bar codes. The commonest of these are PDF-417 (widely used in the automotive industry) and Code 16K. PDF-417 can have from 3 to 90 rows, and Code 16K up to 16 rows.
The second encoding method, matrix codes, uses an array of squares (e.g. data matrix) or hexagons (e.g. Maxicode) to encode the data and some method of providing a position datum. The centre datum circles used with Maxicode can be clearly seen.
Stacked codes can be read with normal scanner systems, but need careful alignment. Matrix codes need to be viewed as a whole, and they are read by a charge coupled device (CCD) TV camera and the digitized image analysed by a computer. This allows the reading to be largely independent of rotational errors. The use of a CCD camera removes the need for scanning; all that is required is a fairly high and even level of illumination with no glare or reflections. For this reason it is likely that CCD reading will become more common for linear bar codes as well.
Considerable self-checking is built into these codings. The structure itself has a definite machine readable format which is easily checked by a machine (e.g. the 3/9 relationship in Code 39). In addition the last digit in the code is usually a check digit which is formed using ideas similar to the CRC method described in Section 5.2.7.
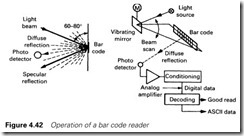
Industrial systems, unlike supermarkets, will normally use automatic bar code marking systems and unattended readers. A bar code is read by scanning a light beam across the code and detecting the reflection. Visible or infrared light can be used with LEDs or low powered lasers as the source. Infrared is attractive for industry because reads can be made through oil and grease coatings. Usually the scanning is performed by a vibrating mirror.
The reflection can be specular (as occurs with a mirror) or diffuse (as occurs from a sheet of paper). Bar code readers rely solely on diffuse reflection. A bar code reading system can thus be represented by Figure 4.42. The light beam should not strike the bar code at 90° as might be first thought, as the resultant specular reflection could dazzle the receiver. Usually angles between 60° and 80° are used.
A bar code is scanned continuously, not just once, and a good read is declared when the same information has been received several times. The number of identical reads needed is set by the designer, but five is a typical number.
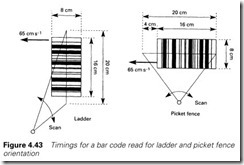
The physical relationship between the scan and the bar code determines how many reads can be attempted. A bar code can be arranged vertically (called ladder orientation) or horizontally (called picket fence).
A reader at a given distance from a target bar code will have a fixed scan length. In Figure 4.43, a reader with a scan length of 20 cm and a scan time of 5 ms (200 scans per second) is being used to read a bar code sized 16 cm by 8 cm. The bar code is moving transversely at 65 cm/s. In the ladder orientation it will remain in view for 8/65 = 0.123 s which will allow 24 reads (each taking 5 ms). With the picket fence arrangement it can only travel 4 cm whilst remaining fully in view,
which, by a similar calculation, will only allow 12 reads. The chance of getting (say) five identical reads increases with the number of reads, so for this application the ladder arrangement is obviously the correct choice.
The reliability of a bar code system is measured by the first read rate (FRR) which is how many times the first scan gives the correct data. The FRR determines how many identical readings are needed before a good read is declared. Typical FRRs are 90% for which three to five identical reads would be needed. Systems can be made to operate at much lower FRRs by increasing the number of identical reads required.
Industrial systems requiring product identification will generally use a bar code reader driven by a PLC. The Allen Bradley PLC family, for example, includes bar code readers which can be directly connected to a PLC rack via a bar code interface card. This uses block transfer read/ write (see Section 4.4.5) to transfer set-up data to the reader, trigger the read, and receive bar code data back from the product. This section is based on material supplied by Allen Bradley.
High-speed counters
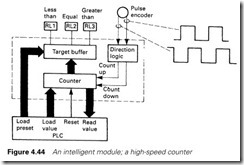
We saw in Section 2.2 that the scan time limits the maximum count rate of a PLC to about 10 Hz. High-speed counter cards are available for use where higher count speeds are needed, or the program scan time introduces an unacceptable random error.
In Figure 4.44, the counter is driven by a directional pulse encoder (which produces two offset pulse trains as shown, allowing the count direction to be observed). The counter value can be loaded from the PLC, and read back when needed. The PLC can also download a preset value, and the counter card drives these outputs showing the relationship between the count and the preset. These outputs are DC to minimize delays (a 50-Hz signal has a 10–20-ms uncertainty).
Intelligent modules
Most PLCs can be fitted with a wide range of intelligent modules. As well as the bar code readers and high-speed counters described above, intelligent modules can include vision systems for pattern recognition (useful in quality control), position control systems for CNC machines and robotics plus sensor modules for thermocouples and PT100 temperature transducers. All minimize the programming effort needed in the main program. There are also add-on processor modules which allow complex mathematical codes to be written in high-level languages such as Basic or C and linked into the PLC program.
Installation notes
Analog systems are generally based on low voltages and are conse- quently vulnerable to electrical noise. In most plants, a PLC may be controlling 415-V high-power motors at 100 A, and reading thermocouple signals of a few millivolts. Great care must be taken to avoid interference from the high-voltage signals.
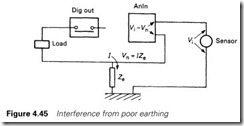
The first precaution is to adopt a sensible earthing layout. A badly laid out system, as in Figure 4.45, will have common return paths, and currents from the high-powered load returning through the common
impedance Ze will induce error voltages into the low-level analog circuit. It should be realized that there are three distinct ‘earths’ in a system:
(a) A safety earth (used for doors, frames, etc.)
(b) A dirty earth (used for high-voltage/high-current signals)
(c) A clean earth (for low-voltage analog signals)
These should meet at one point and one point only (which implies that all analog signals should return, and hence be referenced to, the same point).
Screened cable is needed for all analog signals, with foil screening to be used in preference to braided screen. The screen should not be earthed at both ends as any difference in earth potential between the two points will cause current to flow in the screen as in Figure 4.46, and induce noise onto the signal lines. A screen must be earthed at one point only, ideally the receiving end. When a screened cable goes through intermediate junction boxes, screen continuity must be maintained, and the screen must be sleeved to prevent it from touching the frame of the junction boxes. In the author’s experience, this needs almost personal involvement as contract electricians seem almost brainwashed to earth screens everywhere despite written instructions to the contrary! Earthing faults in screened cables can cause very elusive problems.
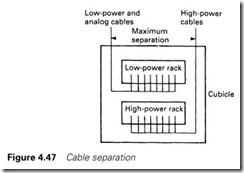
High-voltage and low-voltage cable should be well separated; most manufacturers suggest at least 1 m between 415 V and low-voltage cables but this can be difficult to achieve in practice. In any case, separation can only be achieved until some other person, not knowing the system well, straps a 415-V cable to the same cable tray as a multicore thermocouple cable. The author tends to use trunking or con- duit for low-voltage signals as a way of identifying low-voltage cables for future installers. Some people achieve the same result by using cables with different-coloured PVC sleeves.
In an ideal world, separate cubicles should be provided for 110-V/ high-current signals and low-voltage signals, but this is rarely cost- effective. Where both types of signals have to share a cubicle the cables should take separate, well-separated routes, and the cards be separated as far as possible, as summarized in Figure 4.47.
