Ad Hoc Networks : TCP over Ad Hoc Networks and Capacity of Ad Hoc Networks.

19.6.4 TCP over Ad Hoc Networks

TCP is the prevalent transport protocol in the Internet today and its use over ad hoc networks is a certainty. This has motivated a great deal of research efforts aiming not only at evaluating TCP performance over ad hoc networks, but also at proposing appropriate TCP schemes for this kind of networks. TCP was originally

designed for wired network, based on the following assumptions, typical of such an environment: packet losses are mainly caused by congestion, links are reliable (very low bit error rate), round-trip times are stable, and bandwidth is constant (Postel, 1981; Huston, 2001). Based on these assumptions, TCP flow control employs a window-based technique, in which the key idea is to probe the network to determine the available resources. The window is adjusted according to an additive-increase/multiplicative-decrease strategy. When packet loss is detected, the TCP sender retransmits the lost packets and the congestion control mechanisms are invoked, which include exponential backoff of the retransmission timers and reduction of the transmission rate by shrinking the window size. Packet losses are therefore interpreted by TCP as a symptom of congestion (Chandran, 2001). Previous studies on the use of TCP over cellular wireless networks have shown that this protocol suffers from poor performance mainly because the principal cause of packet loss in wireless networks is no longer congestion, but the error-prone wireless medium (Xylomenos, 2001; Balakrishnan, 1997). In addition, multiple users in a wireless network may share the same medium, rendering the transmission delay time-variant. Therefore, packet loss due to transmission error or a delayed packet can be interpreted by TCP as being caused by congestion. When TCP is used over ad hoc networks, additional problems arise. Unlike cellular networks, where only the last hop is wireless, in ad hoc networks the entire path between the TCP sender and the TCP destination may be made up of wireless hops (multihop). Therefore, as discussed earlier in this chapter, appropriate routing protocols and medium access control mechanisms (at the link control layer) are required to establish a path connecting the sender and the destination. The interaction between TCP and the protocols at the physical, link, and network layers can cause serious performance degradation, as discussed in the following.

Physical Layer Impact

Interference and propagation channel effects are the main causes of high bit error rate in wireless networks. Channel induced errors can corrupt TCP data packets or acknowledgement packets (ACK), resulting in packet losses. If an ACK is not received within the retransmit timeout (RTO) interval, the lost packets may be mistakenly interpreted as a symptom of congestion, causing the invocation of TCP congestion control mechanisms. As a consequence, the TCP transmission rate is drastically reduced, degrading the overall performance. Therefore, the reaction of TCP to packet losses due to errors is clearly inappropriate. One approach to avoid this TCP behavior is to make the wireless channel more reliable by employing appropriate forward error correction coding (FEC), at the expense of a reduction of the effective bandwidth (due to the addition of redundancy) and an increase in the transmission delay (Shakkottai, 2003). In addition to FEC, link layer automatic repeat request (ARQ) schemes can be used to provide faster retransmission than that provided at upper layers. ARQ schemes may increase the transmission delay, leading TCP to assume a large round-trip time or to trigger its own retransmission procedure at the same time (Huston, 2001).

MAC Layer Impact

It is well known that the hidden and exposed terminal problems strongly degrade the overall performance of ad hoc networks. Several techniques for avoiding such problems have been proposed, including the RTS/CTS control packets exchange employed in the IEEE 802.11 MAC protocol. However, despite the use of such techniques, hidden and exposed terminal problems can still occur, causing anomalous TCP behavior. The inappropriate interaction between TCP and link control layer mechanisms in multihop scenarios may cause the so-called TCP instability (Xu, 2001). TCP adaptively controls its transmission rate by adjusting its contention window size. The window size determines the number of packets in flight in the network (i.e., the number of packets that can be transmitted before an ACK is received by the TCP sender). Large window sizes increase the contention level at the link layer, as more packets will be trying to make their way to the destination terminal. This increased contention level leads to packet collisions and causes the exposed terminal problem, preventing intermediate nodes from reaching their adjacent terminals (Xu, 2001). When a terminal cannot deliver its packets to its neighbor, it reports a route failure to the source terminal, which reacts by invoking the route reestablishment mechanisms at the routing protocol. If the route reestablishment takes longer than RTO, the TCP congestion control mechanisms are triggered, shrinking the window size and retransmitting the lost packets. The invocation of congestion

control mechanisms results in momentary reduction of TCP throughput, causing the mentioned TCP instability. It has been experimentally verified that reducing the TCP contention window size minimizes TCP instability (Xu, 2001). However, reduced window size inhibits spatial channel reuse in multihop scenarios. For the case of IEEE 802.11 MAC, which uses a four-way handshake (RTS-CTS-Data-ACK), it can be shown that, in an H-hop chain configuration, a maximum of H /4 terminals can simultaneously transmit (Fu, 2003), assuming ideal scheduling and identical packet sizes. Therefore, a window size smaller than this upper limit degrades the channel utilization efficiency. Another important issue related to the interaction between TCP and the link layer protocols regards the unfairness problem when multiple TCP sessions are active. The unfairness problem (Xu, 2001; Tang, 2001) is also rooted in the hidden (collisions) and exposed terminal problems and can completely shut down one of the TCP sessions. When a terminal is not allowed to send its data packet to its neighbor due to collisions or the exposed terminal problem, its back off scheme is invoked at the link layer level, increasing (though randomly) its back off time. If the back off scheme is repeatedly triggered, the terminal will hardly win a contention, and the winner terminal will eventually capture the medium, shutting down the TCP sessions at the loser terminals.

Mobility Impact

Due to terminal mobility, route failures can frequently occur during the lifetime of a TCP session. As discussed above, when a route failure is detected, the routing protocol invokes its route reestablishment mechanisms, and if the discovery of a new route takes longer than RTO, the TCP sender will interpret the route failure as congestion. Consequently, the TCP congestion control is invoked and the lost packets are retransmitted. However, this reaction of TCP in this situation is clearly inappropriate due to several reasons (Chandran, 2001). Firstly, lost packets should not be retransmitted until the route is reestablished. Secondly, when the route is eventually restored, the TCP slow start strategy will force the throughput to be unnecessarily low immediately after the route reestablishment. In addition, if route failures are frequent, TCP throughput will never reach high rates.

Main TCP Schemes Proposals for Ad Hoc Networks

TCP—Feedback

This TCP scheme is based on explicitly informing the TCP sender of a route failure, such that it does not mistakenly invoke the congestion control (Chandran, 2001). When an intermediate terminal detects a route failure, it sends a route failure notification (RFN) to the TCP sender terminal and records this event. Upon receiving an RFN, the TCP sender transitions to a “snooze” state and (i) stops sending packets, (ii) freezes its flow control window size, as well as all its timers, and (iii) starts a route failure timer, among other actions. When an intermediate terminal that forwarded the RFN finds out a new route, it sends a route reestablishment notification (RRN) to the TCP sender, which in turn leaves the snooze state and resumes its normal operation.

TCP with Explicit Link Failure Notification

Explicit link failure notification (ELFN) technique is based on providing TCP sender with information about link or route failures, preventing TCP from reacting to such failures as if congestions had occurred (Holland, 2002). In this approach, the ELFN message is generated by the routing protocol and a notice to TCP sender about link failure is piggybacked on it. When the TCP sender receives this notice, it disables its retransmission timers and periodically probes the network (by sending packets) to check if the route has been reestablished. When an ACK is received, the TCP sender assumes that a new route has been established and resumes its normal operation.

Ad Hoc TCP

A key feature of this approach is that the standard TCP is not modified, but an intermediate layer, called ad hoc TCP (ATCP), is inserted between IP and TCP (transport) layers. Therefore, ATCP is invisible to TCP and terminals with and without ATCP installed can interoperate. ATCP operates based on the network status information provided by the internet control message protocol (ICMP) and the explicit congestion notification mechanism (ECN) (Floyd, 1994). The ECN mechanism is used to inform the TCP destination of the congestion situation in the network. An ECN bit is included in the TCP header and is set to zero by the TCP sender. Whenever an intermediate router detects congestion, it sets the ECN bit to one. When the TCP destination receives a packet with ECN bit set to one, it informs the TCP sender about the congestion situation, which in turn reduces its transmission rate. ATCP has four possible states: normal, congested, loss, and disconnected. In the normal state ATCP does nothing and is invisible to TCP. In the congested, loss, and disconnected states, ATCP deals with congested network, lossy channel, and partitioned network, respectively. When ATCP sees three duplicate ACKs (likely caused by channel induced errors), ATCP transitions to the loss state and puts TCP into persist mode, ensuring that TCP does not invoke its congestion control mechanisms. In the loss state, ATCP retransmits the unacknowledged segments. When a new ACK arrives, ATCP returns to the normal state and removes TCP from the persist mode, restoring the TCP normal operation. When network congestion occurs, ATCP sees the ECN bit set to one and transitions to congested state. In this state, ATCP does not interfere with TCP congestion control mechanisms. Finally, when a route failure occurs, a destination unreachable message is issued by ICMP. Upon receiving this message, ATCP puts TCP into persist mode and transitions to the disconnected state. While in the persist mode, TCP periodically sends probe packets. When the route is eventually reestablished, TCP is removed from persist mode and ATCP transitions back to the normal state.

19.6.5 Capacity of Ad Hoc Networks

The classical information theory introduced by Shannon (Shannon, 1948) presents the theoretical results on the channel capacity, that is, how much information can be transmitted over a noisy and limited communication channel. In ad-hoc networks, this problem is led to a higher level of difficulty for the capacity now must be investigated in terms of several transmitters and several receivers. The analysis of the capacity of wireless networks has a similar objective as that of the classical information theory: to estimate the limit of how much information can be transmitted and to determine the optimal operation mode, so that this limit can be achieved. A first attempt to calculate these bounds is made by Gupta and Kumar in (Gupta, 2000). In this work, the authors propose a model for studying the capacity of a static ad hoc network (i.e., nodes do not move), based on the following scenario. Suppose that nodes are located in a region of area 1. Each node can transmit at bits per second over a common wireless channel. Packets are sent from node to node in a multi-hop fashion until their final destination is reached and they can be buffered at intermediate nodes while waiting for transmission. Two types of network configurations are considered: arbitrary networks, where the node locations, traffic destinations, rates, and power level are all arbitrary; and random networks, where the node locations and destinations are random, but they have the same transmit power and data rate. Two models of successful reception over one hop are also proposed:

✁ Protocol Model—in which a transmission from node i to j , with a distance dij between them, is successful if dkj ≥ (1 + Υ) dij , that is, if the distance between nodes i and j is smaller than that of nodes k and j with both i and k transmitting to j simultaneously over the same channel. The quantity Υ > 0 models the guard zone specified by the protocol to prevent a neighboring node from simultaneous transmission.

✁ Physical Model—in which, for a subset T of simultaneous transmitting nodes, the transmission from a node i T is successfully received by node j if

image

with a minimum signal-to-interference ratio (SIR) β for successful receptions, noise power level N, transmission power level Pi for node i , and signal power decay α.

image

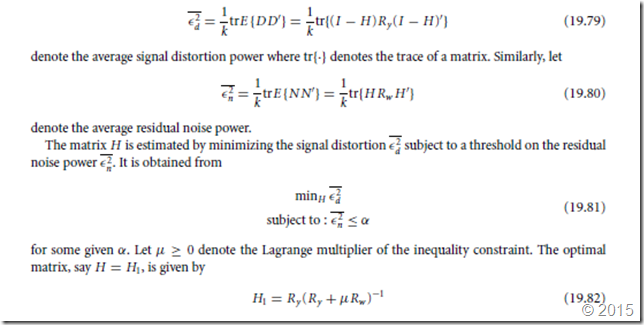
The transport capacity is so defined as the quantity of bits transported in a certain distance, measured in bit-meter. One bit-meter signifies that one bit has been transported over a distance of one meter toward its destination. With the reception models as described previously, the upper bounds for the transport capacity in arbitrary networks and the throughput per node in random networks were calculated. They are summarized in Table 19.5, where the Knuth’s notation has been used, that is, f (n) = τ(g (n)) denotes that f (n) = O(g (n)) as well as g (n) = O( f (n)). In Table 19.5, c and c t are constants which are functions of α and β. These results show that, for arbitrary networks, if the transport capacity is divided into equal parts among all nodes, the throughput per node will be τ(W/n) bits per second. This shows that, as the number of nodes increases, the throughput capacity for each node diminishes in a square root proportion. The same type of results holds for random networks. These results assume a perfect scheduling algorithm which knows the locations of all nodes and all traffic demands, and which coordinates wireless transmissions temporally and spatially to avoid collisions. Without these assumptions the capacity can be even smaller. Troumpis and Goldsmith (Toumpis, 2000) extend the analysis of upper limits of (Gupta, 2000) to a three dimensional topology, and incorporated the channel capacity into the link model. In this work, the nodes are assumed as uniformly distributed within a cube of volume 1 m3. The capacity C (n) follows the inequality

image

with probability approaching unity as n → ∞, and k1, k2 some positive constants. Equation Eq. (19.111) also suggests that, although the capacity increases with the number of users, the available rate per user decreases.

Case Studies on Capacity of Ad Hoc Networks

IEEE802.11

Li et al (Li, 2001) study the capacity of ad hoc networks through simulations and field tests. Again, the static ad hoc network is the basic scenario, which is justified by the fact that at most mobility scenarios nodes do not move significant distances during packet transmissions. The 802.11 MAC protocol is used to analyze the capacity of different configuration networks.

For the chain of nodes, the ideal capacity is 1/4 of the raw channel bandwidth obtainable from the radio (single-hop throughput). The simulated 802.11-based ad hoc network achieves a capacity of 1/7 of the single-hop throughput, because the 802.11 protocol fails to discover the optimum schedule of transmission and its backoff procedure performs poorly with ad hoc forwarding. The field experiment does not present different results from those obtained in the simulation. The same results are found for the lattice topology. For random networks with random traffic patterns, the 802.11 protocol is less efficient, but the theoretical maximum capacity of O(1/n) per node can be achieved.

It is also shown that the scalability of ad hoc networks is a function of the traffic pattern. In order for the total capacity to scale up with the network size, the average distance between source and destination nodes must remain small as the network grows. Therefore, the key factor deciding whether large networks are feasible is the traffic pattern. For networks with localized traffic the expansion is feasible whereas for networks in which the traffic must traverse it then the expansion is questionable.

Wireless Mesh Networks

A particular case of ad-hoc network, which is drawing significant attention, is the wireless mesh network (WMN). The main characteristic that differentiates a WMN from others ad-hoc networks is the traffic pattern: practically, all traffic is either to or from a node (gateway) that is connected to other networks (e.g. Internet). Consequently, the gateway plays a decisive role in the WMN: the greater the number of gateways the greater the capacity of this network as well as its reliability. Jun and Sichitiu (Jun, (Oct) 2003) analyze the capacity of WMNs with stationary nodes. Their work shows that the capacity of WMNs is extremely dependent on the following aspects:

✁ Relayed traffic and fairness—Each node in a WMN must transmit relayed traffic as well as its own. Thus, there is an inevitable contention between its own traffic and relayed traffic. In practice, as the offered load at each node increases, the nodes closest to the gateway tends to consume a larger bandwidth, even for a fair MAC layer protocol. The absolute fairness must be forced according to the offered load.

✁ Nominal capacity of MAC layer (B )—It is defined as the maximum achievable throughput at the MAC layer in one-hop network. It can be calculated as presented in (Jun (April) 2003).

✁ Link constraints and collision domains—In essence, all MAC protocols are designed to avoid collisions while ensuring that only one node transmits at a time in a given region. The collision domain is the set of links (including the transmitting one) that must be inactive for one link to transmit successfully.

The chain topology is first analyzed. It is observed that the node closer to the gateway has to forward more traffic than nodes farther away. For a n-node network and a per node generated load G , the link between the gateway and the node closer to it has to be able to forward a traffic equal to nG . The link between this node and the next node has to be able to forward traffic equal to (n − 1)G , and so on. The collision domains are identified and the bottleneck collision domain, which has to transfer the most traffic in the network, is determined. The throughput available for each node is bounded by the nominal capacity B divided by the total traffic of the bottleneck collision domain. The chain topology analysis can be extended to a two-dimensional topology (arbitrary network). The values obtained for the throughput per node are validated with simulation results.

These results lead to an asymptotic throughput per node of O (1/n). This is significantly worse than the results showed in Table 19.5, mainly because of the presence of gateways, which are the network bottlenecks.

Clearly, the available throughput improves with the increase of the number of gateways in the network.

Increasing the Capacity of Ad Hoc Networks

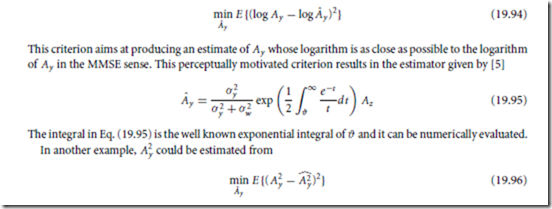
The expressions presented in Table 19.5 indicate the best performance achievable considering optimal scheduling, routing, and relaying of packets in the static networks. This is a bad result as far as scalability is concerned and encourages researches to pursue techniques that increase the average throughput. One ap- proach to increase capacity is to add relay-only nodes in the network. The major disadvantage of this scheme is that it requires a large number of pure relay nodes. For random networks under the protocol model with m additional relay nodes, the throughput available per node becomes image (Gupta, 2000). For example, in a network with 100 senders, at least 4476 relay nodes are needed to quintuplicate the capacity (Gupta, 2000). Another strategy is to introduce mobility into the model. Grossglauser and Tse (Grossglauser, 2001) show that it is possible for each sender-receiver pair to obtain a constant fraction of the total available bandwidth, which is independent of the number of pairs, at the expense of an increasing delay in the transmission of packets and the size of the buffers needed at the intermediate relay nodes. The same results are presented by Bansal and Liu (Bansal, 2003), but with low delay constraints and a particular mobility model similar to the random waypoint model (Bettstetter, 2002). However, mobility introduces new problems such as maintaining connectivity within the ad hoc network, distributing routing information, and establishing access control. (An analysis on the connectivity of ad hoc networks can be found at (Bettstetter, 2002).) The nodes can also be grouped into small clusters, where in each cluster a specific node (clusterhead) is designated to carry all the relaying packets (Lin, 1997). This can increase the capacity and reduce the impact of the transmission overhead due to routing and MAC protocols. On the other hand, the mechanisms to update the information in clusterheads generate additional transmissions, which reduces the effective node throughput.

References

Aggelou, G., Tafazolli, R., RDMAR: A Bandwidth-efficient Routing Protocol for Mobile Ad Hoc Networks, ACM International Workshop on Wireless Mobile Multimedia (WoWMoM), 1999, pp. 26–33. Balakrishnan, H., Padmanabhan, V.N., Seshan, S., Katz, R.H.A, A Comparison of Mechanisms for Improving TCP Performance over Wireless Links, IEEE/ACM Trans. on Networking, vol. 5, No. 6, pp. 756–769, December 1997.

Bansal, N. and Liu, Z. Capacity, Delay and Mobility in Wireless Ad-Hoc Networks, Proc. IEE Infocom ‘03, April 2003.

Basagni, S. et al., A Distance Routing Effect Algorithm for Mobility (DREAM), ACM/IEEE Int’l. Conf.

Mobile Comp. Net., pp. 76–84, 1998.

Bellur, B. and Ogier, R.G., A Reliable, Efficient Topology Broadcast Protocol for Dynamic Networks, Proc.

IEEE INFOCOM ’99, New York, March 1999.

Bettstetter, C., On the Minimum Node Degree and Connectivity of a Wireless Multihop Network, Proc.

ACM Intern. Symp. On Mobile Ad Hoc Networking and Computing (MobiHoc), June 2002.

Bluetooth SIG, Specification of the Bluetooth System, vol. 1.0, 1999, available at: http://www.bluetooth.

org.

Chandra, A., Gummalla, V., Limb, J.O., Wireless Medium Access Control Protocols, IEEE Communications Surveys and Tutorials [online], vol. 3, no. 2, 2000, available at: http://www.comsoc.org/pubs/surveys/.

Chandran, K., Raghunathan, S., Venkatesan, S., Prakash, R., A Feedback-Based Scheme for Improving TCP Performance in Ad Hoc Wireless Networks, IEEE Personal Communications, pp. 34–39, February 2001.

Chao, C.M., Sheu, J.P., Chou, I-C., A load awareness medium access control protocol for wireless ad hoc network, IEEE International Conference on Communications, ICC’03, vol. 1, 11–15, pp. 438–442, May 2003.

Chatschik, B., An overview of the Bluetooth wireless technology, IEEE Communications Magazine, vol.

39, no. 12, pp. 86–94, Dec. 2001.

Chen, T.-W., Gerla, M., Global State Routing: a New Routing Scheme for Ad-hoc Wireless Networks, Proceedings of the IEEE ICC, 1998.

Chiang, C.-C. and Gerla, M., Routing and Multicast in Multihop, Mobile Wireless Networks, Proc. IEEE ICUPC ’97, San Diego, CA, Oct. 1997.

Corson, M.S. and Ephremides, A., A Distributed Routing Algorithm for Mobile Wireless Networks, ACM/Baltzer Wireless Networks 1, vol 1, pp. 61-81, 1995.

Das, S., Perkins, C., and Royer, E., Ad Hoc on Demand Distance Vector (AODV) Routing, Internet Draft, draft-ietf-manet-aodv-11.txt, 2002.

Dube, R., Rais, C., Wang, K., and Tripathi, S., Signal Stability Based Adaptive Routing (SSA) for Ad Hoc Mobile Networks, IEEE Personal Communication 4, vol 1, pp. 36–45, 1997.

Fang, J.C. and Kondylis, G.D., A synchronous, reservation based medium access control protocol for multihop wireless networks, 2003 IEEE Wireless Communications and Networking, WCNC 2003, vol. 2, 16–20. March 2003, pp. 994–998.

Fitzek, F.H.P., Angelini, D., Mazzini, G., and Zorzi, M., Design and performance of an enhanced IEEE 802.11 MAC protocol for multihop coverage extension, IEEE Wireless Communications, vol. 10, no.

6, pp. 30–39, Dec. 2003.

Floyd, S., TCP and Explicit Congestion Notification, ACM Computer Communication Review, vol. 24, pp. 10–23, October 1994.

Fu, Z., Zerfos, P., Luo, H., Lu, S., Zhang, L., and Gerla, M., The Impact of Multihop Wireless Channel on TCP Throughput and Loss, IEEE INFOCOM, pp. 1744–1753, 2003.

Garcia-Luna-Aceves, J.J. and Marcelo Spohn, C., Source-tree Routing in Wireless Networks, Proceedings of the Seventh Annual International Conference on Network Protocols, Toronto, Canada, p. 273, October 1999.

Garcia-Luna-Aceves, J.J. and Tzamaloukas, A., Reversing the Collision-Avoidance Handhske in Wireless Networks, ACM/IEEE MobiCom’99, pp. 15–20, August 1999.

Goodman, D.J., Valenzuela, R.A., Gayliard, K.T., Ramamurthi, B., Packet reservation multiple access for local wireless communications, IEEE Transactions on Communications, vol. 37, no. 8, pp. 885–890, Aug. 1989.

Grossglauser, M. and Tse, D., Mobility Increases the Capacity of Ad Hoc Wireless Networks, Proc. IEE Infocom ‘01, April 2001.

Gu¨nes, M., Sorges, U., and Bouazizi, I., ARA–The Ant-colony Based Routing Algorithm for Manets, ICPP Workshop on Ad Hoc Networks (IWAHN 2002), pp. 79–85, August 2002.

Gupta, P. and Kumar, P.R., The Capacity of Wireless Networks, IEEE Trans. Info. Theory, vol. 46, March 2000.

Haas, Z.J. and Deng, J., Dual busy tone multiple access (DBTMA)—a multiple access control scheme for ad hoc networks, IEEE Transactions on Communications, vol. 50, no. 6, pp. 975–985, June 2002.

Haas, Z.J. and Pearlman, R., Zone Routing Protocol for Ad-hoc Networks, Internet Draft, draft-ietf- manet-zrp-02.txt,1999.

Holland, G. and Vaidya, N., Analysis of TCP Performance over Mobile Ad Hoc Networks, Wireless Networks, Kluwer Academic Publishers, vol. 8, pp. 275–288, 2002.

Huston, G., TCP in a Wireless World, IEEE Internet Computing, pp. 82–84, March–April, 2001.

IEEE 802.11 WG, Wireless LAN Medium Access Control (MAC) and Physical Layer (PHY) Specifications, IEEE/ANSI Std. 802-11, 1999 edn.

IEEE 802.11 WG, Wireless LAN Medium Access Control (MAC) and Physical Layer (PHY) Specifications:

high-speed physical layer in the 5 GHz band, IEEE Std. 802-11a.

IEEE 802.11 WG, Wireless LAN Medium Access Control (MAC) and Physical Layer (PHY) Specifications:

higher-speed physical layer extension in the 2.4 GHz band, IEEE Std. 802-11b.

IEEE 802.11 WG, Wireless LAN Medium Access Control (MAC) and Physical Layer (PHY) Specifications:

Medium Access Control (MAC) Enhancements for Quality of Service (QoS), IEEE Draft Std.

802.11e/D5.0, August 2003.

Iwata, A. et al., Scalable Routing Strategies for Ad-hoc Wireless Net-works, IEEE JSAC, pp. 1369–179, August. 1999.

Jacquet, P., Muhlethaler, P., Clausen, T., Laouiti, A., Qayyum, A., and Viennot, L., Optimized Link State Routing Protocol for Ad Hoc Networks, IEEE INMIC, Pakistan, 2001.

Jiang, M., Ji, J., and Tay, Y.C., Cluster based routing protocol, Internet Draft, draft-ietf-manet-cbrp-spec- 01.txt, 1999.

Jiang, S., Rao, J., He, D., Ling, X., and Ko, C.C., A simple distributed PRMA for MANETs, IEEE Transactions on Vehicular Technology, vol. 51, no. 2, pp. 293–305, March 2002.

Joa-Ng, M. and Lu, I.-T., A Peer-to-peer Zone-based Two-level Link State Routing for Mobile Ad Hoc Networks, IEEE Journal on Selected Areas in Communications 17, vol. 8, pp. 1415–1425, 1999.

Johnson, D., Maltz, D., and Jetcheva, J., The Dynamic Source Routing Protocol for Mobile Ad Hoc Networks, Internet Draft, draft-ietf-manet-dsr-07.txt, 2002.

Jun, J. and Sichitiu, M.L., The Nominal Capacity of Wireless Mesh Networks, IEEE Wireless Communications, October 2003.

Jun, J., Peddabachagari, P., and Sichitiu, M.L., Theoretical Maximum Throughput of IEEE 802.11 and its Applications, Proc. 2nd IEEE Int’l Symp. Net. Comp. and Applications, pp. 212–25, April 2003.

Jurdak, R., Lopes, C.V., and Baldi, P., A Survey, Classification and Comparative Analysis of Medium Access Control Protocols for Ad Hoc Networks, IEEE Communications Surveys and Tutorials [online], vol. 6, no. 1, 2004. available at: http://www.comsoc.org/pubs/surveys/.

Kasera, K.K. and Ramanathan, R., A Location Management Protocol for Hierarchically Organized Multihop Mobile Wireless Networks, Proceedings of the IEEE ICUPC’97, San Diego, CA, pp. 158–162, October 1997.

Ko, Y.-B., Vaidya, N.H., Location-aided Routing (LAR) in Mobile Ad Hoc Networks, Proceedings of the Fourth Annual ACM/IEEE International Conference on Mobile Computing and Networking (Mobicom’98), Dallas, TX, 1998.

Li, J., Blake, C., De Couto, D.S.J., Lee, H.I., and Morris, R., Capacity of Ad Hoc Wireless Networks, Proc.

7th ACM Int’l Conf. Mobile Comp. and Net., pp. 61–69, July 2001.

Lin, C.R. and Gerla, M., Adaptative Clustering for Mobile Wireless Networks, IEEE Journal on Selected Ares in Communications, vol. 15, pp. 1265–1275, September 1997.

Mangold, S., Sunghyun Choi, Hiertz, G.R., Klein, O., and Walke, B., Analysis of IEEE 802.11e for QoS support in wireless LANs, IEEE Wireless Communications, vol. 10, no. 6, pp. 40–50, December 2003.

Muqattash, A. and Krunz, M., Power controlled dual channel (PCDC) medium access protocol for wireless ad hoc networks, 22nd. Annual Joint Conference of the IEEE Computer and Communications Societies, INFOCOM 2003, vol. 1, pp. 470–480, 30 March–3 April 2003.

Murthy, S. and Garcia-Lunas-Aceves, J.J., An Efficient Routing Protocol for Wireless Networks, ACM Mobile Networks and App. J., Special Issue on Routing in Mobile Communication Networks, pp. 183–197, Oct. 1996.

Nikaein, N., Laboid, H., and Bonnet, C., Distributed Dynamic Routing Algorithm (DDR) for Mobile Ad Hoc Networks, Proceedings of the MobiHOC 2000:First Annual Workshop on Mobile Ad Hoc Networking and Computing, 2000.

Ogier, R.G. et al., Topology Broadcast based on Reverse-Path Forwarding (TBRPF), draft-ietf-manet-tbrpf-05.txt, INTERNET-DRAFT, MANET Working Group, March 2002.

Park, V.D. and Corson, M.S., A Highly Adaptive Distributed Routing Algorithm for Mobile Wireless Networks, Proceedings of INFOCOM, April 1997.

Pei, G., Gerla, M., and Chen, T.-W., Fisheye State Routing: A Routing Scheme for Ad Hoc Wireless Networks, Proc. ICC 2000, New Orleans, LA, June 2000.

Pei, G., Gerla, M., Hong, X., and Chiang, C., A Wireless Hierarchical Routing Protocol with Group Mobility, Proceedings of Wireless Communications and Networking, New Orleans, 1999.

Perkins, C.E. and Bhagwat, P., Highly Dynamic Destination-Sequenced Distance-Vector Routing (DSDV) for Mobile Computers, Comp. Commun. Rev., pp. 234–244, Oct. 1994.

Postel, J., Transmission Control Protocol, IETF RFC 793, September 1981.

Radhakrishnan, S., Rao, N.S.V., Racherla, G., Sekharan, C.N., and Batsell, S.G., DST–A Routing Protocol for Ad Hoc Networks Using Distributed Spanning Trees, IEEE Wireless Communications and Networking Conference, New Orleans,1999.

Raju, J. and Garcia-Luna-Aceves, J., A New Approach to On-demand Loop-free Multipath Routing, Proceedings of the 8th Annual IEEE International Conference on Computer Communications and Networks (ICCCN), pp. 522–527, Boston, MA, October 1999.

Santivanez, C., Ramanathan, R., and Stavrakakis, I., Making Link-State Routing Scale for Ad Hoc Networks, Proc. 2001 ACM Int’l. Symp. Mobile Ad Hoc Net. Comp., Long Beach, CA, October 2001.

Schiller, J., Mobile Communications, Addison-Wesley, Reading, MA, 2000.

Shakkottai, S., Rappaport, T.S., and Karlsson, P.C, Cross-Layer Design for Wireless Networks, IEEE Communications Magazine, pp. 74–80, October 2003.

Shannon, C.E., A mathematical theory of communication, Bell System Technical Journal, vol. 79, pp. 379–423, July 1948.

Su, W. and Gerla, M., IPv6 Flow Handoff in Ad-hoc Wireless Networks Using Mobility Prediction, IEEE Global Communications Conference, Rio de Janeiro, Brazil, pp. 271–275, December 1999.

Talucci, F., Gerla, M., and Fratta, L., MACA-BI (MACA By Invitation)-a receiver oriented access protocol for wireless multihop networks, 8th IEEE International Symposium on Personal, Indoor and Mobile Radio Communications, PIMRC’97, Vol. 2, pp. 435–439, 1-4 Sept. 1997.

Tang, K., Gerla, M., and Correa, M., Effects of Ad Hoc MAC Layer Medium Access Mechanisms under TCP, Mobile Networks and Applications, Kluwer Academic Publishers, Vol. 6, pp. 317–329, 2001.

Toh, C., A Novel Distributed Routing Protocol to Support Ad-hoc Mobile Computing, IEEE 15th Annual International Phoenix Conf., pp. 480–486, 1996.

Toumpis, S. and Goldsmith, A., Ad Hoc Network Capacity, Conference Record of Thirty-fourth Asilomar Conference on Signals Systems and Computers, Vol 2, pp. 1265–1269, 2000.

Tseng, Y.C. and Hsieh, T.Y., Fully power-aware and location-aware protocols for wireless multi-hop ad hoc networks, 11th. International Conference on Computer Communications and Networks, pp. 608–613, 14–16 Oct. 2002.

Woo, S.-C. and Singh, S., Scalable Routing Protocol for Ad Hoc Networks, Wireless Networks 7, Vol. 5, 513–529, 2001.

Xu, S. and Saadawi, T., Does the IEEE 802.11 MAC Protocol Work Well in Multihop Wireless Ad Hoc Networks? IEEE Communications Magazine, pp. 130–137, June 2001.

Xylomenos, G., Polyzos, G. C., Mahonen, P., and Saaranen, M., TCP Performance Issues over Wireless Links, IEEE Communications Magazine, Vol. 39, No. 4, pp. 53–58, April 2001.


Ad Hoc Networks : Medium Access Protocols.

19.6.1 Medium Access Protocols

Medium access control (MAC) for wireless ad hoc networks is currently a very active research topic. The characteristics of the network, the diverse physical-layer technologies available, and the range of services envisioned render a difficult task the design of an algorithm to discipline the access to the shared medium that results efficient, fair, power consumption sensitive, and delay bound. A number of issues distinguish wireless MAC protocols from those used in wireline networks (Chandra, 2002), as quoted next.

Half-duplex operation. Due to self-interference (i.e., the energy from the transmitter that leaks into the receiver), it is difficult to construct terminals able to receive while transmitting. Therefore collision detection while sending data is not possible and Ethernet-like protocols cannot be used. Since collisions cannot be detected, wireless MAC protocols use collision avoidance mechanisms to minimize the probability of collision. Time varying channel. In multipath fading channels, the received signal is the sum of time-shifted and attenuated copies of the transmitted signal. With the change of the channel characteristics as well as in the relative position of terminals, the signal envelope varies as a function of time. The signal experiences fading that may be severe. The nodes establishing a wireless link need to sense the channel so as to assess the communication link conditions.

Burst channel errors. Wireless channels experience higher bit error rate than wireline transmissions.

Besides, errors occur in bursts as the signal fades, resulting in high probability of packet loss. Therefore, an acknowledgement mechanism must be implemented so that the packet retransmission may be possible in case of packet loss.

Location-dependent carrier sensing. Because the signal strength decays with distance according to a power law, only nodes within a specific range are able to communicate. This gives rise to the hidden and exposed terminals and the capture effect, as described next.

Hidden terminal. Refer to Fig. 19.51 where the relative positions of terminals A, B, and C are shown. B is within range of both A and C but A and C are out of range of each other. If terminal A is transmitting to B and terminal C wishes to transmit to B, it incorrectly senses that the channel is free because it is out of range of A, the current transmitter. If C starts transmitting it interferes with the reception at B. In this case C is termed the hidden terminal to A. The hidden terminal problem can be minimized with the use of the request-to-sent/clear-to-send (RTS/CTS) handshake protocol (to be explained later) before the data transmission starts.

Exposed terminal. An exposed terminal is one that is within range of the transmitter but out of range of the receiver. In Fig. 19.51, if terminal B is transmitting to A and terminal C senses the channel it perceives it as busy. However, since it is out of range of terminal A it cannot interfere with the current conversation.

image

Therefore it can utilize the channel to establish a parallel link with another terminal that is out of range of B, for instance, terminal D. In this case C is termed the exposed terminal to B. Exposed terminals may result in under-usage of the channel. As in the hidden terminal problem, this also can be minimized with the use of the RTS/CTS handshake protocol.

Capture. Capture at a given terminal occurs in case among several simultaneous signals arriving at it the signal strength of one of them prevails over all of the others combined. In Fig. 19.51, terminals C and E are both within range of terminal B. If C and E are transmitting the interference may result in a collision at B. However, B may be able to receive successfully if one of the signals is much higher than the other, for instance, the signal from E. Capture can improve throughput because it results in less collisions. However, it favors senders that are closer to the intended destination, which may cause unfair allocation of the channel.

From the above considerations, it is promptly inferred that the design of a MAC protocol for ad hoc networks requires a different set of parameters must be considered as compared with those of the wireline systems.

Protocols Categories

Jurdak et al. (Jurdak, 2004), after conducting a survey and analysis of a number of current MAC protocol proposals, offer a set of key features that may be used in order to classify MAC protocols for ad hoc networks.

Channel separation and access. The way the medium is organized is an important issue in the protocol design. For instance, all stations may share a single channel, which they use for control and data transmissions. On the other hand, the medium may be divided into multiple channels, in general one for control and the others for data. The single channel approach was favored in earlier MAC designs because of its simplicity. However, it is intrinsically subject to collisions and it does not perform well in medium to heavy traffic conditions. Particularly at heavy loads, simulations show that single channel protocols are prone to increased number of collisions of control packets, for example, RTS and CTS, which cause increased back off delays while the medium is idle (Tseng, 2002). The choice for multiple channels brings the issue of how to separate these channels. The most common ways of separating channels make use of FDMA, TDMA, and CDMA technologies. Frequency division multiple access (FDMA) uses multiple carriers to divide the medium into several frequency slots. It allows multiple transmissions to occur simultaneously although each sender can use only the bandwidth of its assigned frequency slot. Time division multiple access (TDMA) divides the medium into fixed length time slots. A group of slots forms a time frame and defines the slot repetition rate. Because of its periodic nature, TDMA protocols are suitable to delay sensitive traffic. In TDMA, a sender uses the whole available bandwidth for the duration of a slot assigned to it. In addition, to access the medium terminals need to keep track of frames and slots and, as a result, TDMA protocols require synchronization among terminals. Code division multiple access (CDMA) allows

senders to use the whole available bandwidth all the time. Each sender is assigned one of several orthogonal codes and simultaneous transmissions are possible for users are identified by their unique code. A general requirement in CDMA is for power control. The reason behind it is that an unwanted signal that is stronger than the desired signal may overwhelm it at the receiver’s antenna. This is known as the near-far effect. space division multiple access (SDMA), similarly to CDMA, aims at allowing senders to use the whole available bandwidth all the time. However, the terminals use directional antennas and are allowed to start transmission only if the desired transmission’s direction does not interfere with an ongoing conversation. RTS/CTS handshake. Many MAC protocols for ad hoc networks use variants of the RTS/CTS handshake. The original three-way handshake minimizes both the hidden and exposed terminal problems. A terminal wishing to send data first senses the channel. If the channel is idle for the appropriate amount of time, the terminal sends a short request-to-send (RTS) packet. All terminals on hearing the RTS defer their transmissions. The destination responds with a clear-to-send (CTS) packet. All terminals on hearing the CTS also defer their transmissions. The sender, on receiving the CTS assumes the channel is acquired and initiates the data transmission.

Topology. Ad hoc networks have a large degree of flexibility and uncertainty. Terminals may be mobile and have distinct capabilities and resources. The network must take this into account and adapt dynamically while optimizing performance and minimizing power consumption (Jurdak, 2004). A network topology can be centralized, clustered, or flat. Centralized topologies have a single terminal or base station that controls and manages the network. The central terminal may be responsible for broadcasting information relevant to the operation of the network. In addition, terminals may only communicate through the central terminal. Clustered topologies create a local version of a centralized network where one terminal assumes some or all of the duties expected from the central terminal. Flat topologies implement a fully distributed approach where all terminals are at the same level, and central control is not used. Flat topologies are further divided into single-hop and multiple-hop. Single-hop assumes that the destination node is within range of the sender. Multiple-hop assumes that the destination node may be beyond the sender’s reachable neighbors. In this case, intermediate terminals are responsible for relaying the packets until they reach the intended destination. Single-hop protocols are simpler but pose limitations on the size of the network.

Multiple-hop adds scalability to the network at the expense of higher complexity.

Power. Power consumption is a relevant issue for all wireless networks. Power conservation is particularly influential for the mobile terminals because of the limited battery power available. An efficient power conservation strategy involves several aspects. The energy used to transmit the signal represents a large share of the power consumption. Ideally the transmit power used should be just enough to reach the intended destination. Another source of wasted energy is the long periods of time terminals need to spend sensing the channel or overhearing irrelevant conversation. If terminals are able to learn in advance about when the medium will be unavailable they may decide to go into a sleep mode for that period of time in order to save energy. The network behavior may be influenced by the terminals’ battery power level, for instance, in the selection of a cluster head or in assigning transmission priorities. Terminals aware of their battery level may adjust their behavior accordingly. The exchange of control messages before the data transmission phase also represents power wastage. Reduced control overhead should therefore be pursued for the sake of power efficiency.

Transmission initiation. Intuitively, it is expected that a terminal wishing to start a conversation must initiate the transmission. And, in fact, most of the protocols are organized this way. However, a receiver- initiated protocol may be more suitable to some specialized networks, for instance, a sensor network. In receiver-initiated protocols the receiver polls its neighbors by sending a ready-to-receive (RTR) packet, which indicates its readiness to receive data. If the receiver is able to know or successfully predict when a neighbor wishes to send its data, this class of protocols actually produces better performance. However, for generalized networks and unpredictable traffic, sender-initiated protocols are still a better choice.

Traffic load and scalability. Protocols are usually optimized for the worst expected scenario. Sparse node distribution and light traffic conditions do not pose a challenge for the implementation of ad hoc networks. The protocols are optimized for high traffic load, high node density, and/or real-time traffic, depending on the intended use. Protocols that offer the possibility of channel reservation are those with best performance on both high load and real-traffic situations. Receiver-initiated approaches also tend to work well in high load conditions because there is a high probability that RTR packets reach terminals wishing to send data. If the network ranks terminals and traffic, then it is able to assign priorities based on the traffic nature. Therefore, it can offer favored handling of real-time traffic. Dense networks tend to suffer from higher interference because of the proximity of transmitting nodes. For this reason the use of power control makes a significant difference in the performance of the network.

Range. Transmission range is the distance from the transmitter’s antenna that the radio signal strength still remains above the minimum usable level. Protocols can be classified (Jurdak, 2004) as very short-range (range up to 10 m), short-range (from 10 up to 100 m), medium-range (from 100 up to 1000 m), and long-range (from 1000 m). There is a trade-off between increasing the transmission range and achieving high spatial capacity that needs to be negotiated during the protocol design.

Industry Standard Protocols

IEEE 802.11

The family of IEEE 802.11 standards (IEEE, 1999a; IEEE, 1999b; IEEE, 1999c) can be viewed as a wireless version of the local area network (LAN) protocol Ethernet. The 802.11a standard operates in the unlicensed 5 GHz band and offers data rates up to 54 Mb/s. The commercially popular 802.11b operates in the industrial, scientific, and medical (ISM) band at 2.4 GHz and offers data rates up to 11 Mb/s. The current activity of the 802.11-working group is toward quality of service (QoS) (802.11e, described later) and security (802.11i). The 802.11 standards focus on the specification of the MAC and physical (PHY) layers. While their PHY layers differ, existing 802.11 standards rely on the same medium access mechanisms. The basic (and mandatory) access mechanism is referred to as distributed coordination function (DCF). The optional point coordination function (PCF) is an access mechanism in which a central node (the access point) polls terminals according to a list. DCF is available for both flat ad hoc and centralized topologies whereas PCF is only available in centralized configurations. MAC offers two types of traffic services. The mandatory asynchronous data service is based on the best effort and is suited to delay insensitive data. The optional time-bound service is implemented using PCF.

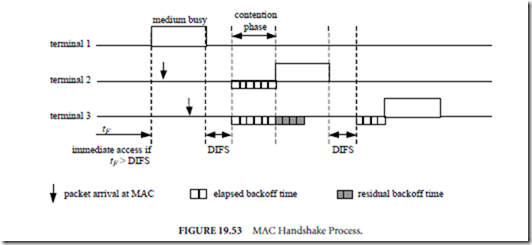
DCF uses the listen-before-talk scheme based on carrier sense multiple access (CSMA). A terminal wishing to transmit a data packet first monitors the medium activity. If the channel is detected idle the terminal waits for a DCF interframe space (DIFS) time interval (34 us in 802.11a). If the channel remains idle during the DIFS period, the terminal starts transmitting its packet immediately after DIFS has expired. The transmission is successfully completed when the sender receives an acknowledgement (ACK) packet from the destination. However, if the channel is sensed busy a collision avoidance procedure is used. In this procedure, after sensing the channel idle again for a DIFS period, the terminal wishing to transmit waits an additional random backoff time. The terminal then initiates its transmission if the channel remains idle during this additional time. The backoff time is a multiple of the slot time (9 us in 802.11a) and it is determined individually and independently by each station. A random number between zero and contention window (CW) is selected for any new transmission attempt. The back off time is decremented while the medium is in contention phase and frozen otherwise. Thus the backoff time may be carried over for several busy cycles of the medium before it expires. Refer to Fig. 19.52 for an example of the backoff

image

procedure. The initial value for CW is CWmin (15 for 802.11a) and since all terminals operate with the same CWmin value they all have the same initial medium access priority. After any failed transmission, that is, when the transmitted packet is not acknowledged, the sender doubles its CW up to a maximum defined by CWmax (1023 in 802.11a). A now larger CW decreases the probability of collisions if multiple terminals are trying to access the medium. To reduce the hidden terminal problem, 802.11 optionally uses the RTS/CTS handshake. Both RTS and CTS packets include information on how long the data frame transmission is going to last, including the corresponding ACK. Terminals receiving either the RTS or CTS use this information to start a timer, called network allocation vector (NAV), which informs the period of time the medium is unavailable. Between consecutive frames RTS and CTS, and a data frame and its ACK, the short interframe space (SIFS) (16 us in 802.11) is used. SIFS is shorter than DIFS and therefore gives the terminals sending these frames priority to access the medium.

HIPERLAN 1

High Performance LAN type 1 (HIPERLAN 1) is a wireless LAN standard operating in the 5 GHz band, which offers data rate up to 23.5 Mb/s to mobile users in either clustered ad hoc or centralized topology. HIPERLAN 1 offers asynchronous best effort and time-bound services with hierarchical priorities. There are five priority values defined, from zero (highest) to four (lowest). Each individual MAC protocol data unit (PDU) is assigned a priority that is closely related to its normalized residual lifetime (NRL) value. The NRL is an estimation of the time-to-live the PDU has considering the number of hops it still has to travel. A PDU is discarded if its NRL value reaches zero. In addition, some terminals are designed forwarders and are responsible to relay data to distant nodes in a multi-hop fashion. HIPERLAN 1 allows terminals to go into sleep mode in order to save energy. These terminals, called p-savers, inform support terminals, called p-supporters, of their sleep/wake-up patterns. p-supporters then buffer packets directed to p-savers terminals, as required. Although it has some interesting features, HIPERLAN 1 has not been a commercial success. The channel access mechanism used in HIPERLAN 1 is the elimination-yield non- preemptive priority access (EY-NPMA). It comprises three phases: prioritization (determine the highest priority data packets to be sent); contention (eliminate all contenders except one); and transmission. During the prioritization phase, time is divided in five minislots, numbered sequentially from zero to four. A terminal wishing to transmit has to send a burst during the minislot corresponding to its MAC PDU priority. For example, a terminal with a priority two PDU monitors the medium during minislots zero and one before it can assert its intention by transmitting a burst during minislot two. If the medium becomes busy during either minislot zero or one this terminal defers its transmission. Once a burst is transmitted, the prioritization phase ends and only terminals having PDUs at the same priority level remains in the dispute. The contention phase follows. It starts with the contending terminals transmitting an elimination burst. The individual terminals select the burst length, varying from 0 to 12 minislots, at random and independently. After transmitting the burst the terminals sense the medium. If it is busy they defer their transmissions. Otherwise, the remaining terminals enter the yield listening period. They select at random and independently a value between 0 and 9 and start monitoring the medium. If at the end of this period the medium is still idle the terminal assumes it has won the contention and is allowed to transmit its data. Otherwise, it defers its transmission. It is clear that the mechanism does not allow any lower priority packet to be sent if another with higher priority packet is waiting. At the same time the mechanism does not totally eliminate the possibility of collision but reduces it considerably. Similarly to IEEE 802.11, if the medium has been idle for a time longer than the interframe period a terminal wishing to transmit can bypass the EY-NPMA and transmit immediately.

Bluetooth

Bluetooth (Bluetooth, 1999) is a wireless protocol using the license-free ISM band to connect mobile and desktop devices such as computers and computers peripherals, handheld devices, cell phones, etc. The aim is to produce low-cost, low-power, and very-short range devices able to convey voice and data transmissions at a maximum gross rate of 1 Mb/s. Bluetooth uses frequency hopping spread spectrum (FHSS) with 1600 hops/s. For voice, a 64 kb/s full-duplex link called synchronous connection oriented (SCO) is used. SCO assigns a periodic single slot to a point-to-point conversation. Data communication uses the best effort asynchronous connectionless (ACL) link in which up to five slots can be assigned. Terminals in Bluetooth are organized in piconets. A piconet contains one terminal identified as the master and up to seven other active slaves. The master determines the hopping pattern and the other terminals need to synchronize to the piconet master. When it joins a piconet, an active terminal is assigned a unique 3-bit long active member address (AMA). It then stays in either transmit state, when it is engaged in a conversation, or connected state. Bluetooth supports three low-power states: park, hold, and sniff. A parked terminal releases its AMA and is assigned one of the 8-bit long parked member address (PMA). Terminals in the hold and sniff states keep their AMA but have limited participation in the piconet. For instance, a terminal in the hold state is unable to communicate using ACL. A terminal not participating in any piconet is in stand-by state. Bluetooth piconets can co-exist in space and time and a terminal may belong to several piconets. A piconet is formed when its future master starts an inquiry process, that is, inquiry messages are broadcast in order to find other terminals in the vicinity. After receiving inquiry responses the master may explicitly page terminals to join the piconet. If a master knows already another terminal’s identity it may skip the inquiry phase and page the terminal directly. Bluetooth uses time division duplex (TDD) in which master and slave alternate the opportunity to transmit. A slave can only transmit if the master has just transmitted to it, that is, slaves transmit if polled by the master. Transmissions may last one, three, or five slots although only single-slot transmission is a mandatory feature.

IEEE 802.11e

The IEEE 802.11e is an emerging MAC protocol, which defines a set of QoS features to be added to the 802.11 family of wireless LAN standards. Currently there is a draft version of the specifications (IEEE, 2003). The aim is to better serve delay-sensitive applications, such as voice and multi-media. In 802.11e, the contention-based medium access is referred to as enhanced distributed channel access (EDCA). In order to accommodate different traffic priorities, four access categories (AC) have been introduced. To each AC corresponds a backoff entity. The four distinct parallel backoff entities present in each 802.11e terminal are called (from highest to lowest priority): voice, video, best effort, and background. For the sake of comparison, existing 802.11/a/b standards define only one backoff entity per terminal. Each backoff entity has a distinct set of parameters, such as CWmin, Cwmax, and the arbitration interframe space (AIFS). AIFS is at least equal to DIFS and can be enlarged if desired. Another feature added to 802.11e is referred to as transmission opportunity (TxOP). A TxOP defines a time interval, which a back off entity can use to transmit data. It is specified by its starting time and duration, and the maximum length is AC dependent. The protocol also defines the maximum lifetime of each MAC service data unit (MSDU), which is also AC dependent. Once the maximum lifetime has elapsed, the MSDU is discarded. Finally, the protocol allows for the optional block acknowledgement in which a number of consecutive MSDUs are acknowledged with a single ACK frame.

Other Protocols

PRMA—Packet reservation multiple access (Goodman, 1989). In PRMA, the medium is divided into slots and a group of N slots forms a frame. Slots are either reserved or available. The access to the medium is provided by means of the slotted-ALOHA protocol. Data may be either periodic or sporadic, and this is informed in the header of the packet. Terminals are allowed to reserve a slot when they have periodic data to transmit. Once the central node successfully acknowledges the periodic packet, the terminal assumes the slot is reserved and uses it without contention. When the terminal stops sending periodic information then the reserved slot is released. PRMA assumes the existence of a central node but the mechanism can be adapted to other topologies (Jiang, 2002).

MACA-BI—Multiple access with collision avoidance by invitation (Talucci, 1997). In MACA-BI, the receiver polls a prospective sender by transmitting a ready-to-receive (RTR) packet. (This is an example of a receiver-initiated protocol.) In order to perform the polling in a timely fashion the receiver is required to correctly predict the traffic originated by the sender. Periodic traffic makes this task easier. In case either the data buffer or the delay at the terminal increases above a certain threshold this terminal may trigger a

image

conversation by transmitting an RTS packet. Improvements to MACA-BI are proposed in (Garcia, 1999), in which RIMA-SP–receiver initiated multiple access with simple polling –, and RIMA-DP–Receiver initiated multiple access with dual-purpose polling–are introduced. Both protocols render the RTR-data handshake collision free. RIMA-DP gives an additional purpose to the RTR packet: a request for transmission from the polling terminal. After a reservation phase both terminals can exchange data between them.

DBTMA—Dual busy tone multiple access (Haas, 2002). In DBTMA, the RTS/CTS handshake is replaced by two out-of-band busy tones, namely: BTt (transmit busy tone) and BTr (receive busy tone). When a terminal has data to transmit, it first senses the presence of the BTt and BTr tones. If the medium is free (no busy tone detected), the terminal turns on the BTt, sends an RTS packet, and turns off the BTt. As in other protocols, there is a random backoff time if the medium is busy. The destination terminal, upon receipt of an RTS addressed to it, turns on the BTr and waits for the data. Once the BTr tone is sensed, the sender assumes it has successfully acquired the medium. After waiting a short time (for the BTr to propagate) it transmits the data packet. On successful reception of the data packet the destination terminal turns off the BTr tone, completing the conversation. If no data are received, the BTr tone is turned off after a timer expires at the destination terminal.

Fitzek et al. (Fitzek, 2003) proposes a multi-hop MAC protocol based on the IEEE 802.11. A common channel conveys signaling and dedicated channels carry the data traffic and the ACK packets. Figure 19.53 presents the proposed MAC handshake. The first RTS packet is used to contact the destination and assess its willingness to receive data. The sender includes a list of idle dedicated channels, which is used by the destination terminal to select the dedicated channel. It then transmits this information to the sender in a CTS packet. If no suitable dedicated channel is available the handshake ends. After receiving the CTS packet, the sender transmits a PROBE packet on the dedicated channel. The destination terminal uses this packet to test the channel conditions. It then sends a second CTS packet on the common channel informing about the chosen coding/modulation scheme. The sender to confirm the parameters chosen transmits a second RTS packet. Although at a higher complexity cost, the authors claim that the proposed scheme outperforms the original 802.11.

LA-MAC—Load awareness MAC (Chao, 2003). In LA-MAC, the protocol switches between contention- based and contention-free mechanisms depending on the traffic volume. Contention-based mechanisms are best suited to light traffic conditions in which the probability of collision while attempting to gain the medium is small. For heavy traffic a contention-free mechanism allows higher and more evenly distributed throughput. In (Chao, 2003), the IEEE 802.11 DCF is adopted during contention-based periods while contention-free periods use a token passing protocol. The traffic load is measured by the delay packets are experiencing. Each terminal for the packets it has to transmit computes such delay. During a contention- based period, before a terminal transmits its data packet, it checks the packet’s current delay. If the delay is greater than a pre-defined threshold A the terminal creates a token and transmits it attached to the data packet. This indicates to all terminals the start of a contention-free period. Once the delay has fallen below another pre-defined threshold B, the terminal about to transmit removes the token. This indicates the end of the contention-free period and the start of a contention-based period. Threshold A is chosen to be greater than B to give the switching decision some hysteresis.

PCDC—Power controlled dual channel (Muqattash, 2003). In PCDC, the objective is to maintain network connectivity at the lowest possible transmit power. PCDC is a multi-hop protocol that uses the RTS/CTS handshake found in IEEE 802.11 with some modifications. Each terminal is required to keep a list of neighboring terminals and the transmit power needed to reach them. When a packet is received, the list needs to be visited. If the sender is not known an entry is added. Otherwise, the existing entry is updated. In any case, the receiver needs to re-evaluate its connectivity information and confirm that it knows the cheapest way (in a transmit power sense) to reach all terminals that appears in its neighbor list. For instance, for some terminals it might be cheaper to use an intermediate terminal instead of the direct route. At heavy traffic loads there exist enough packets transiting to keep terminals well informed of their neighborhood. For long idle periods terminals are required to broadcast a ”hello” packet periodically for this purpose. PCDC achieves space efficiency and simulations carried by the authors indicate an increase in the network’s throughput.

MAC ReSerVation—MAC-RSV (Fang, 2003). In MAC-RSV, a reservation-based multihop MAC scheme is proposed. The TDMA frame consists of data and signaling slots. Data slots are marked as follows: reserved for transmission (RT), reserved for reception (RR), free for transmission (FT), free for reception (FR), or free for transmission and reception (FTR). The signaling slot is divided in minislots with each minislot further divided in three parts: request, reply, and confirm. A terminal wishing to transmit sends an RTS packet. In the RTS, the sender informs its own identity, the intended receiver’s identity, and the data slots it wishes to reserve. The intended receiver replies with a CTS if any of the requested slots is among its FR or FTR slots. Otherwise, it remains silent. It is possible that the CTS packet accepts reservation of only a subset of the requested slots. Terminals other than the intended receiver replies with a Not CTS (NCTS) if any of the requested slots is among its RR. Any terminal that detects an RTS collision also replies by sending an NCTS. Otherwise, it remains silent. Finally, if the sender successfully receives a CTS it confirms the reservation by sending a confirm packet (CONF). Otherwise, it remains silent. RTS packets are transmitted in the request part of the minislot; CTS and NCTS use the reply part; and CONF packets use the confirm part. Data slots are divided in three parts: receiver beacon (RB), data, and acknowledgement (ACK). A terminal that has a data slot marked RR transmits an RB with the identity of the active data transmitter. In addition, the receiver acknowledges the correct data reception by transmitting an ACK at the end of the data slot. Simulations carried out by the authors indicate that the proposed protocol outperforms the IEEE 802.11 at moderate to heavy traffic loads.

Comments

In (Jurdak, 2004) a set of guidelines is provided that a suitable general-purpose MAC protocol should follow. In particular, it is mentioned that the use of multiple channels to separate control and data is desirable in order to reduce the probability of collisions. The need of flexible channel bandwidth, multiple channels, and the high bandwidth efficiency suggests that CDMA is the optimal choice for channel partition. Multi- hop support is recommended to ensure scalability with flat or clustered topologies depending on the application. In order to favor power efficient terminals, protocols need to be power aware, must control transmission power, and allow for sleep mode. To complete the set of recommendations, the authors include, for the sake of flexibility, short to medium range networks and a sender-initiated approach.


Ad Hoc Networks : Introduction and Routing Algorithms

19.6 Ad Hoc Networks
19.6.1 Introduction

An ad hoc network is a wireless network that is established without the aid of infrastructure or centralized administration. It is formed by a group of wireless terminals (nodes) such that a communication between any two terminals is carried out by means of a store-and-relay mechanism. A terminal wishing to transmit

accesses the medium and sends its information to a nearby terminal. Upon receiving such information this terminal determines that this is not addressed to it. It then stores the information in order to relay it to another terminal at an appropriate time, and this process continues until the destination is reached. Note that in ad hoc networks there are no fixed routers. Nodes may be mobile and can be connected dynamically in an arbitrary manner. Nodes function as routers, which discover and maintain routes to other nodes in the network. Ad hoc networks find applications in emergency-and-rescue operations, meeting or conventions, data acquisition operations in inhospitable terrain, sensor networks, and home and office networks. Cheaper hardware, smaller transceivers, and faster processors fuel the increased interest in wireless ad hoc networks. This chapter addresses the ad hoc networks from four main aspects: routing, medium access, TCP/IP issues, and capacity. In routing, the main routing algorithms are illustrated. In medium access, the main medium access protocols are described. In TCP/IP issues, the aspects concerning the performance of TCP/IP in an ad hoc network is discussed. In capacity, some formulation concerning the capacity of the network is tackled.

19.6.2 Routing Algorithms

The design of routing algorithms in ad hoc networks is a challenging task. Algorithms must provide for a high degree of sophistication and intelligence so that the limited resources inherent to the wireless systems can be dealt with efficiently. They must be robust in order to cope with the unkind wireless environment. At the same time they must be flexible in order to adapt to the changing network conditions such as network size, traffic distribution, and mobility. Routing algorithms have long been used in wired systems and they are usually classified into two categories: Distant vector (DV) and Link-state (LS). DV algorithms provide each node with a vector containing the hop distance and the next hop to all the destinations. LS algorithms provide each node with an updated view of the network topology by periodical flooding of link information about its neighbors. A direct application of these algorithms in a wireless and mobile environment may be cumbersome. DV protocols suffer from slow route convergence and may create loops. LS protocols require the frequent use of the resources, thence large bandwidth, in order to maintain the nodes updated.

With the increasing interest in wireless networks, a variety of routing algorithms overcoming the limitations of the DV and LS protocols have been proposed. They are usually classified into three categories: proactive or table-driven, reactive or on-demand, and hybrid. The proactive protocols require the nodes to keep tables with routing information. Updates occur on a periodical basis or as soon as changes in the network topology are perceived. The algorithms differ basically in the type of information is kept and in the way updates occur. The reactive protocols create routes on demand. This is accomplished by means of a route discovery process, which is completed once a route has been found or all possible route permutations have been examined. The discovery process occurs by flooding route request packets through the network. After establishing a route, it is maintained by a route maintenance procedure until either the destination becomes inaccessible along every path from the source or until the route is no longer desired. The hybrid protocols are both proactive and reactive. Nodes with close proximity form a backbone within which proactive protocols are applied. Routes to faraway nodes are found through reactive protocols.

Proactive Algorithms

CGSR—Clusterhead-gateway switch routing (Chiang, 1997). In CGSR, the whole network is partitioned into clusters of nodes. Within each cluster a clusterhead is elected among the nodes. A node may belong to one cluster only, in which case it is an internal node, or to more than one cluster, in which case it becomes a gateway. Packets are transmitted from the node to the clusterhead and from the clusterhead to the node. Routing within such a network occurs as follows. Assume source and destination belonging to different clusters. The source sends its packets to the clusterhead, which relays these packets to a gateway, which relays them to another clusterhead, and this process continues until the destination is reached.

DREAM—Distance routing effect algorithm for mobility (Basagni, 1998). In DREAM, GPS is used so that each node can maintain a location table with records of locations of all the nodes. The nodes broadcast control packets for location updating purposes. A source having packets to send calculates the direction toward the destination. It then selects a set of one-hop neighbors in the respective direction. (If the set is empty, the data are flooded to the whole network.) The data header encloses the respective set and is sent. Those nodes specified in the header are entitled to receive and process the data. All the nodes of the paths repeat this process until the destination is reached. Upon receiving the packets, the destination issues an ACK, which is transmitted to the source using the same algorithm.

DSDV—Destination-sequential distance-vector routing (Perkins, 1994). In DSDV, each node keeps a routing table containing all of the possible destinations within the network in conjunction with the number of hops to each destination. The entries are marked with a sequence number assigned by the destination node so that mobile nodes can distinguish stable routes from the new ones in order to avoid routing loops. Table consistency is kept by periodical updates transmitted throughout the network.

FSLS—Fuzzy sighted link state (Santivanez, 2001). In FSLS, an optimal link state update algorithm (hazy sighted link state) is used. Updates occur every 2k T , in which k is the hop distance, T is the minimum link state update transmission period, and 2k is the number of nodes to be updated. FSLS operates in a way very similar to FSR, as described below.

FSR—Fisheye state routing (Iwata, 1999; Pei, 2000). In FSR, each node maintains a topology map, and link state information is exchanged with neighbors periodically. The frequency with which it occurs depends on the hop distance to the current node. Nearby destinations are updated more frequently whereas for the faraway ones the updates are less frequent. Therefore, FSR produces accurate distance and path information about immediate neighborhood, and imprecise information about the best path to a distant node. On the other hand, such an imprecision is compensated for as the packet approaches its destination. GSR—Global state routing (Chen, 1998). In GSR, a link state table based on the update messages from neighboring nodes is kept and periodical exchanges of link state information are carried out. The size of update messages increases with the increase of the size of the network, and a considerable amount of bandwidth is required in this case.

HSR—Hierarchical state routing (Pei, 1999). In HSR, the link state algorithm principle is used in conjunction with a hierarchical addressing and topology map. Clustering algorithms may also be used so as to organize the nodes with close proximity into clusters. Each node has a unique identity, which are typically a MAC address and a hierarchical address. A communication between any two nodes occurs by means of physical and logical links. The physical links support the true communication between nodes whereas the logical links are used for the purposes of the hierarchical structure of the communication.

This way, several levels in the hierarchy may be built. The lowest level is always the physical level whereas the higher levels constitute the logical levels. Communications then occur starting from the lowest level up to the higher levels and down again to the lowest level.

MMWN–Multimedia support in mobile wireless networks (Kasera, 1997). In MMWN, a clustering hierarchy is used, each cluster having two types of nodes: switch and endpoint. Endpoints do not communicate with each other but with switches only. Within a cluster, one of the switches is chosen as a location manager, which performs location updating and location finding. This means that routing over-head is drastically reduced as compared to the traditional table-driven algorithms. This way, information in MMWN is stored in a dynamically distributed database.

OLSR—Optimized link state routing (Jacquet, 2001). In OLSR, each node keeps topology information on the network by periodically exchanging link state messages. OLSR uses the multipoint replaying strategy (MPR) in order to minimize the size of the control messages and the number of re-broadcasting nodes. To this end, each node selects a set of neighboring nodes (multipoint relays—MPRs) to retransmit its packets.

Those not in the selected set may read and process each packet but not retransmit. The selection of the appropriate set is carried out as follows. Each node periodically broadcasts a list of its one-hop neighbors.

From the lists the nodes are able to choose a subset of one-hop neighbors that covers all of its two-hop neighbors. An optimal route to every destination is constructed and stored in a routing table.

STAR—Source-tree adaptive routing (Garci-Luna-Aceves, 1999). In STAR, each node keeps a source tree with the preferred paths to destinations. It uses the least overhead routing approach (LORA) to reduce the amount of routing overhead disseminated into the network. The reduction in the amount of messages is achieved by making update dissemination conditional to the occurrence of certain events.

TBRPF—Topology broadcast based on reverse path forwarding (Bellur, 1999; Ogier, 2002). In TBRPF, two separate modules are implemented: neighbor discovery module and the routing module. The first module performs a differential HELLO messages that reports only the changes (up or lost) of neighbors. The second module operates based on partial topology information. The information is obtained through periodic and differential topology updates. If a node n is to send an update message, then every node in the network selects its next hop (parent) node toward that node. Link state updates are propagated in the reverse direction on the spanning tree formed by the minimum-hop paths from all nodes to the sending node. This means that updates originated at n are only accepted if these updates arrive from the respective parent node. They are then propagated toward the children nodes pertaining to n.

WRP—Wireless routing protocol (Murthy, 1996). In WRP, each node maintains a set of tables as follows: distance table, routing table, link-cost table, message retransmission list (MRL) table. Each entry of the MRL table contains a sequence number of the update message, a retransmission counter, an acknowledgement required flag vector with one entry per neighbor, and a list of updates sent in the update message. It records which updates need to be retransmitted and which neighbors should acknowledge the retransmission. Update messages are sent only between neighboring nodes and they occur after processing updates or detecting a change in the link to the neighbor. Nodes learn of the existence of their neighbors from the receipt of ACK and other messages. In case a node is not sending messages of any kind, then a HELLO message is sent within a specified period of time to ensure connectivity.

Reactive Algorithms

ABR—Associativity-based routing (ABR) (Toh, 1996). In ABR, a query-reply technique is used to deter- mine routes to the required destination. Stable routes are chosen based on an associativity tick that each node maintains with its neighbors, with the links with the higher associativity tick being selected. This may not lead to the shortest paths but rather to paths that last longer. In such a case, fewer route reconstructions are needed thence more bandwidth is available. ABR requires periodical beaconing so as to determine the degree of associativity of the links which requires all nodes to remain active at all time, which result in additional power consumption.

AODV—Ad hoc on demand distance vector (Das, 2002). In AODV, periodic beaconing and sequence numbering procedure are used. The packets convey the destination address rather than the full routing information, this also occurring in the route replies. The advantage of AODV is its adaptability to highly dynamic networks. On the other hand, the nodes may experience large delays in route construction.

ARA—Ant-colony-based routing algorithm (Gu¨nes, 2002). In ARA, the food searching behavior of ants is used in order to reduce routing overheads. When searching for food, ants leave a trail behind (pheromone) that is followed by the other ants until it vanishes. In the route discovery procedure, ARA propagates a forwarding ANT (FANT) through the network until it reaches the destination. Then a backward ANT (BANT) is returned, a path is created, and data packet dissemination starts. The route is maintained by means of increasing or decreasing the pheromone value at each node. The pheromone at a given node is increased each time a packet travels through it, and it is decreased overtime until it expires. As can be inferred, the size of FANT and BANT is small; therefore the amount of overhead per control packet is minimized.

CBRP—Cluster-based routing protocol (Jiang, 1999). In CBRP, the nodes are grouped into clusters, a cluster presenting a clusterhead. The advantage of using the hierarchical approach is the decrease in the number of control overhead through the network as compared with the traditional flooding methods. Of course, there are overheads associated with the formation and maintenance of the clusters. The long propagation delay due to the hierarchical structure may render the nodes bearing inconsistent topology information, which may lead to temporary routing loops.

DSR—Dynamic source routing (Johnson, 2002). In DSR, there is no periodic beaconing (HELLO message), an important feature that can be used for battery saving purposes, in which the node may enter the sleep mode. Each packet in DSR conveys the full address of the route, and this is a disadvantage for large or highly dynamic networks. On the other hand, the nodes can store multiple routes in their route cache. The advantage of this is that the node can check its route cache for a valid route before initiating route discovery. A valid route found avoids the need for route discovery. And this is an advantageous feature for low mobility networks.

FORP—Flow oriented routing protocol (Su, 1999). In FORP, routing failure due to mobility is minimized by means of the following algorithm. A Flow-REQ message is disseminated through the network. A node receiving such a message, and based on GPS information, estimates a link expiration time (LET) with the previous hop and append this into its Flow-REQ packet, which is re-transmitted. Upon arrival at the destination, a route expiration time (RET) is estimated using the minimum of all LETs for each node. A Flow-SETUP message is sent back toward the source. Therefore, the destination is able to predict when a link failure may occur. In such a case, a Flow-HANDOFF message is generated and propagated in a similar manner.

LAR—Location aided routing (Ko, 1998). In LAR, using location information routing overhead is minimized, which is commonly present in the traditional flooding algorithms. Assuming each node provided with a GPS, the packets travel in the direction where the relative distance to the destination becomes smaller as they travel from one hop to another.

LMR—Light-weight mobile routing (Corson, 1995). In LMR, the flooding technique is used in order to determine the required routes. Multiple routes are kept at the nodes, the multiplicity being used for reliability purposes as well as to avoid the re-initiation of a route discovery procedure. In addition, the route information concerns the neighborhood only and not the complete route.

RDMAR—Relative distance micro-discovery ad hoc routing (Aggelou, 1999). In RDMAR, a relative- distance micro-discovery procedure is used in order to minimize routing overheads. This is carried out by means of calculating the distance between source and destination, thence limiting each route request packet to a certain number of hops (i.e., the route discovery procedure becomes confined to localized regions). In fact, this is only feasible if previous communications between source and destination has been established. Otherwise, a flooding procedure is applied.

ROAM—Routing on-demand acyclic multi-path (Raju, 1999). In ROAM, inter-nodal coordination and directed acyclic sub-graphs, derived from the distance of the router to the destination, are used. In case the required destination is no longer reachable multiple flood searches stop. In addition, each time the distance of a router to a destination changes by more than a given threshold, the router broadcasts update messages to its neighboring nodes. This increases the network connectivity at the expense of preventing the nodes entering the sleep mode to save battery.

SSA—Signal stability adaptive (Dube, 1997). In SSA, route selection is carried out based on signal strength and location stability, and not on associativity tick. In addition, route requests sent toward a destination cannot be replied by intermediate nodes, which may cause delays before a route is effectively discovered. This is due to the fact that the destination is responsible for selecting the route for data transfer. TORA—Temporarily ordered routing algorithm (Park, 1997). In TORA, the key design concept is the localization of control messages to a very small set of nodes near the occurrence of a topological change. The nodes maintain routing information about one-hop nodes. Route creation and route maintenance phases use a height metric to establish a directed acyclic graph rooted at the destination. Then, links are assigned as upstream or downstream based on the relative height metric to neighboring nodes. Route’s erasure phase involves flooding a broadcast clear packet throughout the network in order to erase invalid routes.

Hybrid Algorithms

DDR—Distributed dynamic routing (Nikaein, 2001). In DDR, a tree-based routing protocol is used but a root node is not required. The trees are set up by means of periodic beaconing messages, exchanged by neighboring nodes only. Different trees, composing a forest, are connected via gateways nodes. Each tree constitutes a zone, which is assigned a zone ID. The routes are determined by hybrid ad hoc protocols.

DST—Distributed spanning trees based routing protocol (Radhakrishnan, 1999). In DST, all nodes are grouped into trees, within which a node becomes a routing node or an internal node. The root, which is also a node, controls the structure of the tree. This may become a disadvantage of DST for the root node creates a single point of failure.

SLURP—Scalable location update routing protocol (Woo, 2001). In SLURP, the nodes are organized into nonoverlapping zones and a home region for each node in the network is assigned. The home region for each node is determined by means of a static mapping function known to all nodes whose inputs are the node ID and the number of nodes. Thus, all nodes are able to determine the home region for each node. The current location of the node within its home region is maintained by unicasting a location update packet toward its region. Once it reaches its home region, it is broadcast to all nodes within its home.

ZHLS—Zone-based hierarchical link state (Joa-Ng, 1999). In ZHLS, hierarchical topology is used such that two levels are established: node level and zone level, for which the use of GPS is required. Each node then has a node ID and a zone ID. In case a route to a node within another zone is required, the source node broadcasts a zone-level location request to all of the other zones. This generates lower overhead as compared to the flooding approach in reactive protocols. Mobility within its own zone maintains the topology of the network such that no further location search is required. In ZHLS, all nodes are supposed to have a pre-programmed static zone map for initial operation.

ZRP—Zone routing protocol (Haas, 1999). In ZRP, a routing zone is established that defines a range in hops within which network connectivity is proactively maintained. This way, nodes within such a zone have the routes available immediately. Outside the zone, routes are determined reactively (on demand) and any reactive algorithm may be used.


Brief Survey of Speech Enhancemen : Multiple State Speech Model, Second-Order Statistics Estimation and Concluding Remarks.

19.5.1 Multiple State Speech Model

All estimators presented in Section 19.5.2 and Section 19.5.3 make the implicit assumption that the speech signal is always present in the noisy signal. In the notation of Section 19.5.2, Z = Y + W. Since the length of a frame is relatively short, in the order of 30 − 50 msec, it is more realistic to assume that speech may be present in the noisy signal with some probability, say η, and may be absent from the noisy signal with one minus that probability. Thus we have two hypotheses, one of speech presence, say H1, and the other of speech absence, say H0, that occur with probabilities η and 1 − η, respectively. We have

image

since E { Ay |Z, H0}= 0 and E { Ay |Z, H1}= Aˆy as given by Eq. (19.92). The more realistic estimator given in Eq. (19.99) was found useful in practice as it improved the performance of the estimator in Eq. (19.92). Other estimators may be derived under this model. Note that the model as in Eq. (19.98) is not applicable to the estimator in Eq. (19.95) since Ay must be positive for the criterion in Eq. (19.94) to be meaningful. Speech enhancement under the speech presence uncertainty model was first proposed and applied by McAulay and Malpass in their pioneering work [16].

An extension of this model leads to the assumption that speech vectors may be in different states at different time instants. The speech presence uncertainty model assumes two states representing speech presence and speech absence. In another model of Drucker [3], five states were proposed representing fricative, stop, vowel, glide, and nasal speech sounds. A speech absence state could be added to that model as a sixth state. This model requires an estimator for each state just as in Eq. (19.99).

A further extension of these ideas, in which multiple states that evolve in time are possible, is obtained when one models the speech signal by a hidden Markov process (HMP) [8]. An HMP is a bivariate random process of states and observations sequences. The state process {St , t = 1, 2, .. .} is a finite-state homogeneous Markov chain that is not directly observed. The observation process {Yt , t = 1, 2, .. .} is conditionally independent given the state process. Thus, each observation depends statistically only on the state of the Markov chain at the same time and not on any other states or observations. Consider, for example, an HMP observed in an additive white noise process {Wt , t = 1, 2, .. .}. For each t, let Zt = Yt + Wt denote the noisy signal. Let Zt = {Z1, ... , Zt }. Let J denote the number of states of the Markov chain. The causal MMSE estimator of Yt given {Zt } is given by [6]

image

The estimator as given in Eq. (19.100) reduces to Eq. (19.99) when J = 2 and Pr(St = j |Zt ) = Pr(St = j |Zt ), or when the states are statistically independent of each other.

An HMP is a parametric process that depends on the initial distribution and transition matrix of the Markov chain and on the parameter of the conditional distributions of observations given states. The parameter of an HMP can be estimated off-line from training data and then used in constructing the estimator in Eq. (19.100). This approach has a great theoretical appeal since it provides a solid statistical model for speech signals. It also enjoys a great intuitive appeal since speech signals do cluster into sound groups of distinct nature, and dedication of a filter for each group is appropriate. The difficulty in implementing this approach is in achieving low probability of error in mapping vectors of the noisy speech onto states of the HMP. Decoding errors result in wrong association of speech vectors with the set of predesigned estimators {E {Yt |St = j, Zt }, j = 1, ... , J }, and thus in poorly filtered speech vectors. In addition, the complexity of the approach grows with the number of states, since each vector of the signal must be processed by all J filters.

The approach outlined above could be applied based on other models for the speech signal. For example, in [20], a harmonic process based on an estimated pitch period was used to model the speech signal.

19.5.2 Second-Order Statistics Estimation

Each of the estimators presented in Section 19.5.2 and Section 19.5.3 depends on some statistics of the clean signal and noise process which are assumed known apriori. The signal subspace estimators as in Eq. (19.82) and Eq. (19.88) require knowledge of the covariance matrices of the signal and noise. The spectral magnitude estimators in Eq. (19.92), Eq. (19.95), and Eq. (19.97) require knowledge of the variance of each spectral component of the speech signal and of the noise process. In the absence of explicit knowledge of the second-order statistics of the clean signal and noise process, these statistics must be estimated either from training sequences or directly from the noisy signal.

We note that when estimates of the second-order statistics of the signal and noise replace the true second- order statistics in a given estimation scheme, the optimality of that scheme can no longer be guaranteed. The quality of the estimates of these second-order statistics is key for the overall performance of the speech enhancement system. Estimation of the second-order statistics can be performed in various ways usually outlined in the theory of spectral estimation [19]. Some of these approaches are reviewed in this section. Estimation of speech signals second-order statistics from training data has proven successful in coding and recognition of clean speech signals. This is commonly done in coding applications using vector quantization and in recognition applications using hidden Markov modeling. When only noisy signals are available, however, matching of a given speech frame to a codeword of a vector quantizer or to a state of an HMP is susceptible to decoding errors. The significance of these errors is the creation of a mismatch between the true and estimated second order statistics of the signal. This mismatch results in application of wrong filters to frames of the noisy speech signal, and in unacceptable quality of the processed noisy signal. On-line estimation of the second-order statistics of a speech signal from a sample function of the noisy signal has proven to be a better choice. Since the analysis frame length is usually relatively small, the covariance matrices of the speech signal may be assumed Toeplitz. Thus, the autocorrelation function of the clean signal in each analysis frame must be estimated. The Fourier transform of a windowed autocorrelation function estimate provides estimates of the variances of the clean signal spectral components.

For a wide-sense stationary noise process, the noise autocorrelation function can be estimated from an initial segment of the noisy signal that contains noise only. If the noise process is not wide-sense stationary, frames of the noisy signal must be classified as in Eq. (19.98), and the autocorrelation function of the noise process must be updated whenever a new noise frame is detected.

In the signal subspace approach [7], the power spectral densities of the noise and noisy processes are first estimated using windowed autocorrelation function estimates. Then, the power spectral density of the clean signal is estimated using Eq. (19.86). That estimate is inverse Fourier transformed to produce an estimate of the desired autocorrelation function of the clean signal. In implementing the MMSE spectral estimator as in Eq. (19.92), a recursive estimator for the variance of each spectral component of the clean signal developed in [4] is often used, see, e.g., [1, 2]. Let Aˆ y (t) denote an estimator of the magnitude of a spectral component of the clean signal in a frame at time t. This estimator may be the MMSE estimator as in Eq. (19.92). Let Az (t) denote the magnitude of the corresponding spectral component of the noisy signal. Let σ�2 (t) denote the estimated variance of the spectral component of the noise process in that frame. Let σ�2(t) denote the estimated variance of the spectral component of the clean signal in that frame. This estimator is given by

image

where 0 ≤ β ≤ 1 is an experimental constant. We note that while this estimator was found useful in practice, it is heuristically motivated and its analytical performance is not known.

A parametric approach for estimating the power spectral density of the speech signal from a given sample function of the noisy signal was developed by Musicus and Lim [18]. The clean signal in a given frame is assumed a zero mean Gaussian autoregressive process. The noise is assumed a zero mean white Gaussian process that is independent of the signal. The parameter of the noisy signal comprises the autoregressive coefficients, the gain of the autoregressive process, and the variance of the noise process. This parameter is estimated in the ML sense using the EM algorithm. The EM algorithm and conditions for its convergence were originally developed for this problem by Musicus [17]. The approach starts with an initial estimate of the parameter. This estimate is used to calculate the conditional mean estimates of the clean signal and of the sample covariance matrix of the clean signal given the noisy signal. These estimates are then used to produce a new parameter, and the process is repeated until a fixed point is reached or a stopping criterion is met.

This EM procedure is summarized as follows: Consider a scalar autoregressive process {Yt , t = 1, 2, .. .}

of order r and coefficients a = (a1, ... , ar )t. Let {Vt } denote an independent identically distributed sequence of zero mean unit variance Gaussian random variables. Let σv denote a gain factor. A sample function of the autoregressive process is given by

image

Assume that the initial conditions of Eq. (19.102) are zero, i.e., yt = 0 for t < 1. Let {Wt , t = 1, 2, .. .} denote the noise process which comprises an iid sequence of zero mean unit variance Gaussian random variables. Consider a k-dimensional vector of the noisy autoregressive process. Let Y = (Y1, ... , Yk )t, and define similarly the vectors V and W corresponding to the processes {Vt } and {Wt }, respectively. Let A denote a lower triangular Toeplitz matrix with the first column given by (1, a1, ... , ar , 0, ... , 0)t. Then

image

Suppose φm = (a(m), σv (m), σw (m)) denotes an estimate of the parameter of Z at the end of the mth iteration. Let A(m) denote the matrix A constructed from the vector a(m). Let Ry (m) = σ 2(m) A(m)−1(A(m))−1)t denote the covariance matrix of the autoregressive process of Eq. (19.102) as obtained from . Let Rz (m) = Ry (m) + σ 2 (m)I denote the covariance matrix of the noisy signal as shown in Eq. (19.103) based on φm. Let Yˆ and Rˆ denote, respectively, the conditional mean estimates of the clean signal Y and of the sample covariance of Y given Z and the current estimate φm. Under the Gaussian assumptions of this problem, we have

image

The calculation of the parameter of the noisy signal in Eq. (19.107) to Eq. (19.109) comprise the M-step of the EM algorithm.

Note that the enhanced signal can be obtained as a by-product of this algorithm using the estimator as in Eq. (19.104) at the last iteration of the algorithm. Formulation of the above parameter estimation problem in a state space assuming colored noise in the form of another autoregressive process, and implementation of the estimators as given in Eq. (19.104) and Eq. (19.105) using Kalman filtering and smoothing was done in [9].

The EM approach presented above differs from an earlier approach pioneered by Lim and Oppenheim [12]. Assume for this comparison that the noise variance is known. In the EM approach, the goal is to derive the ML estimate of the true parameter of the autoregressive process. This is done by local maximization of the likelihood function of the noisy signal over the parameter set of the process. The EM approach results in alternate estimation of the clean signal Y and its sample correlation matrix YY t, and of the parameter of the autoregressive process (a, σv ). The approach taken in [12] aims at estimating the parameter of the autoregressive process that maximizes the joint likelihood function of the clean and noisy signals. Using alternate maximization of the joint likelihood function, the approach resulted in alternate estimation of the clean signal Y and of the parameter of the autoregressive process (a, σv ). Thus, the main difference between the two approaches is in the estimated statistics from which the autoregressive parameter is estimated in each iteration. This difference impacts the convergence properties of the algorithm [12] which is known to produce an inconsistent parameter estimate. The algorithm [12] is simpler to implement than the EM approach and it is popular among some authors. To overcome the inconsistency, they developed a set of constraints for the parameter estimate in each iteration.

19.5.3 Concluding Remarks

We have surveyed some aspects of the speech enhancement problem and presented state-of-the-art solutions to this problem. In particular, we have identified the difficulties inherent to speech enhancement, and presented statistical models and distortion measures commonly used in designing estimators for the clean signal. We have mainly focused on speech signals degraded by additive noncorrelated wide-band noise. As we have noted earlier, even for this case, a universally accepted solution is not available and more research is required to refine current approaches or alternatively develop new ones. Other noise sources, such as room reverberation noise, present a more significant challenge as the noise is a non-stationary process that is correlated with the signal and it cannot be easily modeled. The speech enhancement problem is expected to attract significant research effort in the future due to challenges that this problem poses, the numerous potential applications, and future advances in computing devices.

References

1. Cappe´, O., Elimination of the musical noise phenomenon with the Ephraim and Malah noise suppressor, IEEE Trans. Speech and Audio Proc., vol. 2, pp. 345–349, Apr. 1994.

2. Cohen, I. and Berdugo, B.H., Speech enhancement for non-stationary noise environments, Signal Processing, vol. 81, pp. 2403–2418, 2001.

3. Drucker, H., Speech processing in a high ambient noise environment, IEEE Trans. Audio Electroacoust., vol. AU-16, pp. 165–168, Jun. 1968.

4. Ephraim, Y. and Malah, D., Speech enhancement using a minimum mean square error short time spectral amplitude estimator, IEEE Trans. Acoust., Speech, Signal Processing, vol. ASSP-32, pp. 1109– 1121, Dec. 1984.

5. Ephraim Y. and Malah, D., Speech enhancement using a minimum mean square error Log-spectral am- plitude estimator, IEEE Trans. Acoust., Speech, Signal Processing, vol. ASSP-33, pp. 443–445, Apr. 1985.

6. Ephraim, Y., Statistical model based speech enhancement systems, Proc. IEEE, vol. 80, pp. 1526–1555, Oct. 1992.

7. Ephraim, Y. and Van Trees, H.L., A signal subspace approach for speech enhancement, IEEE Trans.

Speech and Audio Proc., vol. 3, pp. 251–266, July 1995.

8. Ephraim, Y. and Merhav, N., Hidden Markov Processes, IEEE Trans. Inform. Theory, vol. 48, pp. 1518–1569, June 2002.

9. Gannot, S., Burshtein, D., and Weinstein, E., Iterative and sequential Kalman filter-based speech enhancement algorithms, IEEE Trans. Speech and Audio Proc., vol. 6, pp. 373–385, July 1998.

10. Gray, R.M., Toeplitz and Circulant Matrices: II. Stanford Electron. Lab., Tech. Rep. 6504–1, Apr. 1977.

11. Lev-Ari, H. and Ephraim, Y., Extension of the signal subspace speech enhancement approach to

colored noise, IEEE Sig. Proc. Let., vol. 10, pp. 104–106, Apr. 2003.

12. Lim, J.S. and Oppenheim, A.V., All-pole modeling of degraded speech, IEEE Trans. Acoust., Speech,

Signal Processing, vol. ASSP–26, pp. 197–210, June 1978.

13. Lim J.S. and Oppenheim, A.V., Enhancement and bandwidth compression of noisy speech, Proc.

IEEE, vol. 67, pp. 1586–1604, Dec. 1979.

14. Lim, J.S., ed., Speech Enhancement. Prentice-Hall, New Jersey, 1983.

15. Makhoul, J., Crystal, T.H., Green, D.M., Hogan, D., McAulay, R.J., Pisoni, D.B., Sorkin, R.D., and

Stockham, T.G., Removal of Noise From Noise-Degraded Speech Signals. Panel on removal of noise

from a speech/noise National Research Council, National Academy Press, Washington, D.C., 1989.

16. McAulay, R.J. and Malpass, M.L., Speech enhancement using a soft-decision noise suppression filter,

IEEE Trans. Acoust., Speech, Signal Processing, ASSP-28, pp. 137–145, Apr. 1980.

17. Musicus, B.R., An Iterative Technique for Maximum Likelihood Parameter Estimation on Noisy Data.

Thesis, S.M., M.I.T., Cambridge, MA, 1979.

18. Musicus, B.R. and Lim, J.S., Maximum likelihood parameter estimation of noisy data, Proc. IEEE Int.

Conf. on Acoust., Speech, Signal Processing, pp. 224–227, 1979.

19. Priestley, M.B., Spectral Analysis and Time Series, Academic Press, London, 1989.

20. Quatieri, T.F. and McAulay, R.J., Noise reduction using a soft-decision sin-wave vector quantizer,

IEEE Int. Conf. Acoust., Speech, Signal Processing, pp. 821–824, 1990.

Defining Terms

Speech Enhancement: The action of improving perceptual aspects of a given sample of speech signals.

Quality: A subjective measure of the way a speech signal is perceived.

Intelligibility: An objective measure which indicates the percentage of words from a given text that are expected to be correctly understood by listeners.

Signal estimator: A function of the observed noisy signal which approximates the clean signal.

Expectation-maximization: An iterative approach for parameter estimation using alternate estimation and maximization steps.

Autoregressive process: A random process obtained by passing white noise through an all-pole filter.

Wide-sense stationarity: A property of a random process whose second-order statistics do not change with time.

Asymptotically weakly stationarity: A property of a random process indicating eventual wide-sense stationarity.

Hidden Markov Process: A Markov chain observed through a noisy channel.


Brief Survey of Speech Enhancement : Introduction, The Signal Subspace Approach and Short-Term Spectral Estimation

19.5 A Brief Survey of Speech Enhancement2
19.5.1 Introduction

Speech enhancement aims at improving the performance of speech communication systems in noisy environments. Speech enhancement may be applied, for example, to a mobile radio communication system, a speech recognition system, a set of low quality recordings, or to improve the performance of aids for the hearing impaired. The interference source may be a wide-band noise in the form of a white or colored noise, a periodic signal such as in hum noise, room reverberations, or it can take the form of fading noise. The first two examples represent additive noise sources, while the other two examples represent convolutional and multiplicative noise sources, respectively. The speech signal may be simultaneously attacked by more than one noise source.

There are two principal perceptual criteria for measuring the performance of a speech enhancement system. The quality of the enhanced signal measures its clarity, distorted nature, and the level of residual noise in that signal. The quality is a subjective measure that is indicative of the extent to which the listener is comfortable with the enhanced signal. The second criterion measures the intelligibility of the enhanced signal. This is an objective measure which provides the percentage of words that could be correctly identified by listeners. The words in this test need not be meaningful. The two performance measures are not correlated. A signal may be of good quality and poor intelligibility and vice versa. Most speech enhancement systems improve the quality of the signal at the expense of reducing its intelligibility. Listeners can usually extract more information from the noisy signal than from the enhanced signal by careful listening to that signal. This is obvious from the data processing theorem of information theory. Listeners, however, experience fatigue over extended listening sessions, a fact that results in reduced intelligibility of the noisy signal. Is such situations, the intelligibility of the enhanced signal may be higher than that of the noisy signal. Less effort would usually be required from the listener to decode portions of the enhanced signal that correspond to high signal to noise ratio segments of the noisy signal.

Both the quality and intelligibility are elaborate and expensive to measure, since they require listening sessions with live subjects. Thus, researchers often resort to less formal listening tests to assess the quality of an enhanced signal, and they use automatic speech recognition tests to assess the intelligibility of that signal. Quality and intelligibility are also hard to quantify and express in a closed form that is amenable to mathematical optimization. Thus, the design of speech enhancement systems is often based on mathe- matical measures that are somehow believed to be correlated with the quality and intelligibility of the speech signal. A popular example involves estimation of the clean signal by minimizing the mean square error (MSE) between the logarithms of the spectra of the original and estimated signals [5]. This criterion is believed to be more perceptually meaningful than the minimization of the MSE between the original and estimated signal waveforms [13].

Another difficulty in designing efficient speech enhancement systems is the lack of explicit statistical models for the speech signal and noise process. In addition, the speech signal, and possibly also the noise process, are not strictly stationary processes. Common parametric models for speech signals, such as an autoregressive process for short-term modeling of the signal, and a hidden Markov process (HMP) for long- term modeling of the signal, have not provided adequate models for speech enhancement applications. A variant of the expectation-maximization (EM) algorithm, for maximum likelihood (ML) estimation of the autoregressive parameter from a noisy signal, was developed by Lim and Oppenheim [12] and tested in speech enhancement. Several estimation schemes, which are based on hidden Markov modeling of the clean speech signal and of the noise process, were developed over the years, see, e.g., Ephraim [6]. In each case, the HMPs for the speech signal and noise process were designed from training sequences from the two processes, respectively. While autoregressive and hidden Markov models have proved extremely useful in coding and recognition of clean speech signals, respectively, they were not found to be sufficiently refined models for speech enhancement applications.

In this chapter we review some common approaches to speech enhancement that were developed primarily for additive wide-band noise sources. Although some of these approaches have been applied to reduction of reverberation noise, we believe that the dereverberation problem requires a completely different approach that is beyond the scope of this capter. Our primary focus is on the spectral subtraction approach [13] and some of its derivatives such as the signal subspace approach [7] [11], and the estimation of the short-term spectral magnitude [16, 4, 5]. This choice is motivated by the fact that some derivatives of the spectral subtraction approach are still the best approaches available to date. These approaches are relatively simple to implement and they usually outperform more elaborate approaches which rely on parametric statistical models and training procedures.

19.5.2 The Signal Subspace Approach

In this section we present the principles of the signal subspace approach and its relations to Wiener filtering and spectral subtraction. Our presentation follows [7] and [11]. This approach assumes that the signal and noise are noncorrelated, and that their second-order statistics are available. It makes no assumptions about the distributions of the two processes.

Let Y and W be k-dimensional random vectors in a Euclidean space k representing the clean signal and noise, respectively. Assume that the expected value of each random variable is zero in an appropriately defined probability space. Let Z = Y + W denote the noisy vector. Let Ry and Rw denote the covariance matrices of the clean signal and noise process, respectively. Assume that Rw is positive definite. Let H denote a k × k real matrix in the linear space R , and let Yˆ = HZ denote the linear estimator of Y given Z. The residual signal in this estimation is given by

image

where I denotes, as usual, the identity matrix. To simplify notation, we shall not explicitly indicate the dimensions of the identity matrix. These dimensions should be clear from the context. In Eq. (19.78), D = (I H)Y is the signal distortion and N = HW is the residual noise in the linear estimation. Let (·)t denote the transpose of a real matrix or the conjugate transpose of a complex matrix. Let

image

image

When H1 in Eq. (19.83) is applied to Z, it first whitens the input noise by applying R−1/2 to Z. Then, the orthogonal transformation U t corresponding to the covariance matrix of the whitened clean signal is applied, and the transformed signal is modified by a diagonal Wiener-type gain matrix.

In Eq. (19.83), components of the whitened noisy signal that contain noise only are nulled. The indices of these components are given by { j : λ j = 0}. When the noise is white, Rw = σ 2 I , and U and θ are the matrices of eigenvectors and eigenvalues of Ry 2 , respectively. The existence of null components { j : λ j = 0} for the signal means that the signal lies in a subspace of the Euclidean space Rk . At the same time, the eigenvalues of the noise are all equal to σ 2 and the noise occupies the entire space k . Thus, the signal subspace approach first eliminates the noise components outside the signal subspace and then modifies the signal components inside the signal subspace in accordance with the criterion of Eq. (19.81).

When the signal and noise are wide-sense stationary, the matrices Ry and Rw are Toeplitz with associated power spectral densities of f y (θ ) and fw (θ ), respectively. The angular frequency θ lies in [0, 2π ). When the signal and noise are asymptotically weakly stationary, the matrices Ry and Rw are asymptotically To eplitz and have the associated power spectral densities f y (θ ) and fw (θ ), respectively [10]. Since the latter represents a somewhat more general situation, we proceed with asymptotically weakly stationary signal and noise.

The filter H1 in Eq. (19.82) is then asymptotically Toeplitz with associated power spectral density

image

This is the noncausal Wiener filter for the clean signal with an adjustable noise level determined by the constraint α in Eq. (19.81). This filter is commonly implemented using estimates of the two power spectral densities. Let fˆ (θ ) and fˆ (θ ) denote the estimates of f (θ ) and f (θ ), respectively. These estimates could, for example, be obtained from the periodogram or the smoothed periodogram. In that case, the filter is implemented as

image

then a spectral subtraction estimator for the clean signal results. The constant ε ≥ 0 is often referred to as a “spectral floor.” Usually µ ≥ 2 is chosen for this estimator.

The enhancement filter H could also be designed by imposing constraints on the spectrum of the residual noise. This approach enables shaping of the spectrum of the residual noise to minimize its perceptual effect.

Suppose that a set {vi , i = 1, ... , m}, m k, of k-dimensional real or complex orthonormal vectors, and a set {αi , i = 1, ... , m} of non-negative constants, are chosen. The vectors {vi } are used to transform the residual noise into the spectral domain, and the constants {αi } are used as upper bounds on the variances of these spectral components. The matrix H is obtained from

image

When the noise is white, the set {vi } could be the set of eigenvectors of Ry and the variances of the residual noise along these coordinate vectors are constrained. Alternatively, the set {vi } could be the set of orthonormal vectors related to the DFT. These vectors are given by v t = k−1/2(1, ej k (i −1)·1, ... , ej k (i −1)·(k−1)).

Here we must choose αi = αki +2, i = 2, ... , k/2, assuming k is even, for the residual noise power spectrum to be symmetric. This implies that at most k/2 + 1 constraints can be imposed. The DFT-related {vi } enable the use of constraints that are consistent with auditory perception of the residual noise.

To present the optimal filter, let el denote a unit vector in R for which the l th component is one and all other components are zero. Extend {v1, ... , vm} to a k × k orthogonal or unitary matrix V = (v1, ... , vk ).

Set µi = 0 for m < i k, and let M = diag(kµ1, ... , kµk ) denote the matrix of k times the Lagrange multipliers which are assumed nonnegative. Define Q = R−1/2U and T = Qt V . The optimal estimation matrix, say H = H2, is given by [11]

image

provided that kµi ≈= −λl for all i.l . The optimal estimator first whitens the noise, then applies the orthogonal transformation U t obtained from eigendecomposition of the covariance matrix of the whitened signal, and then modifies the resulting components using the matrix H˜ 2. This is analogous to the operation of the estimator H1 in Eq. (19.83). The matrix H˜ 2, however, is not diagonal when the input noise is colored.

When the noise is white with variance σ 2 and V = U and m = k are chosen, the optimization problem of Eq. (19.87) becomes trivial since knowledge of input and output noise variances uniquely determines the filter H. This filter is given by H = UGUt where G = diag(√α1, ... , √αk ) [7]. For this case, the heuristic choice of

image

where ν ≥ 1 is an experimental constant and was found useful in practice [7]. This choice is motivated by the observation that for ν = 2, the first order Taylor expansion of α−1/2 leads to an estimator H = UGUt which coincides with the Wiener estimation matrix in Eq. (19.83) with = using Eq. (19.90) performs significantly better than the Wiener filter in practice.

19.5.3 Short-Term Spectral Estimation

In another earlier approach for speech enhancement, the short-time spectral magnitude of the clean signal is estimated from the noisy signal. The speech signal and noise process are assumed statistically independent, and spectral components of each of these two processes are assumed zero mean statistically independent Gaussian random variables. Let Ay e j θy denote a spectral component of the clean signal Y in a given frame. Let Az e j θz denote the corresponding spectral component of the noisy signal. Let σ 2 = E { A2 } and σ 2 = E { A2} denote, respectively, the variances of the clean and noisy spectral components. If the variance of the corresponding spectral component of the noise process in that frame is denoted by σ 2 , then we have σ 2 = σ 2 + σ 2 . Let

image

where π(1.5) = √π , and I ( ) and I ( ) denote, respectively, the modified Bessel functions of the zeroth and first order. Similarly to the Wiener filter given in Eq. (19.82), this estimator requires knowledge of second order statistics of each signal and noise spectral components, σ 2 and σ 2 , respectively.

To form an estimator for the spectral component of the clean signal, the spectral magnitude estimator Eq. (19.92) is combined with an estimator of the complex exponential of that component. Let e j θy be an estimator of e j θy . This estimator is a function of the noisy spectral component Az e j θz . MMSE estimation of the complex exponential e j θy is obtained from

image

The constraint in Eq. (19.93) ensures that the estimator e j θy does not affect the optimality of the estimator Aˆ y when the two are combined. The constrained minimization problem in Eq. (19.93) results in the estimator imagewhich is simply the complex exponential of the noisy signal.

Note that the Wiener filter Eq. (19.85) has zero phase and hence it effectively uses the complex exponential of the noisy signal e j θz in estimating the clean signal spectral component. Thus, both the Wiener estimator of Eq. (19.85) and the MMSE spectral magnitude estimator of Eq. (19.92) use the complex exponential of the noisy phase. The spectral magnitude estimate of the clean signal obtained by the Wiener filter, however, is not optimal in the MMSE sense.

Other criteria for estimating Ay could also be used. For example, Ay could be estimated from

image

and an estimate of Ay could be obtained fromimage. The criterion in Eq. (19.96) aims at estimating the magnitude squared of the spectral component of the clean signal in the MMSE sense. This estimator is particularly useful when subsequent processing of the enhanced signal is performed, for example, in autoregressive analysis for low bit rate signal coding applications [13]. In that case, an estimator of the autocorrelation function of the clean signal can be obtained from the estimator image. The optimal estimator in the sense of Eq. (19.96) is well known and is given by (see e.g., [6])

image


Applications of Machine vision systems

19.4.1 Applications

download (1)

Machine vision systems have uses in a wide variety of disciplines, from medicine to robotics, from automatic inspection to autonomous navigation, and from document analysis to multimedia systems. New machine vision systems are constantly emerging and becoming a part of everyday life. In this section, we present a brief description some of the various applications of machine vision.

Optical Character Recognition (OCR) and Document Image Analysis

The objective of document image analysis is to recognize the text and graphics components in images and extract the intended information as a human would. Two categories of document processing can be defined, textual processing and graphics processing. Textual processing deals with the text components of a document image. Some tasks here are recognizing the text by optical character recognition (OCR); skew detection and correction (any tilt at which the documents may have been scanned); and finding the columns, paragraphs, text lines, and words. Graphics processing deals with the nontextual components of a document image, such as lines and symbols that make up line diagrams, delimiting lines between text sections, and company logos.

Document analysis is currently a very active area of research. Researchers have devised systems ranging from automatic engineering drawing interpretation and recognition of tabular drawings to the recognition of zip codes from postal envelopes and the interpretation of musical scores. However, the real success story of document analysis is OCR. This is the one area of machine vision in which scientific study has lead to numerous low-cost marketed products. Many of the current OCR systems report accuracies well in the upper 90th percentile.

Many document analysis publications can be found in the journals and conference proceedings listed in the Further Information section. In addition, the International Conference on Document Analysis and Recognition (ICDAR) and the International Workshop or Graphics Recognition (IWGR) are biannual meetings held in conjunction with each other dedicated entirely to the field of document analysis.

Medical Image Analysis

Medical imaging analysis deals primarily with images such as X-rays, computerized tomograph (CT) scans, and magnetic resonance imaging (MRI) images. Early work in medical image analysis overlapped with that of image processing; the main task was to enhance medical images for viewing by a physician; no automatic interpretation or high-level reasoning by the system was involved. However, more recent work is being conducted on medical imagery, which more closely fits the definition of machine vision; for example, systems to search images for diseased organs or tissues based on known models (images) and features of the diseased samples and systems to generate three-dimensional models of organs based on CT scan and MRI. Some active areas of research include the use of three-dimensional images in surgery and surgical planning (especially neurosurgery), virtual surgery, and generating time-varying three-dimensional models obtained from sequences of images (e.g., pumping heart). These systems en- compass many of the aspects of typical machine vision systems plus incorporate many aspects of computer graphics.

In addition to the listings at the end of this section, the following are excellent sources of information on current research in medical imaging: IEEE Transactions on Medical Imaging, IEEE Transactions on Biomedical Engineering, IEEE Transactions on Image Processing, and IEEE Engineering in Medicine and Biology Magazine. There are also a number of conferences dedicated to medical imaging research: SPIE Medical Imaging, IEEE Engineering in Medicine and Biology, Medicine Meets Virtual Reality, select sessions/symposium of IEEE Visualization, and SPIE Visualization in Biomedical Computing.

Photogrammetry and Aerial Image Analysis

Photogrammetry deals with the task of making reliable measurements from images. In the early days of photogrammetry, the images were actual printed photographs often taken from balloons. Today, however, the remote sensing process is multispectral using energy in many other parts of the electromagnetic spectrum, such as ultraviolet and infrared. The images are often transmitted directly from satellites orbiting the globe, such as the Landsat satellites first launched in the early 1970s. Some of the applications of photogrammetry and aerial image analysis include atmospheric exploration; thermal image analysis for energy conservation; monitoring natural resources, crop conditions, land cover, and land use; weather prediction; pollution studies; urban planning; military reconnaissance; plus many others in geology, hydrology, and oceanography.

There are several organizations dedicated to the study of these types of remote sensing tasks. The following are very good sources for information on photogrammetry and aerial image analysis: The American Society of Photogrammetry, The International Remote Sensing Institute (ISRI), and The American Congress on Surveying and Mapping. In addition, there are several conferences and symposia dealing with this topic: SPIE Remote Sensing, International Geosciences and Remote Sensing Symposium, IEEE Transactions on Geoscience and Remote Sensing, and the Symposium on Remote Sensing sponsored by the American Geological Institute.

Industrial Inspection and Robotics

Unlike many of the already mentioned machine vision tasks, automatic inspection and robotics perform many tasks in real time that significantly increases the complexity of the system. The general goal of such systems is sensor-guided control. Typical industrial applications include automatic inspection of machined parts, solder joint surfaces (welds), silicon wafers, produce, and even candy. Some of the challenges

faced by industrial vision system designers include determining the optimal configuration of the camera and lighting, determining the most suitable color space representation of the illumination, modeling various surface reflectance mechanisms, dynamic sensor feedback, real-time manipulator control, real- time operating system interfaces, and neural networks.

Structured lighting techniques have been used extensively in industrial vision applications where the illumination of the scene can be easily controlled. In a typical application, objects on a conveyor belt pass through a plane of light, creating a distortion in the image of the light stripe. The profile of the object at the plane of the light beam is then calculated. This process is repeated at regular intervals as the object moves along the conveyor belt to recover the shape of the object. Then appropriate actions are taken depending on the goal of the system.

The following are sources dedicated primarily to industrial vision applications and robotics: International Journal of Robotics Research, IEEE Transactions on Robotics and Automation, IEEE’s International Conference on Robotics and Automation, and IEEE Transactions on Systems, Man, and Cybernetics.

Autonomous Navigation

Closely related to robotics is the area of autonomous navigation. Much work is being done to develop systems to enable robots or other mobile vehicles to automatically navigate through a specific environment. Techniques involved include active vision (sensor control), neural networks, high-speed stereo vision, three-dimensional vision (range imaging), high-level reasoning for navigational planning, and signal compression and transmission for accurate remote vehicle control.

Visual Information Management Systems

Probably one of the newest areas of machine vision research is in visual information management systems (VIMS). With the recent advances in low-cost computing power and the ever increasing number of multimedia applications, digital imagery is becoming a larger and larger part of every day life. Research in VIMS is providing methods to handle all of this digital information. Such VIMS applications include interactive television, video teleconferencing, digital libraries, video-on-demand, and large-scale video databases. Image processing and machine vision play a very important role in much of this work ranging anywhere from designing video compression schemes, which allow many processing techniques to be performed directly on the compressed datastream and developing more efficient indexing methods for multidimensional data, to automatic scene cut detection for automatically indexing large stockpiles of video data and developing methods to query image databases by image content as opposed to standard structured grey language (SQL) techniques.

Defining Terms

Correspondence problem: The problem of matching points in one image with their corresponding points in a second image.

Histogram: A plot of the frequency of occurrence of the grey levels in an image.

Quantization: The process of representing the continuous range of image intensities by a limited number of discrete grey values.

Sampling: The process of representing the continuous image intensity function as a discrete two-dimensional array.

Segmentation: The process of separating the objects from the background.

Polygonalization: A method of representing a contour by a set of connected straight line segments; for closed curves, these segments form a polygon.

Projection: The transformation and representation of a high-dimensional space in a lesser number of dimensions (i.e., a three-dimensional scene represented as a two-dimensional image).

Thresholding: A method of separating objects from the background by selecting an interval (usually in pixel intensity) and setting any points within the interval to 1 and points outside the interval to 0.

References

Besl, P.J. 1988. Active, Optical range imaging sensors. Machine Vision and Applications 1(2):127–152. Besl, P. and Jain, R.C. 1985. Three dimensional object recognition. ACM Computing Surveys 17(1). Duda, R.O. and Hart, P.E. 1973. Pattern Classification and Scene Analysis. Wiley, New York.

Foley, J.D., van Dam, A., Feiner, S.K., and Hughes, J.F. 1990. Computer Graphics, Principles and Practice.

Addison-Wesley, Reading, MA.

Gonzalez, R.C. and Woods, R.E. 1992. Digital Image Processing. Addison-Wesley, Reading, MA.

Javis, R.A. 1983. A perspective on range finding techniques for computer vision. TEEE Trans. on Pattern

Analysis and Machine Intelligence 5(2):122–139.

Kasturi, R. and Jain, R.C. 1991. Computer Vision: Principles. IEEE Computer Society Press.

Kosko, B. 1992. Neural Networks and Fuzzy Systems. Prentice-Hall, Englewood Cliffs, NJ.

Jain, R., Kasturi, R., and Schunck, B.G. 1995. Machine Vision. McGraw-Hill, New York.

Marr, D. 1982. Vision: A Computational Investigation into the Human Representation and Processing of Visual Information. W. H. Freeman, San Francisco, CA.

Tanimoto, S.L. 1995. The Elements of Artificial Intelligence Using Common Lisp. Computer Science Press.

Winston, P.H. 1992. Artificial Intelligence. Addison-Wesley, Reading, MA.

Further Information

Much of the material presented in this section has been adapted from:

Jain, R., Kasturi, R., and Schunck, B.G. 1995. Machine Vision. McGraw-Hill, New York.

Kasturi, R. and Jain, R.C. 1991. Computer Vision: Principles. IEEE Computer Society Press, Washington.

In addition the following books are reccommended:

Rosenfeld, A. and Kak, A.C. 1982. Digital Picture Processing. Academic Press, Englewood Cliffs, NJ. Jain, A.K. 1989. Fundamentals of Digital Image Processing. Prentice-Hall, New York.

Haralick, R.M. and Shapiro, L.G. 1992–1993. Computer and Robot Vision. Addison-Wesley, Reading, MA. Horn, B. 1986. Robot Vision. McGraw-Hill.

Schalkoff, R.J. 1989. Digital Image Processing and Computer Vision. Wiley, New York. Additional information on machine vision can be found in the following technical journals:

Artificial Intelligence (AI)

Computer Vision, Graphics, and Image Processing (CVGIP)

IEEE Transactions on Image Processing

IEEE Transactions on Pattern Analysis and Machine Intelligence (PAMI)

Image and Vision Computing

International Journal of Computer Vision

International Journal on Pattern Recognition and Artificial Intelligence

Machine Vision and Applications (MVA)

Pattern Recognition (PR)

Pattern Recognition Letters (PRL)

The following conference proceedings are also a good source for machine vision information: A series of conferences by the International Society for Optical Engineering (SPIE)

A series of workshops by the Institute of Electrical and Electronic Engineering (IEEE) Computer Society

A series of workshops by the International Association for Pattern Recognition (IAPR)

European Conference on Computer Vision (ECCV)

IEEE Conference on Computer Vision and Pattern Recognition (CVPR)

International Conference on Computer Vision (ICCV)

International Conference on Pattern Recognition (ICPR)


Three-Dimensional Object Recognition , Dynamic Vision

19.4.1 Three-Dimensional Object Recognition

The real world that we see and touch is primarily composed of three-dimensional solid objects. When an object is viewed for the first time, people typically gather information about that object from many different viewpoints. The process of gathering detailed object information and storing that information is referred to as model formation. Once a person is familiar with many objects, the objects are then identified from an arbitrary viewpoint without further investigation. People are also able to identify, locate, and qualitatively describe the orientation of objects in black-and-white photographs. This basic capability is significant to machine vision because it involves the spatial variation of a single parameter within a framed rectangular region that corresponds to a fixed, single view of the world.

Recognition System Components

Recognition implies awareness of something already known. In modeling real-world objects for recognition purposes, different kinds of schemes have been used. To determine how recognition will take place, a method for matching model data to sensor data must be considered. A straightforward blind-search approach would entail (1) transforming all possible combinations of all possible known object models in all possible distinguishable orientations and locations into a digitized sensor format and (2) matching based on the minimization of a matching-error criterion. Clearly, this approach is impractical. On the other hand, since object models contain more object information than sensor data, we are prohibited from transforming sensor data into complete model data and matching in the model data format. However, this does not prevent us from matching with partial model data. As a result, working with an intermediate domain that is computable from both sensor and model data is advantageous. This domain is referred to as the symbolic scene description domain. A matching procedure is carried out on the quantities in this domain, which are referred to as features.

image

The interactions between the individual components of a recognition system are illustrated in Fig. 19.49. The image formation process creates intensity or range data based purely on physical principles. The description process acts on the sensor data and extracts relevant application-independent features. This process is completely data-driven and includes only the knowledge of the image formation process. The modeling process provides object models for real-world objects. Object reconstruction from sensor data is one method for building models automatically. The understanding, or recognition, process involves an algorithm to perform matching between model and data descriptions. This process might include data- and model-driven sub- processes, where segmented sensor data regions seek explanations in terms of models and hypothesized models seek verification from the data. The rendering process produces synthetic sensor data from object models. Rendering provides an important feedback link by allowing an autonomous system to check on its own understanding of the sensor data by comparing synthetic images to sensed images.

Object Representation Schemes

Numerous schemes have been developed for representing three-dimensional objects. The choice of a particular scheme is governed by its intended application. In computer graphics, schemes such as the wire-frame and constructive solid-geometry representations are popular since their data structures are suitable for image rendering. In machine vision systems, other methods such as generalized cones and characteristic views are used extensively. In the following, we briefly describe some commonly used object representation schemes.

Wire Frame

The wire-frame representation of a three-dimensional object consists of a three-dimensional vertex point list and an edge list of vertex pairs. Although this representation is very simple, it is an ambiguous representation for determining such quantities as surface area and volume of an object. Wire-frame

image

models can sometimes be interpretted as several different solid objects or as different orientations of the same object. Figure 19.50(a) shows the wire-frame representation of a simple three-dimensional object.

Constructive Solid Geometry

The constructive solid-geometry (CSG) representations of an object is specified in terms of a set of three- dimensional volumetric primitives (blocks, cylinders, cones, spheres, etc.) and a set of boolean operators: union, intersection, and difference. Figure 19.50(b) shows the CSG representation for a simple geometric object. The storage data structure is a binary tree, where the terminal nodes are instances of the geometric primitives and the branching nodes represent the Boolean set operations and positioning information. CSG trees define object surface area unambiguously and can, with very little data, represent complex objects. However, the boundary evaluation algorithms required to obtain usable surface information are very computationally expensive. Also, general sculptured surfaces are not easily represented using CSG models.

Spatial Occupancy

Spatial-occupancy representations use nonoverlapping subregions of three-dimensional space occupied by an object to define that object. This method unambiguously defines an object’s volume. Some commonly used single primitive representations of this type are the voxel and octree representations. Voxels are small volume elements of discretized three-dimensional space (see Fig. 19.50(c)). They are usually fixed-size cubes. Objects are represented by the lists of voxels occupied by the object. Voxel representations tend to be very memory intensive, but algorithms using them tend to be very simple. An octree is a hierarchical representation of spatial occupancy. Volumes are decomposed into cubes of different size, where the cube size depends on the distance from the root node. Each branching node of the tree represents a cube and points to eight other nodes, each of which describes object volume occupancy in the corresponding octant subcubes of the branching node cube. The octree representation offers the advantages of the voxel description but is more compact. Beacuse of this compactness, more complicated algorithms are required for many computations than those needed for voxel representation.

Surface Boundary

The surface-boundary representation defines a solid object by defining the three-dimensional surfaces that bound the object. Figure 19.50(d) shows a surface-boundary representation for a simple geometric object. The simplest boundary representation is the triangle-faced polyhedron, which can be stored as a list of three-dimensional triangles. Arbitrary surfaces are approximated to any desired degree of accuracy by utilizing many triangles. A slightly more compact representation allows the replacement of adjacent, connected, coplanar triangles with arbitrary n-sided planar polygons. Structural relationships between bounding surfaces may also be included as part of the model.

Generalized Cone

In the generalized-cone (generalized-cylinder or sweep) representation, an object is represented by a three-dimensional space curve that acts as a spine or axis of the cone, a two-dimensional cross-sectional figure, and a sweeping rule that defines how the cross section is to be swept (and possibly modified) along the space curve (see Fig. 19.50(e)). Generalized cones are well suited for representing many real-world shapes. However, certain objects, such as the human face or an automobile body, are difficult to represent as generalized cones. Despite its limitations, the generalized-cone representation is popular in machine vision.

Skeleton

Skeleton representations use space-curve skeletons. A skeleton can be considered an abstraction of the generalized cone description that consists of only the spines. Skeleton geometry provides useful abstract information. If a radius function is specified at each point on the skeleton, this representation is capable of general-purpose object description.

Multiple Two-Dimensional Projection

For some applications, a library of two-dimensional silhouette projections that represent three-dimensional objects can be conveniently stored. For the recognition of three-dimensional objects with a small number of stable orientations on a flat table, this representation is ideal—if the object silhouettes are sufficiently different. For example, silhouettes have been used to recognize aircraft in any orientation against a well-lit sky background. However, because many different three-dimensional-object shapes can possess the same silhoutte projection, this type of representation is not a general-purpose technique.

Aspect Graphs

In the aspect graph representation, the space of viewpoints is partitioned into maximal regions, where every viewpoint in each region gives the same qualitative view of the object, called the aspect. Within each region, projections of the object will have the same number and types of features, with identical spatial relationships among them. However, the quantitative properties of these features, such as lengths of edges, vary with the change in viewpoint. Changes in the aspect, called visual events, take place at the boundaries between regions. Two aspects are said to be connected by a visual event if their corresponding regions are adjacent in the viewpoint space. An aspect graph is a graph structure whose nodes represent aspects and their associated regions and whose arcs denote the visual events and boundaries between adjacent regions. Figure 19.50(f) shows the aspect graph for a cube.

Characteristic Views

A concept very similar to aspect graphs is that of characteristic views. All of the infinite two-dimensional perspective projection views of an object are grouped into a finite number of topologically equivalent classes. Different views within an equivalence class are related via linear transformations. A representative member of an equivalence class is called the characteristic view for that class. In this scheme, objects are assumed to rest on a supporting plane; hence, they are restricted to appear in a number of stable positions. Characteristic views of objects are derived with certain constraints on the camera configuration. It is this use

of camera position and orientation information that differentiates the characteristic view representation scheme from the aspect graph. Because characteristic views specify the three-dimensional structure of an object, they also provide a general-purpose object representation.

19.4.2 Dynamic Vision

Early machine vision systems were concerned primarily with static scenes; however, the world is dynamic. Designing machine vision systems capable of analyzing dynamic scenes is increasingly becoming more popular. For a machine vision system engaged in the performance of nontrivial real-world operations and tasks, the ability to cope with moving and changing objects and viewpoints is vital.

The input to a dynamic-scene analysis system is a sequence of image frames. The camera used to acquire the image sequence may itself be in motion. Each frame represents an image of the scene at a particular instant in time. The changes in a scene may be due to camera motion, object motion, illumination changes, or changes in object structure, size, or shape. Changes in a scene are usually assumed to be due to camera and/or object motion; objects are usually assumed to be either rigid or quasirigid. Other changes are not allowed.

A scene usually contains several objects. An image of the scene at a given time represents a projection of part of the scene; the part of the scene depends on the position of the camera. Four cases represent the possibilities for the dynamic-camera/world setup:

1. Stationary camera, stationary objects (SCSO)

2. Stationary camera, moving objects (SCMO)

3. Moving camera, stationary objects (MCSO)

4. Moving camera, moving objects (MCMO)

The first case is simple static-scene analysis. In many applications, processing a single image to obtain the required information may be feasible. However, many more applications exist that require information to be extracted from a dynamic environment.

Clearly, a sequence of image frames offers much more information to aid in scene understanding, but significantly increases the amount of data to be processed by the system. Applying static-scene analysis techniques to each frame of a sequence requires an enormous amount of computation, while still suffering from all of the problems of static-scene analysis. Fortunately, research in dynamic-scene analysis has shown that information recovery may be easier in dynamic scenes than in static scenes. In some cases, the total computational effort may be significantly less and the performance is better.

SCMO scenes have received the most attention in dynamic-scene analysis. The objectives of such scene analysis usually are to detect motion, to extract masks of moving objects with the aim of recognizing them, and to compute their motion characteristics. MCMO is the most general case and possibly presents the most difficult situation in dynamic-scene analysis. Many techniques that have been developed assuming a stationary camera are not applicable to a moving camera. Likewise, techniques developed for a moving camera generally assume a stationary scene and are usually not applicable if the objects are moving. SCMO and MCSO have found uses in many applications and have been studied by researchers in various contexts under various assumptions.

Change Detection

Any perceptable motion in a scene results in some change in the sequence of frames of the scene. If such changes are detected, motion characteristics can be analyzed. A good quantitative estimate of the motion components of an object can be obtained if the motion is restricted to a plane that is parallel to the image plane; for three-dimensional motion, only qualitative estimates are possible. By analyzing frame-to-frame differences, a global analysis of the sequence can be performed. Changes can be detected at different levels: pixel, edge, or region.

Difference Pictures

The most obvious method of detecting change between two frames is to directly compare the corresponding pixels of the frames to determine whether or not they are the same. In the simplest form, a binary difference picture D P jk (x, y) between frames j and k is obtained by

image

where τ is a threshold and F (x, y, j ) and F (x, y, k) are the image arrays of the j th and kth frames, respectively.

In the difference picture, pixels that have a value of 1 may be considered to be the result of object motion. Because of noise, however, such a simple test on real scenes usually produces unsatisfactory results. A simple size filter may be used to ignore pixels not forming a connected cluster of minimal size. Then only those pixels in the difference picture with the value of 1 that belong to a four-connected (or eight-connected) component larger than a set number of pixels will be attributed to object motion. This filter is very effective in reducing noise, but unfortunately it also filters some desirable signals, such as those from small or slowly moving objects.

Likelihood Ratio

To make change detection more robust, regions or groups of pixels at the same location in two frames may be considered and their intensity characteristics may be compared more rigorously. One method using this approach is based on comparing the frames using the likelihood ratio. Thus, we can compute the difference picture by replacing |F (x, y, j ) − F (x, y, k)| with λ where

image

and µ and σ denote the mean gray value and the square root of the variance from the frames for the sample area, respectively.

The likelihood ratio can only be applied to regions and not to single pixels. This limitation presents a minor problem, which can be solved by considering corresponding areas of the frames. The likelihood ratio test, combined with a size filter, works well for noise removal in many real-world scenes. The likelihood ratio test can be applied to every point in each frame by considering overlapping areas centered on each pixel of the image, or to a subsampling of points by using nonoverlapping areas, called superpixels.

Accumulative Difference Pictures

The problem of missing the detection of small or slowly moving objects can be solved by analyzing change over a series of frames, instead of just between two frames. The accumulative difference picture (ADP) is used to detect the motion of small and slowly moving objects. An accumulative difference picture is formed by comparing every frame in an image sequence to a common reference frame. The entry in the accumulative difference picture is increased by one whenever the likelihood ratio for that region exceeds the threshold. Thus, an accumulative difference picture acquired over k frames is given by

image

where the first frame of a sequence is usually the reference frame.

Time-Varying Edge Detection

As a result of the importance of edge detection in static scenes, it is reasonable to expect that time- varying edge detection may also be important in dynamic-scene analysis. Moving edges can be detected by combining the spatial and temporal gradients using a logical AND operation, which is implemented

through multiplication. Thus, the time-varying edgeness of a point in a frame is given by

image

where dF /dS and dF /dt are the magnitudes of the spatial and temporal gradients of the intensity at point (x, y, t), respectively. Various conventional edge detectors can be used to compute the spatial gradient, and a simple difference can be used to compute the temporal gradient. In most cases, this edge detector works effectively. By applying a threshold to the product—rather than first differencing and then applying an edge detector, or first detecting edges and then computing their temporal gradient—this method overcomes the problem of missing weak or slowly moving edges.

Optical Flow

Optical flow is the distribution of velocity, relative to the observer, over the points of an image. Optical flow carries information that is valuable in dynamic-scene analysis. Optical flow is determined by the velocity vector at each pixel in an image. Several methods have been devised for calculating optical flow based on two or more frames of a sequence. These methods can be classified into two general categories: feature based and gradient based. If a stationary camera is used, most of the points in an image frame will have zero velocity. This is assuming that a very small subset of the scene is in motion, which is usually true. Thus, most applications for optical flow involve a moving camera.

Feature-Based Methods

Feature-based methods for computing optical flow first select some features in consecutive image frames, match these features between frames, and then calculate the disparities between them. As mentioned earlier, the correspondence problem can be solved using relaxation. However, the problem of selecting features and establishing correspondence is not easy. Moreover, this method only produces velocity vectors at sparse points within the image.

Gradient-Based Methods

Gradient-based methods exploit the relationship between the spatial and temporal gradients of image intensity. This relationship can be used to segment images based on the velocity of image points. The relationship between the spatial and temporal gradients and the velocity components is

image

where u = dx/dt and v = dy/dt. In this equation, Fx , F y , and Ft represent the spatial gradients in the x and y directions and the temporal gradient, respectively, and can be computed directly from the image. Then, at every point in an image, there are two unknowns, u and v , yet there is only one equation. Thus, optical flow cannot be directly determined.

The velocity field, however, can be assumed to vary smoothly over an image. Under this assumption, an iterative approach for computing optical flow using two or more frames can be utilized. The following iterative equations are used for the computation of image flow:

image


where λ is a constant multiplier. When only two frames are used, the computation is iterated over the same frames many times. For more than two frames, each iteration uses a new frame.

Segmentation Using a Moving Camera

If the camera is moving, then every point in the image has nonzero velocity relative to the camera (except the case where object points are moving with the same velocity as the camera). The velocity relative to the camera depends on both the velocity of the point itself and the distance of the point from the camera. Approaches based on differences may be extended for segmenting moving-camera scenes. If the aim is to extract images of moving objects, however, then additional information is required to decide whether the motion at a point is due solely to its depth or is due to a combination of its depth and its motion. Gradient-based approaches will also require additional information.

If the camera’s direction of motion is known, the focus of expansion (FOE) with respect to the stationary components in the scene can easily be computed. The FOE will have coordinates (x f , y f ) where

image

in the image plane. The velocity vectors of all stationary points in a scene project onto the image plane so that they intersect at the FOE. A transformation with respect to the FOE can be used to simplify the task of segmentation. The ego-motion polar (EMP) transformation of an image transforms a frame F (x, y, t) into E (r, θ, t) using

image

In EMP space, stationary points are displaced only along the θ axis between the frames of an image sequence, whereas points on moving objects are displaced along the r axis as well as the θ axis. Thus, the displacement in EMP space can be used to segment a scene into its stationary and nonstationary components. Moreover, when complex logarithmic mapping (CLM) is performed about the FOE, interesting points in the EMP space can be obtained.


Segmentation , Edge-Based Segmentation , Gradient , Laplacian , Laplacian of Gaussian , Surface Fitting , Edge Linking , Region-Based Segmentation , Region Formation , Split and Merge , Chain Codes , Polygonalization , One-Dimensional Signatures , Boundary Descriptors , Feature Extraction , Critical Points , Interesting Points , Matching , Point Pattern Matching , Template Matching and Hough Transform .

Segmentation

An image must be analyzed and its relevant features extracted before more abstract representations and descriptions can be generated. Careful selection of these so-called low-level operations is critical for the success of higher level scene interpretation algorithms. One of the first operations that a machine vision system must perform is the separation of objects from the background. This operation, commonly called segmentation, is approached in one of two ways: (1) an edge-based method for locating discontinuities in certain properties or (2) a region-based method for the grouping of pixels according to certain similarities.

Edge-Based Segmentation

In an edge-based approach, the boundaries of objects are used to partition an image. Points that lie on the boundaries of an object must be marked. Such points, called edge points, can often be detected by analyzing the local neighborhood of a point. By definition, the regions on either side of an edge point (i.e., the object and background) have dissimilar characteristics. Thus, in edge detection, the emphasis is on detecting dissimilarities in the neighborhoods of points.

Gradient

An edge in an image is indicated by a significant local change in image intensity, usually associated with a discontinuity in either the image intensity or the first derivative of the image intensity. Therefore, a direct approach to edge detection is to compute the gradient at each pixel in an image. The gradient is the two-dimensional equivalent to the first derivative and is defined as the vector

image

image

Only those pixels whose gradient magnitude is larger than a predefined threshold are identified as edge pixels.

Many approximations have been used to compute the partial derivatives in the x and y directions. One of the earlier edge detectors, the Roberts’ cross operator, computes the partial derivatives by taking the difference in intensities of the diagonal pixels in a 2 × 2 window. Other approximations, such at the Prewitt and Sobel operators, use a 3 × 3 window to calculate the partial derivatives. Occasionally, operators that compute the edge strength in a number of specific directions are used in machine vision. These directional operators are defined over 3 × 3 or larger neighborhoods. For applications where such simple edge detectors are not adequate, the Canny edge detector, which attempts to optimize noise suppression with edge localization, is often used. See Fig. 19.44 for a description of the window operators used in each of the mentioned edge operators.

Laplacian

When using gradient-based edge detectors, multiple responses are often obtained at adjacent pixels de- pending on the rate of transition of the edge. After thresholding, thick edges are usually obtained. However, it is desired to obtain only a single response for a single edge; in other words, only keep the maximum of the gradient and not every response that is above a specified threshold. The maximum of the gradient is found by detecting the zero crossings in the second derivative of the image intensity function. The Laplacian is defined in terms of the second partial derivatives as follows

image

By combining these two equations, the Laplacian can be implemented in a single window operator (see Fig. 19.44).

The response of the Laplacian operator can be computed in one step by convolving the image with the appropriate window operator. Nevertheless, since the Laplacian is an approximation to the second derivative, it reacts more strongly to lines, line ends, and noise pixels than it does to edges; plus it generates two responses for each edge, one positive and one negative on either side of the edge. Hence, the zero crossing between the two responses is used to localize the edge.

Laplacian of Gaussian

Detecting edge points from the zero crossings of the second derivative of the image intensity is very noisy. Therefore, it is often desirable to filter out the noise before edge detection. To do this, the Laplacian of Gaussian (LoG) combines Gaussian filtering with the Laplacian for edge detection. The output of the

imageis commonly called the Mexican hat operator because of its appearance when plotted (see Fig. 19.45). This result shows that the Laplacian of Gaussian can be obtained in either of two ways: (1) Con- volve the image with a Gaussian smoothing filter and compute the Laplacian of the result. (2) Convolve the image with a filter that is the Laplacian of the Gaussian filter. The zero crossings still must be detected in order to localize the edges; and like the Laplacian, only those edge points whose corresponding first derivative is abovea specified thresh- old are marked as edge points.

image

When using the Laplacian of Gaussian approach, edges are detected at a particular resolution (scale) depending on the spread of the Gaussian filter used. The determination of real edges in any image may require the combination of information from operators at several scales using a scale-space approach. The presence of edges at a particular resolution are found at the appropriate scale, and the exact locations of the edges are obtained by tracking their locations through lower values of σ .

Surface Fitting

Since a digital image is actually a sampling of a continuous function of two-dimensional spatial variables, another viable approach to edge detection is to approximate and reconstruct the underlying continuous spatial function that the image represents. This process is termed surface fitting. The intensity values in the neighborhood of a point can be used to obtain the underlying continuous intensity surface, which then can be used as a best approximation from which properties in the neighborhood of the point can be computed. The continuous intensity finction can be described by

image

If the image represents one surface, the preceeding equation will correctly characterize the image. However, an image generally contains several surfaces, in which case this equation would be satisfied only at local surface points. Therefore, this approach uses the intensity values in the neighborhood about each pixel to approximate a local surface about that point. The facet model is a result of this idea. In the facet model, the neighborhood of a point is approximated by the cubic surface patch that best fits the area using

image

where r and c are local coordinates about the point in the center of the neighborhood being approximated. From this approximation, the second directional derivative can be calculated and the zero crossings can be detected, and the edge points can be found.

Edge Linking

The detection of edge pixels is only part of the segmentation task. The outputs of typical edge detectors must be linked to form complete boundaries of objects. Edge pixels seldom from closed boundaries; missed edge points will result in breaks in the boundaries. Thus, edge linking is an extremely important, but difficult, step in image segmentation. Several methods have been suggested to improve the performance of edge detectors ranging from relaxation-based edge linking, which uses the magnitude and direction of an edge point to locate other edges in the neighborhood, to sequential edge detectors—also called edge trackers—which finds a strong edge point and grows the object boundary by considering neighboring edge strengths and directions.

Region-Based Segmentation

In region-based segmentation, all pixels corresponding to a single object are grouped together and are marked to indicate that they belong to the same object. The grouping of the points is based on some criterion that distinguishes pixels belonging to the same object from all other pixels. Points that have similar characteristics are identified and grouped into a set of connected points, called regions. Such points usually belong to a single object or part of an object. Several techniques are available for segmenting an image using this region-based approach.

Region Formation

The segmentation process usually begins with a simple region formation step. In this step, intrinsic characteristics of the image are used to form initial regions. Thresholds obtained from a histogram of the image intensity are commonly used to perform this initial grouping. In general, an image will have several regions, each of which may have different intrinsic characteristics. In such cases, the intensity histogram of the image will show several peaks; each peak may correspond to one or more regions. Several thresholds are selected using these peaks. After thresholding, a connected-component algorithm can be used to find initial regions.

Thresholding techniques usually produce too many regions. Since they were formed based only on first- order characteristics, the regions obtained are usually simplistic and do not correspond to complete objects. The regions obtained via thresholding may be considered to be only the first step in segmentation. After the initial histogram-based segmentation, more sophisticated techniques are used to refine the segmentation.

Split and Merge

Automatic refinement of an initial intensity-based segmentation is often done using a combination of split and merge operations. Split and merge operations eliminate false boundaries and spurious regions by either splitting a region that contains pieces from more than one object or merging adjacent regions that actually belong to the same object. If some property of a region is not uniform, the region should be split. Segmentation based on the split approach starts with large regions. In many cases, the whole image may be used as the starting region. Several decisions must be made before a region is split. One is to decide “when” a property is nonuniform over a region; another is “how” to split a region so that the property for each of the resulting components is uniform. These decisions usually are not easy to make. In some applications, the variance of the intensity values is used as a measure of uniformity.

More difficult than determining the property uniformity is deciding “where” to split a region. Splitting regions based on property values is very difficult. One approach used when trying to determine the best boundaries with which to divide a region is to consider edgeness values within a region. The easiest schemes for splitting region are those that divide a region into a fixed number of equal regions; such methods are called regular decomposition methods. For example, in the quad tree approach, if a region is considered nonuniform, it is split into four equal quadrants in each step.

Many approaches have been proposed to judge the similarity of regions. Broadly, the approaches are based on either the characteristics of regions or the weakness of edges between them. Two common approaches to judging the similarity of adjacent regions based on region characteristics are to (1) compare their mean intensities and (2) assume their intensity values are drawn from a known probability distribution. In the first approach, if their mean intensities do not differ by more than some predetermined value, the regions are considered to be similar and are candidates for merging. A modified form of this approach uses surface fitting to determine if the regions can be approximated by one surface. In the latter approach, the decision of whether or not to merge adjacent regions is based on considering the probability that they will have the same statistical distribution of intensity values. This approach uses hypothesis testing to judge the similarity of adjacent regions.

Another approach to merging is to combine two regions only if the boundary between them is weak. A weak boundary is one for which the intensities on either side differ by less than a given threshold. This approach attempts to remove weak edges between adjacent regions by considering not only the intensity characteristics, but also the length of the common boundary. The common boundary is dissolved if it is weak and the resulting boundary (of the merged region) does not grow too fast.

Split and merge operations may be used together. After a presegmentation based on thresholding, a succession of splits and merges may be applied as dictated by the properties of the regions. Such schemes have been proposed for segmentation of complex scenes. Domain knowledge with which the split and merge operations can be controlled may also be introduced.

Other Segmentation Methods

In the preceeding discussion, the primary focus was with intensity images. Segmentation techniques that are based on color, texture, and motion have also been developed. Segmentation based on spectral pattern classification techniques is used extensively in remote-sensing applications.

Feature Extraction and Matching

Segmented images are often represented in a compact form to facilitate further abstraction. Representation schemes are chosen to match methods used for object recognition and description. The task of object recognition requires matching an object description in an image to models of known objects. The models, in turn, use certain descriptive features and their relations. Matching also plays an important role in other aspects of information recovery from images. In the following, schemes for representation and description that are popular in machine vision are discussed along with techniques for feature extraction and matching.

Representation and Description

Representation and description of symbolic information can be approached in many ways. One approach is to represent the object in terms of its bounding curve. Popular among several methods developed for boundary representation are chain codes, polygonalization, one-dimensional signatures, and representations using dominant points for representing an object. Another approach is to obtain region-based shape descriptors, such as topological or texture descriptors. Representation and shape description schemes are usually chosen such that the descriptors are invariant to rotation, translation, and scale changes.

Chain Codes

One of the earliest methods for representing a boundary uses directional codes, called chain codes. The object boundary is resampled at an appropriate scale, and an ordered list of points along the boundary is represented by a string of directions codes (see Fig. 19.46(a)). Often to retain all of the information in the boundary, the resampling step is bypassed. However, resampling eliminates minor fluctuations that typically are due to noise. Chain codes possess some attractive features; namely, the rotation of an object by multiples of 45◦ is easily implemented; the derivative of the chain code, the difference code obtained by computing the first differences of the chain code, is rotation invariant; and other characteristics of a region, such as area and corners, can be computed directly from the chain code. The limitations of this

image

representation method are attributed to the restricted directions used to represent the tangent at a point. Although codes with larger numbers of directions are occasionally used, the eight-directional chain code is the most commonly used.

Polygonalization

Polygonal approximation of boundaries has been studied extensively and numerous methods have been developed. The fit of a polygon is made to reduce a chosen error criterion between the approximation and the original curve. In an interative endpoint scheme, the first step is to connect a straight-line segment between the two farthest points on the boundary. The perpendicular distances from the segment to each point on the curve is measured. If any distance is greater than a chosen threshold, the segment is replaced by two segments; one each from the segment endpoint to the curve point where the distance to the segment is greatest. In another approach, a straight-line fit is constrained to pass within a radius around each data point. The line segment is grown from the first point, and when further extension of the line segment causes it to fall outside the radius point, a new line is started. A minimax approach can also be used in which the line segment approximations are chosen to minimize the maximum distance between the data points and the approximating line segment.

Besides polygonal approximation methods, higher order curve- and spline-fitting methods may be used where more precise approximations are required. These are more computationally expensive than most polygonalization methods, and they can be more difficult to apply.

One-Dimensional Signatures

The slope of the tangent to the curve denoted by the angle θ as a function of s , the position along the curve from an arbitrary starting point, is used to represent curves in many applications. Plots of these functions have some interesting and useful characteristics. Horizontal lines in s θ plots represent straight lines and straight lines at an angle with the horizontal represent circular arcs whose radii are proportional to the slope of the straight line. An s θ curve can also be treated as a periodic function with a period given by the perimeter of the curve; hence, Fourier techniques can be used. Other functions, such as the distance to the curve from an arbitrary point inside the curve plotted as a function of the angle with reference to the horizontal, are also used as shape signatures. Figure 19.46(b) shows a simple geometric object and its one-dimensional signature.

Boundary Descriptors

Descriptors for objects represented by their boundaries may be generated using the representations already described. Simple descriptors, such as perimeter, length, and orientation of the major axis, shape number, and eccentricity, may be readily computed from the boundary data. The ordered set of points on the boundary having two-dimensional coordinates (xk , yk ), where k = 1, ... , N and N is the total number of points on the boundary, can be treated as a one-dimensional complex function xk + iyk . The coefficients of the discrete Fourier transform applied to this function can also be used as a shape descriptor.

Other descriptors that use the one-dimensional signature functions may also be obtained. A major drawback of many of these descriptors is that complete data for the object boundary are required. Because of either problems in segmentation or occlusions in the image, however, complete data for the object boundary are often not available. In such instances, recognition strageties based on partial information are needed. Many region-based representation and description methods analogous to those used to represent object boundaries have been developed. Examples of such methods are the medial-axis transform, skeletons, convex hulls, and deficiencies. Morphological operators have been developed to extract shape features and generate useful descriptions of object shape. Topological descriptors, such as Euler number, are also useful to characterize shape. The facet model has even been used to generate a topographic primal sketch of images using a set of seven descriptive labels, including pit, peak, and ridge to name a few. Such descriptions are useful in object matching. Region-based representation and description are particularly useful to describe objects for which properties within the region, for example, texture, are significant for object recognition.

For a complete discussion of these topics, refer to the references at the end of this chapter.

Feature Extraction

If the object to be recognized has unique discriminating features, special-purpose algorithms may be employed to extract such features. Important for object matching and recognition are corners, high-curvature regions, inflection points, or other places along curves at which curvature discontinuities exist. In region- based matching methods, identifying groups of pixels that can be easily distinguished and identified is important. Many methods have been proposed to detect both dominant points in curves and interesting points in regions.

Critical Points

The detection of critical points, also called dominant points, in curves, such as corners and inflection points, is important for subsequent object matching and recognition. Most algorithms for detecting critical points mark local curvature maxima as dominant. One approach is to analyze the deviations of a curve from a chord to detect dominant points along the curve. Points are marked as either being critical or belonging to a smooth or noisy interval. These markings depend on whether the curve makes a single excursion away from the chord, stays close to the chord, or makes two or more excursions away from the chord, respectively. Other approaches use mathematical expressions to directly compute and plot the curvature values along the contour.

Interesting Points

Points used in matching between two images must be ones that are easily identified and matched. These are known as interesting points. Obviously, those points in a uniform region and on edges are not good candidates for matching. Interest operators find image areas with high variance. In applications such as stereo and structure from motion, images should have enough such interesting regions to facilitate matching.

One commonly used interest operator, the Moravec interest operator, uses directional variances as a measure of how interesting a point is. A point is considered interesting if it has a local maximum of minimal sums of directional variances. The directional variances in the local neighborhood about a point are calculated by

imagewhere s represents the neighborhood about the current point. Typical neighborhoods range from 5 × 5 to 11 × 11 pixels. The interestingness of the point is then given by

image

Feature points are chosen where the interestingness is a local maximum. Doing this eliminates the detection of simple edge points since they have no variance in the direction of the edge. Furthermore, a point is considered a good interesting point if its local maximum is above a preset threshold. The Moravec interest operator has found extensive use in stereo matching applications.

Matching

Matching plays a very important role in many phases of machine vision. Object recognition requires matching a description of an object with models of known objects. The goal of matching is to either (1) detect the presence of a known entity, object, or feature or (2) find what an unknown image component is. The difficulty in achieving these matching goals is first encountered with goal-directed matching, wherein the goal is to find a very specific entity in an image. Usually, the location of all instances of such an entity must be found. In stereo and structure-from-motion applications, entities are obtained in one image, and their locations are then determined in a second image. The second problem requires matching an unknown entity with several models to determine which model matches best.

Point Pattern Matching

In matching points in two slightly different images of the same scene (i.e., in a stereo image pair or a motion sequence), interesting points are detected by applying an operator such as the Moravec interest operator. The correspondence process considers the local structure of a selected point in one image in order to assign initial matchable candidate points from the second image. However, this correspondence problem is not an easy one to solve, and many constraints are often imposed to ease the process. For example, in stereo-matching applications, the displacements of a point from one image to the other are usually small. Thus, only points within a local neighborhood are considered for matching. To obtain the final correspondence, the set of initial matches is refined by computing the similarity in global structure around each candidate point. In dynamic-scene analysis, one may assume that motions of neigh- boring points do not differ significantly. To obtain the final matching of points in the two images, relaxation techniques are often employed. An example of the point matching problem is illustrated in Fig. 19.47.

image

Template Matching

In some applications, a particular pictorial or iconic structure, called a template, is to be detected in an image. Templates are usually represented by small two-dimensional intensity functions (typically less than 64 × 64 pixels). Template matching is the process of moving the template over the entire image and detecting the locations at which the template best fits the image. A common measure of similarity to determine a match is the normalized cross correlation. The correlation coefficient is given by

image

where g (u, v ) is the template, f (x, y) the image, and R the region spanned by the template. The value M takes maximum value for the point (x, y) at which g = cf (in other words where the pixel values of the template and the image only differ by a constant scaling factor). By thresholding the result of this

image

FIGURE 19.48 (a) A test image. (b) a template (enlarged) of the letter e. (c) the results of the normalized cross correlation. (d) the thresholded result indicating the match locations (T = 240). (Source: Jain, R., Kasturi, R., and Schunck, B.G. 1995. Machine Vision. McGraw-Hill, New York. With Permission.)

cross-correlation operation, the locations of a template match can be found. Figure 19.48 shows a test image, a template, and the results of the normalized cross correlation.

A major limitation of the template-matching technique is its sensitivity to the rotation and scaling of objects. To match scaled and rotated objects, separate templates must be constructed. In some approaches, a template is partitioned into several subtemplates, and matching is carried out for these subtemplates. The relationships among the subtemplates are verified in the final matching step.

Hough Transform

Parametric transforms, such as the Hough transform, are useful methods for the recognition of straight lines and curves. For a straight line, the transformation into the parameter space is defined by the parametric representation of a straight line given by

image

where (ρ, θ ) are the variables in the parameter space that represent the length and orientation, respectively, of the normal to the line from the origin. Each point (x, y) in the image plane transforms into a sinusoid in the (ρ, θ ) domain. However, all sinusoids corresponding to points that are colinear in the image plane will intersect at a single point in the Hough domain. Thus, pixels belonging to straight lines can be easily detected.

The Hough transform can also be defined to recognize other types of curves. For example, points on a circle can be detected by searching through a three-dimensional parameter space of (xc , yc , r ) where the first two parameters define the location of the center of the circle and r represents the radius. The Hough trans- form can also be generalized to detect arbitrary shapes. However, one problem with the Hough transform is the large parameter search space required to detect even simple curves. This problem can be alleviated some- what by the use of additional information that may be available in the spatial domain. For example, in detecting circles by the brute-force method, searching must be done in a three-dimensional parameter space; however, when the direction of the curve gradient is known, the search is restricted to only one dimension.

Pattern Classification

Features extracted from images may be represented in a multidimensional feature space. A classifier—such as a minimum distance classifier, which is used extensively in statistical pattern recognition—may be used to identify objects. This pattern classification method is especially useful in applications wherein the objective is to assign a label, from among many possible labels, to a region in the image. The classifier may be taught in a supervised-learning mode, by using prototypes of known object classes, or in an unsupervised mode, in which the learning is automatic. Proper selection of features is crucial for the success of this approach. Several methods of pattern classification using structural relationships have also been developed. For a complete discussion of pattern classification, see Duda and Hart (1973).


Machine Vision : Introduction , Relationship to Other Fields , Fundamentals of Vision , Image Formation , Imaging Geometry , Image Intensity , Sampling and Quantization , Color Vision , Range Imaging , Imaging Radar , Triangulation , Structured Lighting and Active Vision .

Machine Vision
Introduction

Machine vision, also known as computer vision, is the scientific discipline whereby explicit, meaningful descriptions of physical objects from the world around us are constructed from their images. Machine vision produces measurements or abstractions from geometrical properties and comprises techniques for estimating features in images, relating feature measurements to the geometry of objects in space, and interpreting this geometric information. This overall task is generally termed image understanding.

The goal of a machine vision system is to create a model of the real world from images or sequences of images. Since images are two-dimensional projections of the three-dimensional world, the information is not directly available and must be recovered. This recovery requires the inversion of a many-to-one mapping. To reclaim this information, however, knowledge about the objects in the scene and projection geometry is required.

At every stage in a machine vision system decisions must be made requiring knowledge of the application or goal. Emphasis in machine vision systems is on maximizing the automatic operation at each stage, and these systems should use knowledge to accomplish this. The knowledge used by the system includes models of features, image formation, objects, and relationships among objects. Without explicit use of knowledge, machine vision systems can be designed to work only in a very constrained environment for limited applications. To provide more flexibility and robustness, knowledge is represented explicitly and is directly used by the system. Knowledge is also used by the designers of machine vision systems in many implicit as well as explicit forms. In fact, the efficacy and efficiency of a system is usually governed by the quality of the knowledge used by the system. Difficult problems are often solvable only by identifying the proper source of knowledge and appropriate mechanisms to use it in the system.

Relationship to Other Fields

Machine vision is closely related to many other disciplines and incorporates various techniques adopted from many well-established fields, such as physics, mathematics, and psychology. Techniques developed from many areas are used for recovering information from images. In this section, we briefly describe some very closely related fields.

Image processing techniques generally transform images into other images; the task of information recovery is left to a human user. This field includes topics such as image enhancement, image compression, and correcting blurred or out-of-focus images (Gonzalez and Woods, 1982). On the other hand, machine vision algorithms take images as inputs but produce other types of outputs, such as representations for the object contours in an image or the motion of objects in a series of images. Thus, emphasis in machine vision is on recovering information automatically, with minimal interaction with a human. Image processing algorithms are useful in the early stages of a machine vision system. They are usually used to enhance particular information and suppress noise.

Computer graphics generates images from geometric primitives such as lines, circles, and free-form sur- faces. Computer graphics techniques play a significant role in visualization and virtual reality (Foley et al., 1990). Machine vision is the inverse problem: estimating the geometric primitives and other features from the image. Thus, computer graphics is the synthesis of images, and machine vision is the analysis of images. However, these two fields are growing closer. Machine vision is using curve and surface representations and several other techniques from computer graphics, and computer graphics is using many techniques from machine vision to enter models into the computer for creating realistic images. Visualization and virtual reality are bringing these two fields closer.

Pattern recognition classifies numerical and symbolic data. Many statistical and syntactical techniques have been developed for classification of patterns. Techniques from pattern recognition play an important role in machine vision for recognizing objects. In fact, many vision applications rely heavily on pattern recognition. Object recognition in machine vision usually requires many other techniques. For a complete discussion of pattern recognition techniques, see Duda and Hart (1973).

Artificial intelligence is concerned with designing systems that are intelligent and with studying computational aspects of intelligence (Winston, 1992; Tanimoto, 1995). Artificial intelligence is used to analyze scenes by computing a symbolic representation of the scene contents after the images have been processed to obtain features. Artificial intelligence may be viewed as having three stages: perception, cognition, and action. Perception translates signals from the world into symbols, cognition manipulates the symbols, and action translates the symbols into signals that effect changes in the world. Many techniques from artificial intelligence play important roles in all aspects of machine vision. In fact, machine vision is of- ten considered a subfield of artificial intelligence. Directly related to artificial intelligence is the study of neural networks. The design and analysis of neural networks has become a very active field in the last decade (Kosko, 1992). Neural networks are being increasingly applied to solve some machine vision problems.

Psychophysics, along with cognitive science, has studied human vision for a long time (Marr, 1982). Some techniques in machine vision are related to what is known about human vision. Many researchers in computer vision are more interested in preparing computational models of human vision than in de- signing machine vision systems. Therefore, some of the techniques used in machine vision have a strong similarity to those in psychophysics.

Fundamentals of Vision

Like other developing disciplines, machine vision is based on certain fundamental principles and techniques. To design and develop successful machine vision systems, one must have a full understanding of all aspects of the system, from initial image formation to final scene interpretation. The following is a list of the primary topics in machine vision:

✁ Image formation

✁ Segmentation

✁ Feature extraction and matching

✁ Three-dimensional object recognition

✁ Dynamic vision

In each of these processes, numerous factors influence the choice of algorithms and techniques to be used in developing a specific system. The system designer should be knowledgeable about the design issues of the system and the tradeoffs between the various algorithms and techniques available. In the following, we very briefly introduce these topics. Throughout the following sections, we make no attempt to cite all original work as the list would be nearly endless. The references, however, do give credit appropriately, and we refer you to the Further Information section for a complete discussion on these and many other topics.

Image Formation

An image is formed when a sensor records received radiation as a two-dimensional function. The brightness or intensity values in an image may represent different physical entities. For example, in a typical image obtained by a video camera, the intensity values represent the reflectance of light from various object surfaces in the scene; in a thermal image, they represent the temperature of corresponding regions in the scene; and in range imaging, they represent the distance from the camera to various points in the scene. Multiple images of the same scene are often captured using different types of sensors to facilitate more robust and reliable interpretation of the scene. Selecting an appropriate image formation system plays a key role in the design of practical machine vision systems. The following sections describe the principles of image formation.

Imaging Geometry

A simple camera-centered imaging model is shown in Fig. 19.38. The coordinate system is chosen such that the xy plane is parallel with the image plane and the z axis passes through the lens center at a distance f , the focal length of the camera, from the image plane. The image of a scene point (x, y, z) forms a point (xt, yt) on the image plane where

image

These are the perspective projection equations of the imaging system.

In a typical imaging situation, the camera may have several degrees of freedom, such as translation, pan, and tilt. Also, more than one camera may be imaging the same scene from different points. In this case, it is convenient to adopt a world coordinate system in reference to which the scene coordinates and camera coordinates are defined. In this situation, however, the imaging equations become more cumbersome and we refer you to the references at the end of this chapter for a more complete discussion of imaging geometry including camera calibration.

Image Intensity

Although imaging geometry uniquely determines the relationship between scene coordinates and image coordinates, the brightness or intensity at each point is determined not only by the imaging geometry but also by several other factors, including scene illumination, reflectance properties and surface orientations of objects in the scene, and radiometric properties of the imaging sensor.

The reflectance properties of a surface are characterized by its bidirectional reflectance distribution function (BRDF). The BRDF is the ratio of the scene radiance in the direction of the observer to the irradiance due to a light source from a given direction. It captures how bright a surface will appear when viewed from a given direction and illuminated by another. For example, for a flat Lambertian surface illuminated by a distant point light source, the BRDF is constant; hence, the surface appears equally bright from all directions. For a flat specular (mirrorlike) surface, the BRDF is an impulse function as determined by the laws of reflection.

image

The scene radiance at a point on the surface of an object depends on the reflectance properties of the surface, as well as on the intensity and direction of the illumination sources. For example, for a Lambertian surface illuminated by a point light source, the scene radiance is proportional to the cosine of the angle between the surface normal and the direction of illumination. This relationship between surface orientation and brightness is captured in the reflectance map. In the reflectance map for a given surface and illumination, contours of equal brightness are plotted as a function of surface orientation specified by the gradient space coordinates ( p, q ), where p and q are the surface gradients in the x and y directions, respectively. A typical reflectance map for a Lambertian surface illuminated by a point source is shown in Fig. 19.39. In this figure, the brightest point corresponds to the surface orientation such that its normal points in the direction of the source.

Since image brightness is proportional to scene radiance, a direct relationship exists between the image intensity at an image point and the orientation of the surface of the corresponding scene point. Shape-from-shading algorithms exploit this relationship to recover the three-dimensional object shape. Photo-metric stereo exploits the same principles to recover the shape of objects from multiple images obtained by illuminating the scene from different directions.

image

Sampling and Quantization

A continuous function cannot be represented exactly in a computer. The interface between the imaging system and the computer must sample the continuous image function at a finite number of points and represent each sample within a finite number of bits. This is called sampling and quantization. Each image sample is a pixel. Generally images are sampled on a regular grid of squares so that the horizontal and vertical distances between pixels are the same throughout the image. Each pixel is represented in the computer as a small integer and represented as a two-dimensional array. Frequently, a pixel is represented as an unsigned 8-b integer in the range of (0, 255), with 0 corresponding to black, 255 corresponding to white, and shades of gray distributed in between.

Many cameras acquire an analog image, which is then sampled and quantized to convert it to a digital image. The sampling rate determines how many pixels the digital image will have (image resolution), and the quantization determines how many intensity levels will be used to represent the intensity value at each sample point. As shown in Fig. 19.40(a) and Fig. 19.40(b), an image looks very different at different sampling

clip_image006

FIGURE 19.40 Sample image: (a) various spatial resolutions, (b) at differing numbers of quantization levels. Notice the blocky structure in (a) and the appearance of many false contours in (b). (Source: Jain, R., Kasturi, R., and Schunk, B.G. 1995. Machine Vision. McGraw-Hill, New York. With permission.)

rates and quantization levels. In most machine vision applications, the sampling rate and quantization are predetermined due to the limited choice available of cameras and image acquisition hardware. In many applications, however, it is important to know the effects of sampling and quantization.

Color Vision

The previous sections were only concerned with the intensity of light; however, light consists of a full spectrum of wavelengths. Images can include samples from a number of different wavelengths, leading to a color image. This perception of color depends on (1) the spectral reflectance of scene surfaces, (2) the spectral content of the illuminating light source, and (3) the spectral response of the sensors in the imaging system. In humans, color perception is attributed to differences in the spectral responses of the millions of neurochemical photoreceptors—rods and cones—in the retina. The rods are responsible for monochromatic vision and the cones are responsible for the sensation of color. The human visual system consists of three types of cones, each with a different spectral response. The total response each of the cones is often modeled by the integral

image

where λ is the wavelength of light incident on the receptor, f (λ) the spectral composition of the illumination, r (λ) the spectral reflectance function of the reflecting surface, and hi (λ) the spectral response of the i th type of receptor (cone).

In machine vision, color images are typically represented by the output of three different sensors, each having a different spectral response (e.g., the primary colors red, green, and blue). The choice of these primary colors determines the range of possible colors that can be realized by weighted combinations of the primaries. However, it is not necessary for the response of the sensors to be restricted to visible light. The sensors could just as easily respond to wavelengths in the infrared, ultraviolet, or X-ray portions of the electromagnetic spectrum, for example. In either case, the imaging system creates multiple images, called channels, one for each sensor. If the outputs from three sensors are used, this translates into a threefold increase in the processing and memory requirements. However, this increase is often offset by exploiting the extra dimensionality that is now available.

Range Imaging

Although three-dimensional information can be extracted from images with two-dimensional intensity—using image cues such as shading, texture, and motion—the problem is greatly simplified by range imaging. Range imaging is aquiring images for which the value at each pixel is a function of the distance of the corresponding point of the object from the sensor. The resulting images are known as range images or depth maps. A sample range image of a coffee cup is shown in Fig. 19.41. Here we will briefly discuss two common range imaging techniques, namely imaging radar and triangulation.

Imaging Radar

In a time-of-flight pulsed radar system, the distance to the object is computed by observing the time difference between transmitted and received electromagnetic pulses. Range information can also be obtained by detecting the phase difference between the transmitted and received waves of an amplitude-modulated beam or by detecting the beat frequency in a coherently mixed transmitted-and-received signal in a frequency-modulated beam.

image

imageFIGURE 19.42 A triangulation-based range imaging system. (Source: Best, P.J. 1988. Active, optical range imaging sensor. Machine Vision and Applications 1(2): 127–152.)

Triangulation

In an active triangulation-based range imaging system, a light projector and camera are aligned along the z axis separated by a baseline distance b as shown in Fig. 19.42. The object coordinates (x, y, z) are related to the image coordinates (xt, yt) and the projection angle θ by the following equation:

image

The accuracy with which the angle θ and the horizontal position xt can be measured determines the range resolution of such a triangulation system. This system of active triangulation uses a single point light source that is swept across the scene in a raster scan fashion.

Structured Lighting

Imaging using structured lighting refers to systems in which the scene is illuminated by a known geometric pattern of light. In a simple point projection system—like the triangulation system already described—the scene is illuminated, one point at a time, in a two-dimensional grid pattern. The depth at each point is calculated using the previous equation to obtain the range image. In a typical structured lighting system, either planes or two-dimensional patterns of light are projected onto the scene. A camera, which is displaced spatially from the source of illumination, records the patterns of light projected on the object light surfaces. The distortions contained in the observed images of the patterns are determined by the shape and orientation of surfaces of the objects on which the patterns are projected (see Fig. 19.43).

In situations where the scene is changing dynamically, projecting single light stripes in sequence may not be practical due to the sequential nature of the system. In this situation, a set of multiple light stripes—each uniquely encoded—is projected. For example, using a binary-coded scheme, a complete set of data can be acquired by projecting only log2 N patterns, where N − 1 is the total number of stripes in each pattern.

Other structured lighting techniques include color coding, grid coding, and Fourier domain processing. The primary drawback of any structured lighting technique is that data cannot be obtained for object points that are not visible to either the light source or the imaging camera.

Active Vision

Most machine vision systems rely on data captured by hardware with fixed characteristics. These systems include passive sensing systems—such as video cameras—and active sensing systems—such as laser range finders. In an active vision system, the parameters and characteristics of data capture are dynamically controlled by the scene interpretation system. Active vision systems may employ either active or passive sensors. In an active vision system, however, the state parameters of the sensors, such as focus, aperature, vergence, and illumination, are controlled to acquire data that will facilitate scene interpretation.

image


Design Example , Genetic Algorithms , Coding and Initialization , Selection and Reproduction , Reproduction and Mutation.

Design Example

Consider the design of a simple fuzzy controller for a sprinkler system. The sprinkling time is a function of humidity and temperature. Four membership functions are used for the temperature, three for humidity, and three for the sprinkle time, as shown in Fig. 19.35. Using intuition, the fuzzy table can be developed, as shown in Fig. 19.36(a).

Assume a temperature of 60◦F and 70% humidity. Using the membership functions for temperature and humidity the following fuzzy variables can be obtained for the temperature: (0, 0.2, 0.5, 0), and for

image

the humidity: (0, 0.4, 0.6). Using the min operator, the fuzzy table can be now filled with temporary fuzzy variables, as shown in Fig. 19.36(b). Note that only four fields have nonzero values. Using fuzzy rules, as shown in Fig. 19.36(a), the max operator can be applied in order to obtain fuzzy output variables: short → o1 = max{0, 0, 0.2, 0.5, 0} = 0.5, medium → o2 = max{0, 0, 0.2, 0.4, 0} = 0.4, long → o3 = max{0, 0} = 0. Using Eq. (19.47) and Fig. 19.35(c) a sprinkle time of 28 min is determined. When the simplified approach is used with Eq. (19.46) and Fig. 19.35(d), then sprinkle time is 27 min.

image

Genetic Algorithms

The success of the artificial neural networks encouraged researchers to search for other patterns in nature to follow. The power of genetics through evolution was able to create such sophisticated machines as the human being. Genetic algorithms follow the evolution process in nature to find better solutions to some complicated problems. The foundations of genetic algorithms are given by Holland (1975) and Goldberg (1989). After initialization, the steps selection, reproduction with a crossover, and mutation are repeated for each generation. During this procedure, certain strings of symbols, known as chromosomes, evaluate toward a better solution. The genetic algorithm method begins with coding and an initialization. All significant steps of the genetic algorithm will be explained using a simple example of finding a maximum

of the function (sin2 x − 0.5x)2 (Fig. 19.37) with the range of x from 0 to 1.6. Note that in this range, the function has a global maximum at x = 1.309, and a local maximum at x = 0.262.

image

image

Coding and Initialization

At first, the variable x has to be represented as a string of symbols. With longer strings, the process usually converges faster, so the fewer the symbols for one string field that are used, the better. Although this string may be the sequence of any symbols, the binary symbols 0 and 1 are usually used. In our example, six bit binary numbers are used for coding, having a decimal value of 40x. The process starts with a random generation of the initial population given in Table 19.3.

Selection and Reproduction

Selection of the best members of the population is an important step in the genetic algorithm. Many different approaches can be used to rank individuals. In this example the ranking function is given. Highest rank has member number 6, and lowest rank has member number 3. Members with higher rank should have higher chances to reproduce. The probability of reproduction for each member can be obtained as a fraction of the sum of all objective function values. This fraction is shown in the last column of Table 19.3. Note that to use this approach, our objective function should always be positive. If it is not, the proper normalization should be introduced at first.

Reproduction

The numbers in the last column of Table 19.3 show the probabilities of reproduction. Therefore, most likely members number 3 and 8 will not be reproduced, and members 1 and 6 may have two or more copies. Using a random reproduction process, the following population, arranged in pairs, could be generated

image

If the size of the population from one generation to another is the same, two parents should generate two children. By combining two strings, two other strings should be generated. The simplest way to do this is to split in half each of the parent strings and exchange substrings between parents. For example, from parent strings 010100 and 100111, the following child strings will be generated 010111 and 100100. This process is known as the crossover. The resultant children are

image

In general, the string need not be split in half. It is usually enough if only selected bits are exchanged between parents. It is only important that bit positions are not changed.

image

Mutation

In the evolutionary process, reproduction is enhanced with mutation. In addition to the properties inherited from parents, offspring acquire some new random properties. This process is known as mutation. In most cases mutation generates low-ranked children, which are eliminated in the reproduction process. Sometimes, however, the mutation may introduce a better individual with a new property. This prevents the process of reproduction from degeneration. In genetic algorithms, mutation usually plays a secondary role. For very high-levels of mutation, the process is similar to random pattern generation, and such a searching algorithm is very inefficient. The mutation rate is usually assumed to be at a level well below 1%. In this example, mutation is equivalent to the random bit change of a given pattern. In this simple case, with short strings and a small population, and with a typical mutation rate of 0.1%, the patterns remain practically unchanged by the mutation process. The second generation for this example is shown in Table 19.4.

Note that two identical highest ranking members of the second generation are very close to the solution x = 1.309. The randomly chosen parents for the third generation are

image

The best result in the third population is the same as in the second one. By careful inspection of all strings from the second or third generation, it may be concluded that using crossover, where strings are always split in half, the best solution 110100 →52 will never be reached, regardless of how many generations are created. This is because none of the population in the second generation has a substring ending with 100.

For such crossover, a better result can be only obtained due to the mutation process, which may require many generations. Better results in the future generation also can be obtained when strings are split in random places. Another possible solution is that only randomly chosen bits are exchanged between parents.

The genetic algorithm almost always leads to a good solution, but sometimes many generations are required. This solution is usually close to global maximum, but not the best. In the case of a smooth function the gradinet methods are converging much faster and to a better solution. GA are much slower, but more robust.

Defining Terms

Backpropagation: Training technique for multilayer neural networks.

Bipolar neuron: Neuron with output signal between −1 and +1.

Feedforward network: Network without feedback. Perceptron: Network with hard threshold neurons. Recurrent network: Network with feedback.

Supervised learning: Learning procedure when desired outputs are known.

Unipolar neuron: Neuron with output signal between 0 and +1.

Unsupervised learning: Learning procedure when desired outputs are unknown.

References

Fahlman, S.E. 1988. Faster-learning variations on backpropagation: an empirical study. Proceedings of the Connectionist Models Summer School, eds. Touretzky, D. Hinton, G., and Sejnowski, T. Morgan Kaufmann, San Mateo, CA.

Fahlman, S.E. and Lebiere, C. 1990. The cascade correlation learning architecture. Adv. Ner. Inf. Proc. Syst., 2, D.S. Touretzky, ed. pp. 524–532. Morgan, Kaufmann, Los Altos, CA.

Goldberg, D.E. 1989. Genetic Algorithm in Search, Optimization and Machine Learning. Addison-Wesley, Reading, MA.

Grossberg, S. 1969. Embedding fields: a theory of learning with physiological implications. Journal of Mathematical Psychology 6:209–239.

Hebb, D.O. 1949. The Organization of Behivior, a Neuropsychological Theory. John Wiley, New York. Hecht-Nielsen, R. 1987. Counterpropagation networks. Appl. Opt. 26(23):4979–4984.

Hecht-Nielsen, R. 1988. Applications of counterpropagation networks. Neural Networks 1:131–139. Holland, J.H. 1975. Adaptation in Natural and Artificial Systems. University. of Michigan Press, Ann Arbor,MI.

Hopfield, J.J. 1982. Neural networks and physical systems with emergent collective computation abilities.

Proceedings of the National Academy of Science 79:2554–2558.

Hopfield, J.J. 1984. Neurons with graded response have collective computational properties like those of two-state neurons. Proceedings of the National Academy of Science 81:3088–3092.

Kohonen, T. 1988. The neural phonetic typerater. IEEE Computer 27(3):11–22.

Kohonen, T. 1990. The self-organized map. Proc. IEEE 78(9):1464–1480.

Kosko, B. 1987. Adaptive bidirectional associative memories. App. Opt. 26:4947–4959.

Kosko, B. 1988. Bidirectional associative memories. IEEE Trans. Sys. Man, Cyb. 18:49–60.

McCulloch, W.S. and Pitts, W.H. 1943. A logical calculus of the ideas imminent in nervous activity. Bull.

Math. Biophy. 5:115–133.

Minsky, M. and Papert, S. 1969. Perceptrons. MIT Press, Cambridge, MA.

Nilsson, N.J. 1965. Learning Machines: Foundations of Trainable Pattern Classifiers. McGraw-Hill, New York.

Nguyen, D. and Widrow, B. 1990. Improving the learning speed of 2-layer neural networks, by choosing

initial values of the adaptive weights. Proceedings of the International Joint Conference on Neural Networks (San Diego), CA, June.

Pao, Y.H. 1989. Adaptive Pattern Recognition and Neural Networks. Addison-Wesley, Reading, MA.

Rosenblatt, F. 1958. The perceptron: a probabilistic model for information storage and organization in the brain. Psych. Rev. 65:386–408.

Rumelhart, D.E., Hinton, G.E., and Williams, R.J. 1986. Learning internal representation by error propagation. Parallel Distributed Processing. Vol. 1, pp. 318–362. MIT Press, Cambrige, MA.

Sejnowski, T.J. and Rosenberg, C.R. 1987. Parallel networks that learn to pronounce English text. Complex Systems 1:145–168.

Specht, D.F. 1990. Probalistic neural networks. Neural Networks 3:109–118.

Specht, D.F. 1992. General regression neural network. IEEE Trans. Neural Networks 2:568–576.

Wasserman, P.D. 1989. Neural Computing Theory and Practice. Van Nostrand Reinhold, New York.

Werbos, P. 1974. Beyond regression: new tools for prediction and analysis in behavioral sciences. Ph.D.

diss., Harvard Universtiy.

Widrow, B. and Hoff, M.E., 1960. Adaptive switching circuits. 1960 IRE Western Electric Show and

Convention Record, Part 4 (Aug. 23):96–104.

Widrow, B. 1962. Generalization and information storage in networks of adaline Neurons. In Self- organizing Systems, Jovitz, M.C., Jacobi, G.T. and Goldstein, G. eds. pp. 435–461. Sparten Books, Washington, D.C.

Wilamowski, M. and Torvik, L. 1993. Modification of gradient computation in the backpropagation algorithm. ANNIE’93—Artificial Neural Networks in Engineering. November 14–17, 1993, St. Louis, Missou.; also in Dagli, C.H. ed. 1993. Intelligent Engineering Systems Through Artificial Neural Networks Vol. 3, pp. 175–180. ASME Press, New York.

Zadeh, L.A. 1965. Fuzzy sets. Information and Control 8:338–353.

Zurada, J. M. 1992. Introduction to Artificial Neural Systems. West Publishing Company, St. Paul. MN.