Test 9. Working with debugger. Turn the LED on for the calculated period of time.
We select Debugger>Select Tool pull down menu and check MPLAB SIM. Addi- tional menu items will appear in the Debugger menu.
The MPLAB SIM simulator is integrated into MPLAB IDE integrated develop- ment environment.
MPLAB SIM allows us to:
· Modify object code and immediately re-execute it
· Trace the execution of the object code
The simulator is a software model, and not actual device hardware.
When MPLAB SIM is simulating running in real time, instructions are executing as quickly as the PC’s CPU will allow. This is usually slower than the actual de- vice would run at its rated clock speed.
The speed at which the simulator runs depends on the speed of our computer and how many other tasks we have running in the background.
Once we have chosen a debug tool, we will see changes in the following on the IDE:
1. The status bar on the bottom of the MPLAB IDE window should change to "MPLAB SIM".
2. Additional menu items should now appear in the Debugger menu.
3. Additional toolbar icons should appear in the Debug Tool Bar. After position- ing the mouse cursor over a toolbar button, a brief description of the button’s function can be seen.
4. An MPLAB SIM tab is added to the Output window.
After positioning the mouse cursor over a toolbar button we can see a brief de- scription of the button’s function.
Standard debug windows allow to view the actual code, as well as the contents of program or data memory. The watch window displays the values of registers that are specified.
Next we select Debugger -> Reset -> Processor Reset and a green arrow shows where the program will begin (see Fig. 14). In our project it is the line:
which is loading working register with the value of 7.
In order to see if the code is operating as intended, we can watch the values being changed in the program. Selecting View>Watch brings up an empty Watch win- dow. There are two pull downs on the top of the Watch window. The one on the left labeled "Add SFR" can be used to add the Special Function Registers into the watch. We select from the list following Special Function Registers: WREG, STATUS, PORTB, PORTA, INTCON, CMCON and sequentially after each se- lection we have to click Add SFR to add respective register each of them to the window.
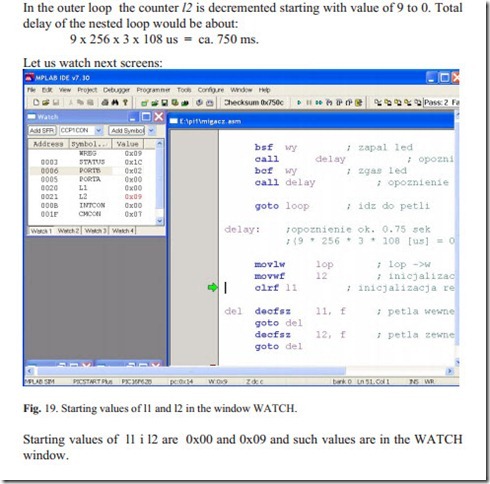
The pull down on the right, allows symbols to be added from the program. We use this pull down to add two our variables: l1 and l2 into the Watch window. We se- lect them from the list and then click Add Symbol to add them to the window. The Watch window should now show the address, value and name of the selected registers.
To single step through the application program, we select Debugger>Step Into or click the equivalent toolbar icon. This will execute the currently indicated line of
code and move the arrow to the next line of code to be executed. After repeating twice Step Into the value of 7 will be moved from WREG register into SFR CMCON.
The value of CMCON register in the Watch window is in red color because it was changed by the previous debug operation, values that were not changed are black.
We can continue single stepping through the code. Next instructions are: clearing registers PORTA and PORTB and clearing RBIE bit of the INTCON register. Clearing the RBIE mask disables interrupt-on-change feature of PORTB. Then we will set RP0 bit of STATUS register for selecting data memory bank 1 as is shown in figure 16.
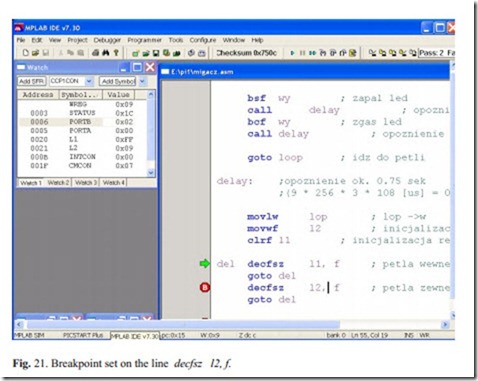
Instead of continuing single stepping through the code and executing thousands of steps, it is better to set a breakpoint on the selected line and run the code. To set a breakpoint, we can put the cursor on the selected line and click the right mouse button. Then select Set Breakpoint from the context menu. A red "B" will show on the line. (One can also double click on a line to add a breakpoint.)
On the figure below Breakpoint is set at the line, where l2 variable is decremented and tested., after inner loop has been executed 256 times.
We can enter Run mode by either clicking the Run button on the Debug toolbar, selecting Debugger>Run from the menu bar, or pressing <F9> on the keyboard. Some tools provide additional types of run, such as "Run to cursor" from the right- mouse menu.
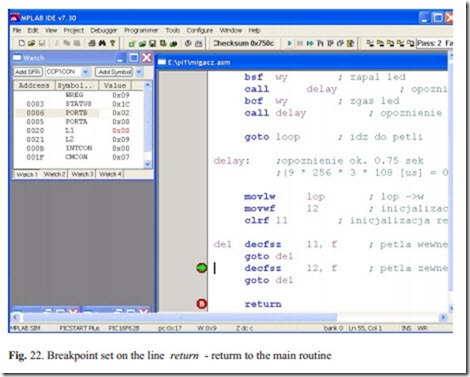
After running application the program code is executed until a breakpoint is en- countered. In the outer loop we decrement the variable l2. Next breakpoint should be set on the instruction return, in order to exit the subroutine del and return to main routine.


