Advanced Control Techniques
Although the single-loop PID controller is satisfactory in many process applications, it does not perform well for processes with slow dynamics, time delays, frequent disturbances, or multivariable interactions. We discuss several advanced control methods next, which can be implemented via computer control.
One of the disadvantages of using conventional feedback control for processes with large time lags or delays is that disturbances are not recognized until after the controlled variable deviates from its setpoint. One way to improve the dynamic response to disturbances is by using a secondary measurement point and a secondary controller; the secondary measurement point is located so that it recognizes the upset condition before the primary controlled variable is affected.
One such approach is called cascade control, which is routinely used in most modern computer control systems. Consider a chemical reactor, where reactor temperature is to be controlled by coolant flow to the jacket of the reactor (Fig. 18.58). The reactor temperature can be influenced by changes in disturbance variables such as feed rate or feed temperature; a feedback controller could be employed to compensate for such disturbances by adjusting a valve on the coolant flow to the reactor jacket. However, suppose an increase occurs in the coolant temperature as a result of changes in the plant coolant system. This will cause a change in the reactor temperature measurement, although such a change will not occur quickly, and the corrective action taken by the controller will be delayed.
Cascade control is one solution to this problem (see Fig. 18.59). Here the jacket temperature is measured and an error signal is sent from this point to the coolant control valve; this reduces coolant flow, maintaining the heat transfer rate to the reactor at a constant level and rejecting the disturbance. The cascade control configuration will also adjust the setting of the coolant control valve when an error occurs in reactor temperature. The cascade control scheme shown in Fig. 18.59 contains two controllers. The primary controller is the reactor temperature coolant temperature controller. It measures the reactor temperature, compares it to the setpoint, and computes an output that is the setpoint for the coolant flow rate controller. This secondary controller (usually a proportional only controller) compares the setpoint to the coolant
temperature measurement and adjusts the valve. The principal advantage of cascade control is that the secondary measurement (jacket temperature) is located closer to a potential disturbance in order to improve the closed-loop response. See Shinskey (1996) for a discussion of other applications of cascade control.
Multivariable Control
Many processes contain several manipulated variables and controlled variables and are called multivariable systems. An example of a multivariable process was shown in Fig. 18.49, where there are two manipulated variables (flow rate and heat transfer rate) and two controlled variables (tank level and temperature). In many applications we can treat a multivariable process with a set of single-loop controllers by pairing inputs and outputs in the most favorable way. Then each loop can be tuned separately using the techniques mentioned previously. One design method employs the relative gain array (McAvoy, 1983). This formula provides guidelines on which variable pairings should be selected for feedback control as well as gives a measure of the potential quality of control for such a multiloop configuration.
If the loop interactions are not severe, then each single-loop controller can be designed using the techniques described earlier in this section. However, the presence of strong interactions requires that the controllers be detuned to reduce oscillations. A better approach is to utilize multivariable control techniques, such as model predictive control. Multivariable control is often used in distillation towers as well as in refinery operations such as cracking or reforming.
Model Predictive Control
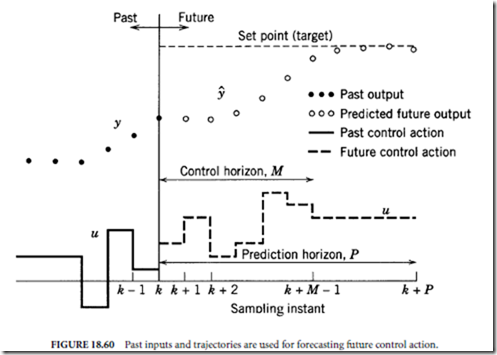
The model-based control strategy that has been most widely applied in the process industries is model predictive control (MPC). It is a general method that is especially well suited for difficult multi-input, multi-output (MIMO) control problems where there are significant interactions between the manipu- lated inputs and the controlled outputs. Unlike other model-based control strategies, MPC can easily accommodate inequality constraints on input and output variables such as upper and lower limits, or rate of change limits (Ogunnaike and Ray, 1995). These problems are addressed by MPC by solving an optimization problem (Seborg, Edgar, and Mellichamp, 2004). One formulation of an objective function to be minimized is shown below:
where yk refers to the output vector at time k, ysp is the set point for this output, Λuk = uk − uk−1 is the change of the input between time steps k − 1 and k, and Q and R are weighting matrices. This objective function will penalize deviations of the controlled variable from the desired set point over the prediction horizon of length P as well as changes in the manipulated variable over the control horizon of length M. The optimization determines a future input trajectory that minimizes the objective function subject to constraints on the manipulated as well as the controlled variables. The predictions yk are made based upon a model of the plant. This plant model will be updated using deviations between the predicted output and the real plant output from past data. An illustration of the trajectories for the manipulated (discrete trajectory) as well as the controlled variables (continuous trajectory) are shown in Figure 18.60.
A variety of different types of models can be used for the prediction. Choosing an appropriate model type is dependent upon the application to be controlled. The model can be based upon first-principles or it can be an empirical model. Also, the supplied model can be either linear or nonlinear, as long as the model predictive control software supports this type of model. Most industrial applications of MPC have relied on linear empirical models, because they can more easily be identified and solved and approximate most processes fairly well. Also, many MPC implementations change set points in order to move the plant to a desired steady state; the actual control changes are implemented by PID controllers in response to the set points. There are over 1000 applications of MPC techniques in oil refineries and petrochemical plants around the world. Thus, MPC has had a substantial impact and is currently the method of choice for difficult constrained multivariable control problems in these industries (Qin and Badgwell, 2003).
A key reason why MPC has become a major commercial and technical success is that there are numerous vendors who are licensed to market MPC products and install them on a turnkey basis. Consequently, even medium-sized companies are able to take advantage of this new technology. Payout times of 3–12 months have been reported. Refer to Maciejowski (2002) for further details on model predictive control.
Feedforward Control
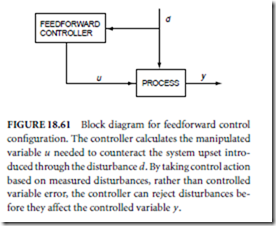
If the process exhibits slow dynamic response and disturbances are frequent, then the addition of feed forward control with feedback control may be advantageous. Feedforward control differs from feedback control in that the primary disturbance is measured via a sensor and the manipulated variable is adjusted so that the controlled variable does not change (see Fig. 18.61). To determine the appropriate settings for the manipulated variable, one must develop mathematical models which relate:
✁ The effect of the manipulated variable on the controlled variable.
✁ The effect of the disturbance on the controlled variable.
These models can be based on steady-state or dynamic analysis. The performance of the feedforward controller depends on the accuracy of both models. If the models are exact, then feedforward control offers the potential of perfect control, that is, holding the controlled variable precisely at the setpoint at all times because of the ability to predict the appropriate control action. However, because most mathematical models are only approximate and not all disturbances are measurable, it is standard practice to utilize
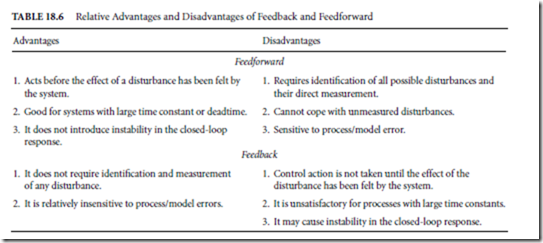
feedforward control in conjunction with feedback control. Table 18.6 lists the relative advantages and disadvantages of feedforward and feedback control. By combining the two control methods, the strengths of both schemes can be utilized.
The tuning of the controller in the feedback loop can be theoretically performed independent of the feedforward loop, that is, the feedforward loop does not introduce instability in the closed-loop response. For more information on feedforward/feedback control applications and design of such controllers, refer to Shinskey (1996).
Adaptive Control and Autotuning
Process control problems inevitably require on-line tuning of the controller constants to achieve a satis- factory degree of control. If the process operating conditions or the environment changes significantly, the controller may have to be retuned. If these changes occur quite frequently, then adaptive control techniques should be considered. An adaptive control system is one in which the controller parameters are adjusted automatically to compensate for changing process conditions (Astrom and Wittenmark, 1994). Several adaptive controllers have been field-tested and commercialized in the U.S. and abroad.
Most commercial control systems have an autotuning function that is based on placing the process in a controlled oscillation at very low amplitude, comparable with that of the noise level of the process. This is done via a relay-type step function with hysteresis. The autotuner identifies the dynamic parameters of the process (the ultimate gain and period) and automatically calculates Kc , τI , and τD using empirical tuning rules. Gain scheduling can also be implemented with this controller, using several sets of PI or PID controller parameters.
Statistical Process Control
Statistical process control (SPC), also called statistical quality control (SQC), has found widespread application in recent years due to the growing focus on increased productivity. Another reason for its increasing use is that feedback control cannot be applied to many processes due to a lack of on-line measurements as is the case in many microelectronics fabrication processes. However, it is important to know if these processes are operating satisfactorily. While SPC is unable to take corrective action while the process is moving away from the desired target, it can serve as an indicator that product quality might not be satisfactory and that corrective action should be taken for future plant operations.
For a process that is operating satisfactorily the variation of product quality will fall within acceptable bounds. These bounds usually correspond to the minimum and maximum values of a specified product property. Normal operating data can be used to compute the mean y¯ and the standard deviation σ of a given process variable from a series of n observations y1, y2, ... , yn as follows:
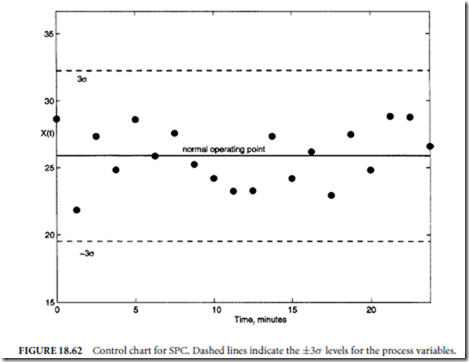
The standard deviation is a measure for how the values of y spread around their mean. A large value of σ indicates that wide variations in y occur. Assuming the process variable follows a normal probability distribution, then 99.7% of all observations should lie within an upper limit of y¯ + 3σ and a lower limit of y¯ − 3σ . These limits can be used to determine the quality of the control. If all data from a process lie within the ±3σ limits, then it can be concluded that nothing unusual has happened during the recorded time period, the process environment is relatively unchanged, and the product quality lies within specifications. On the other hand, if repeated violations of the limits occur, then the conclusion can be drawn that the process is out of control and that the process environment has changed. Once this has been determined, the process operator can take action in order to adjust operating conditions to counteract undesired changes that have occurred in the process conditions.
There are several specific rules that determine if a process is out of control. Some of the more widely used ones are the Western-Electric rules that state that a process is out of control if process data include
✁ One measurement outside the ±3σ control limit
✁ Any seven consecutive measurements lying on the same side of the mean
✁ A decreasing or increasing trend for any seven consecutive measurements
✁ Any nonrandom pattern in the process measurements
These rules can be applied to data in a control chart, such as a shown in Figure 18.62, where pressure measurements are plotted over a time horizon. It is then possible to read off from the control chart if the process is out of control or if it is operating within normal parameters.
Because a process that is out of control can have important economic consequences, such as product waste and customer dissatisfaction, it is important to keep track of the state of the process. Statistical process control provides a convenient method to continuously monitor process performance and product quality. However, it differs from automatic process control (such as feedback control) in that it serves as an indicator that the process is not operating within normal parameters. SPC does not automatically provide a controller setting that will bring the process back to its desired operating point or target.
More details on SPC can be found in References (Seborg, Edgar, and Mellichamp, 2004; Ogunnaike and Ray, 1995; Montgomery, 2001; Grant and Leavenworth, 1996).


