Turbine cascades
There is a fundamental difference between the flow in turbine cascades and that in compressor cascades that needs emphasizing. In turbine blade rows, the pressure is falling and the flow is accelerating. This means that
i. the boundary layers are much more stable and remain attached to the blades;
ii. the blades can accept a much higher loading without the danger of boundary layer separation;
iii. the flow deflection in a turbine blade row can be greater than 120o;
iv. the ratio of exit to inlet velocity, c2/c1, can be between 2 and 4;
v. the diffusion factor on the suction surface, DF, is typically only about 0.15, so there is no danger of boundary layer separation except at very low values of Reynolds number.
Figure 3.21 shows a sketch of the flow through an axial flow turbine cascade with the corresponding surface velocity distribution. This illustrates many of the features described previously and it is worth noting the rapid reduction in flow area through the cascade, which is what generates the high acceleration along the streamtube. The high acceleration and low levels of diffusion throughout the flow-field lead to turbine cascades having a wide range of low loss performance. This is in contrast to compressor cascades, which have a rather narrow range. This is also the basic reason why the pressure drop across turbine blades can be much higher than the pressure rise across compressor blades and why there are far fewer turbine stages than compressor stages in a turbojet engine.
Turbine loss correlations
A number of approaches have been made to predict the total pressure loss coefficients and flow deviation angles to the geometry of the turbine cascade and the incoming flow. A detailed account of the different methods and comparison of results found have been given by Horlock (1966), Dunham and Came (1970), Kacker and Okapuu (1981), Craig and Cox (1971), and others. In the
following account, it seems reasonable to limit the discussion to just two of the more prominent methods, namely,
i. the correlation of Ainley and Mathieson (1951);
ii. the correlation of Soderberg (1949).
Before embarking on the details of these correlations, it seems only fair to mention that so far as their accuracy goes that Soderberg’s method is adequate for making rapid estimates of turbine efficiency (which is dealt with in Chapter 4) and, according to Horlock (1966), can give efficiencies within 63%. However, these correlations are now quite dated and are not expected to be accu- rate for modern, highly loaded transonic turbine blade rows. Nowadays, correlations may be used during the preliminary design of turbines, but detailed cascade testing or computational analysis would always be applied to accurately determine the blade losses.
Correlation of Ainley and Mathieson
Ainley and Mathieson (1951) (A&M) reported a way of estimating the performance of an axial flow turbine, which has been widely used. The method determines the total pressure loss and gas efflux angle for each row of a turbine stage at a single reference diameter (the mean of the blade row inner and outer diameters) and under a wide range of inlet conditions. Dunham and Came (1970) gathered together details of several improvements to the method, which gave better performance prediction than the original method, particularly for small turbines. When the blading is competently designed, the revised method has been found to give reliable predictions of efficiency to within 62%.
According to A&M’s method, the total pressure loss in a turbine is composed of three parts:
i. a profile loss;
ii. a secondary loss;
iii. a tip clearance loss
and all of these are needed to determine the overall performance of a turbine stage.
In the following analysis, we are concerned only with the profile loss, since this is the component relevant to turbine cascades. The other two components of turbine loss, which require fairly extensive descriptions, are considered in Chapter 4.
The profile loss coefficient, defined by Eq. (3.6), is determined initially at zero incidence (i 5 0). At any other incidence, the profile loss ratio Yp/Yp(i50) is assumed to be defined by a unique function of the incidence ratio i/is as shown in Figure 3.22, where is is the stalling incidence, which is defined as the incidence where the profile loss ratio Yp=Ypði50Þ 5 2:0.
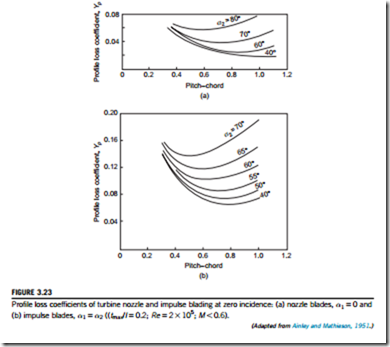
Next, A&M correlated the profile losses of turbine blade rows against space-chord ratio s/l, fluid outlet angle α2, blade maximum thickness-chord ratio tmax/l, and blade inlet angle. The variation of Yp(i50) against the space-chord ratio s/l is shown in Figure 3.23(a) for nozzle blade rows and in Figure 3.23(b)for impulse blading, both at various flow outlet angles.
For the sort of blading normally employed (intermediate between nozzle blades and impulse blades), the zero incidence total pressure loss coefficient devised by A&M is
All the values of Yp are taken at the same space-chord ratio and outlet flow angle.
Equation (3.45) includes a correction for the effect of the thickness-chord ratio and is valid in the range 0.15 # tmax/l # 0.25. If the actual blade has a tmax/l greater or less than the limits quoted, A&M recommended that the loss should be taken as equal to a blade having tmax/l either 0.25 or 0.15.
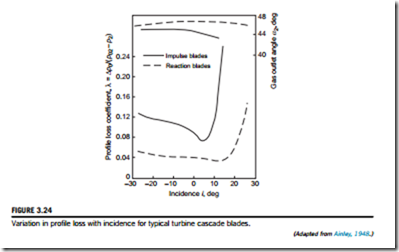
A feature of the losses given in Figure 3.23 is that, compared with the impulse blades, the noz- zle blades have a much lower total pressure loss coefficient. This observation confirms the results shown in Figure 3.24, that flows in which the mean pressure is falling always have a lower loss coefficient than flows in which the mean pressure is constant or increasing.
Reynolds number correction
A&M obtained their data for a mean Reynolds number of 2 3 105 based on the mean chord and exit flow conditions from the turbine state. They recommended that, for lower Reynolds numbers, down to 5 3 104, a correction be made to stage efficiency according to the rough rule
Soderberg’s correlation
A relatively simple method of estimating turbine blade row losses is to assemble the performance data on the overall efficiencies from a wide variety of turbines and from this determine the individual blade row stagnation pressure losses. Such a system was developed by Soderberg (1949) from a large number of tests performed on steam turbines and on cascades and extended to fit data obtained from small turbines with very low aspect ratio blading (small height-chord). Soderberg’s method was intended only for turbines conforming to the standards of “good design,” discussed later.
Horlock (1960) critically reviewed several widely used methods of obtaining design data for turbines. His paper confirms the claim made for Soderberg’s correlation that, although based on relatively few parameters, its accuracy is comparable with the best of the other methods available at the time. Soderberg found that with the optimum space-chord ratio (using Zweifel’s criterion), turbine blade losses could be correlated with space-chord ratio, blade aspect ratio, blade thickness-chord ratio, and Reynolds number.
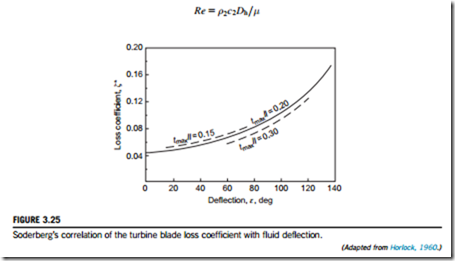
For turbine blade rows operating at the optimum load coefficient, with a Reynolds number of 105 and aspect ratio, H/b 5 blade height/axial chord, of 3, the “nominal” loss coefficient, ζ* (defined by Eq. (3.7)) is a simple function of the fluid deflection angle, ε 5 α1 1 α2, for a given thickness-chord ratio (tmax/l):
where ε is in degrees. Values of ζ* are drawn in Figure 3.25 as a function of deflection angle ε for several ratios of tmax/l.
This expression fits the Soderberg curve (for tmax/l 5 0.2) quite well with ε # 120o but is less accurate at higher deflections. For turbine rows operating at zero incidence, which is the basis of Soderberg’s correlation, the fluid deflection is little different from the blading deflection since, for turbine cascades, deviations are usually small. If the aspect ratio H/b is larger or less than 3, a correction to the nominal loss coefficient ζ* is made as follows: for nozzle rows,
where ζ1 is the energy loss coefficient at a Reynolds number of 105.
A further correction can be made if the Reynolds number is different from 105. As used in this section, the Reynolds number is based upon exit velocity c2 and the hydraulic diameter Dh at the throat section, defined by
Soderberg’s correlation of the turbine blade loss coefficient with fluid deflection.
where for a cascade geometry, Dh 5 2sH cos α2/(s cos α2 1 H). (Note: Hydraulic diame- ter 5 4 3 flow area4perimeter.)
The Reynolds number correction is Soderberg’s method of loss prediction can be used to estimate turbine efficiencies over a wide range of Reynolds numbers and aspect ratios when additional corrections are included to allow for tip leakage and disk friction. The method has been shown to be useful by Lewis (1996) and by Sayers (1990).
Mach number effects on loss
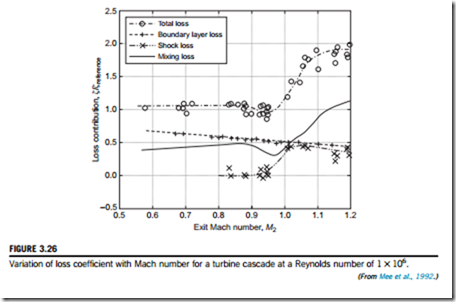
Figure 3.26 shows plots of how the various components of loss coefficient, ζ, vary with exit Mach number, M2, for a typical high-speed turbine cascade, taken fromMee et al. (1992). This plot demonstrates how the loss coefficient of a turbine blade rises rapidly as M2 approaches and exceeds unity. This rise in loss is not accounted for in the previous correlations, which do not include functions of Mach number. It is partly caused by the shock waves, but it is also due to mixing and the
complex trailing edge flow pattern. This pattern generates a low-pressure region at the trailing edge, causing a drag force to act on the blade. This region is investigated in detail within Sieverding, Richard, and Desse (2003).
The Zweifel criterion
For turbine cascade blades, there is an optimum space-chord ratio that gives a minimum overall
loss. Figure 3.27 illustrates the way the velocity distribution varies around the surface of a turbine blade in a cascade at three values of space-chord ratio. If the spacing between the blades is made
small, the fluid receives the maximum amount of guidance from the blades, but the friction losses will be large. On the other hand, with the same blades spaced well apart, friction losses are small but, because of poor fluid guidance, the losses resulting from flow separation are high. These con-
siderations led Zweifel (1945) to formulate his criterion for the optimum space-chord ratio of turbine blades having large deflection angles. Essentially, Zweifel’s criterion is simply that the ratio of an “actual” to an “ideal” tangential blade loading has an approximately constant value for minimum losses. The tangential blade loads are obtained from the real and ideal pressure distributions on both blade surfaces, as described here.
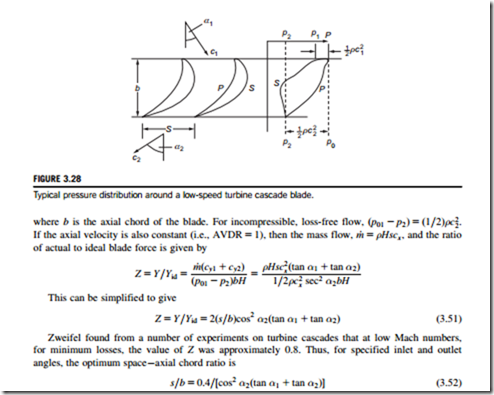
Figure 3.28 indicates a typical pressure distribution around one blade in an incompressible turbine cascade, curves P and S corresponding to the pressure (or concave) side and suction (convex) side, respectively. The pressures are projected parallel to the cascade front so that the area enclosed between the curves S and P represents the actual tangential blade load:
To give some idea of blade load capacity, the real pressure distribution is compared with an ideal pressure distribution giving a maximum load Yid without risk of fluid separation on the S sur- face. The conditions for this ideal load are fulfilled by p01 acting over the whole P surface and p2 acting over the whole S surface. With this pressure distribution, the ideal tangential load is
This shows that highly turning turbine blades, i.e., large (tan α1 1 tan α2), need to have a low pitch-axial chord ratio, whereas highly accelerating blades that have a high exit angle, i.e., small cos2 α2, can be spaced further apart.
According to Horlock (1966), Zweifel’s criterion accurately predicts optimum space-chord ratio for the data of A&M only for outlet angles of 60-70o. At other outlet angles, the criterion gives a less accurate estimate of optimum space-axial chord ratio, a conclusion supported by Aungier (2003). For modern blade designs, higher values of Z are common, particularly in the low- pressure turbines of jet engines, where there is a need to minimize the overall turbine weight and thus reduce the number of aerofoils required. Japikse and Baines (1994) suggest that the value of Zweifel’s coefficient used may be in excess of 1 in such cases.
For compressible flow turbine cascades, the assumptions used in deriving Eq. (3.51) are no longer valid and the compressible value of Z must be derived from Eqs (3.49) and (3.50), i.e.,
The optimum value of Z, as just defined, is found to decrease as the exit Mach number rises. This reduction occurs because the ideal dynamic pressure (p01 2 p2) increases rapidly with Mach number leading to a larger ideal blade force. For high Mach numbers, the coefficient can be evaluated using compressible flow relations as demonstrated in Example 3.4.
EXAMPLE 3.3
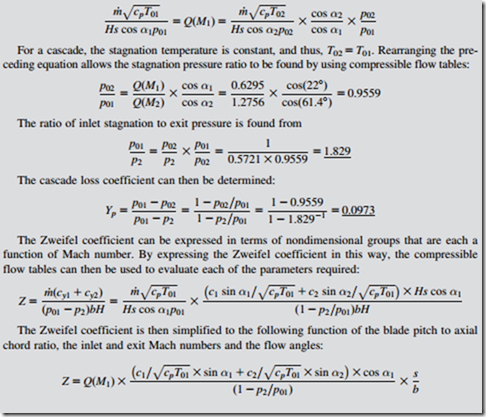
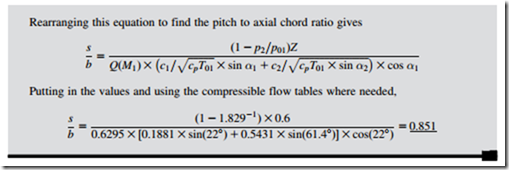
A two-dimensional linear turbine cascade operates in air with an inlet flow angle of 22o and an inlet Mach number of 0.3. The exit Mach number is measured as 0.93 with an exit flow angle of 61.4o. Calculate the ratio of inlet stagnation pressure to exit static pressure and determine the cascade stagnation pressure loss coefficient. If, for this operating condition, the Zweifel loading coefficient required for the cascade is 0.6, determine the pitch to axial chord ratio for the blades.
Solution
Applying continuity from inlet to exit of the cascade,
Flow exit angle
For turbine blades, the low amount of diffusion on the suction surface together with the thin boundary layers imply that the flow exit angle is much closer to the metal angle at the trailing edge than for a compressor cascade blade. (i.e., a small deviation angle). However, accurate prediction of the exit angle is extremely important because the downstream flow area, Hs cos α2, varies rather rapidly with the exit angle α2.
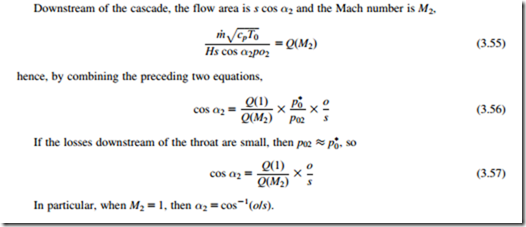
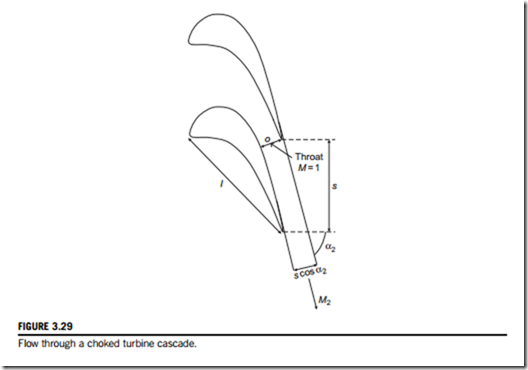
At high Mach numbers, the flow exit angle can be determined from compressible flow relation- ships. Figure 3.29 shows the flow through a choked turbine cascade. When the blade throat is choked the mass average, Mach number across the throat is unity, in which case (referring to Eq. (1.39)):
where o is the minimum distance at the blade throat, as shown in Figure 3.29, and p* is the stagnation pressure at that location. Once the flow is choked, conditions upstream of the throat are fixed and independent of the downstream pressure.
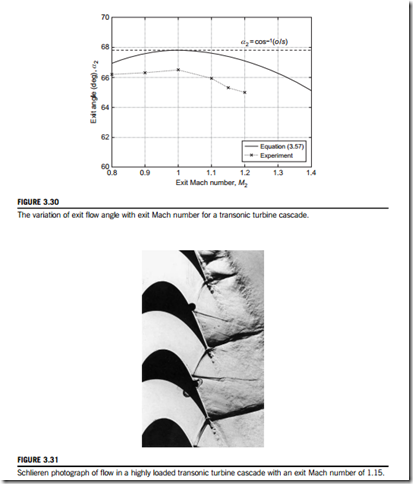
Figure 3.30 indicates how the angle α2 varies from subsonic to supersonic flow. For sub- sonic flows, the exit angle varies very little with Mach number. For supersonic exit flows, Q(M2) , Q(1) and it follows from Eq. (3.60) that α2 decreases. This is known as supersonic deviation. As shown by Figure 3.30, further deviation is observed in experimental measurements. This additional deviation relative to the theory is caused by stagnation pressure losses downstream of the throat, p02 , p* and the blockage caused by the growth of boundary layers on the blade surfaces.
Turbine limit load
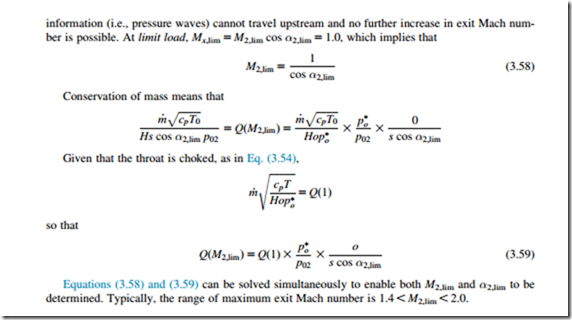
Turbines frequently operate with supersonic exit flows and at such conditions shock waves emanate from the trailing edge. One branch of the shock wave propagates downstream, but the other branch reflects off the suction surface of the adjacent blade. The configuration of these shock waves is shown in Figure 3.31 using a Schlieren photograph of the flow in a transonic turbine cascade at a downstream Mach number, M2 5 1.15.
The back pressure of a turbine cascade can be lowered until the axial velocity component of the exit flow is equal to the sonic speed. This condition is called the limit load and it is the point where


