Phase Diagrams with Azeotropes
Next, we study phase diagrams for non-ideal mixtures, based on Raoult’s law (22.29). To obtain interesting behavior, it suffices to consider non-ideality in the liquid phase, expressed through activity coefficients of the form (22.33), while the vapor is considered as a mixture of ideal gases where the fugacity coefficients are unity.
For a binary mixture, we obtain the two equations (with X2 = 1 − X1),
Note that, as indicated, the left hand sides are just the partial pressures in the vapor, expressed through the right hand sides as functions of temperature and liquid composition.
The saturated vapor curve p (T, X //) cannot be computed analytically,since it is not possible to analytically eliminate X/ from the equations. Instead, we obtain it as follows: Division of the two equations for gives
With this, the saturated vapor curve can be expressed in parametric form as
with X / as curve parameter.4
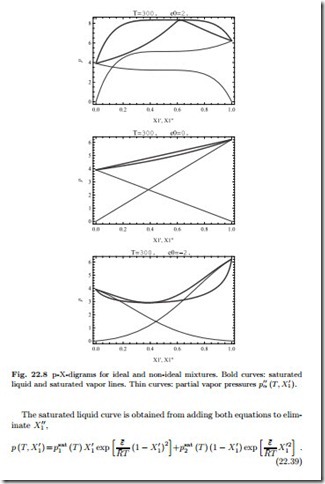
Figure 22.8 shows the phase diagrams together with the vapor pressures α (T, X1) = Xα p for various values of ¯ε, based on data given in problem 22.25. For non-ideal mixtures, the saturated liquid and vapor lines meet not only for the pure substances (X1 = 1 or X1 = 0), but also in a point between, the so-called azeotrope.
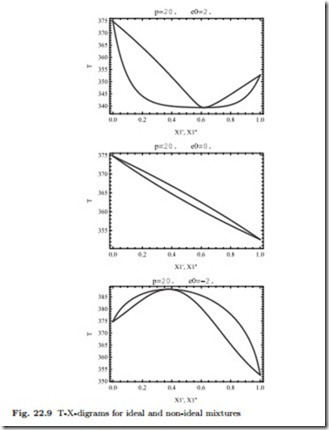
The corresponding T-X-diagrams at constant p, which are of importance to understand distillation processes, can be constructed as follows: For the saturated liquid line one prescribes (X/ , p) in (22.39) and solves numerically for T to find one point (X/ ,T ) of the saturated liquid curve T (p, X / ). The curve results from repetition for many values X/ . For the saturated vapor curve one evaluates (22.40) for values on the saturated liquid curve to com- pute X// (T (p, X / ) ,X / ) and then uses the saturated liquid line to find points on the saturated liquid lines as shows the resulting T-X-diagrams corresponding to the p-X-diagrams above, they show azeotropes as well.
As compared to the ideal mixture, when the formation of mixed pairs (1-2) is not favored, which is the case for ¯ε > 0, the mixture becomes more volatile, as can be seen from the larger vapor pressures in Fig. 22.8 and the lower saturation temperatures in Fig. 22.9. When the formation of mixed pairs is favored, ¯ε< 0, the mixture is less volatile, vapor pressures are lower, and saturation temperatures are higher.
Azeotropic mixtures cannot be separated by distillation processes, as becomes obvious when one considers the distillation column discussed earlier in conjunction with an azeotropic T-X-diagram. The location of the azeotrope might change with pressure, and separation can be achieved by distillation at different pressures (for the model used to generate these figures, this effect is very weak, however). Other methods for separation of azeotropic mixtures are discussed in the chemical engineering literature.


