Effect of reaction on efficiency
Consider the problem of selecting an axial turbine design for which the mean blade speed, U, the stage loading, ψ (or ΔW/U2), and the flow coefficient, φ (or cx/U), have already been selected. The only remaining parameter required to completely define the velocity triangles is R or the interstage swirl angle, α1, since from Eq. (4.14),
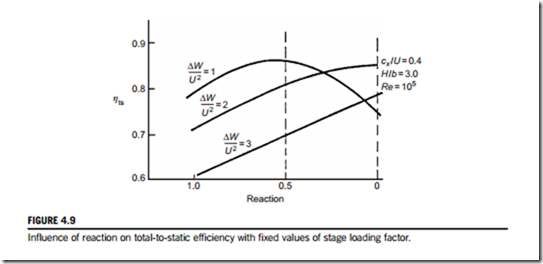
For different values of R the velocity triangles can be constructed, the loss coefficients deter- mined, and ηtt, ηts calculated. In Shapiro, Soderberg, Stenning, Taylor, and Horlock (1957), Stenning considered a family of turbines each having a flow coefficient cx/U 5 0.4, blade aspect ratio H/b 5 3, and Reynolds number Re 5 105, and calculated ηtt, ηts for stage loading factors ΔW/U2 of 1, 2, and 3 using Soderberg’s correlation. The results of this calculation are shown in Figure 4.9 as presented by Shapiro et al. (1957).
In the case of total-to-static efficiency, it is at once apparent that this is optimized, at a given blade loading, by a suitable choice of reaction. When ΔW/U2 5 2, the maximum value of ηts occurs with approximately zero reaction. With lighter blade loading, the optimum ηts is obtained with higher reaction ratios. When ΔW/U2 . 2, the highest value of ηts attainable without rotor relative flow diffusion occurring is obtained with R 5 0. Note that these results relate only to the 2D blading efficiency and make no allowance for losses due to tip clearance and endwall flow.
EXAMPLE 4.3
Verify that the peak value of the total-to-static efficiency ηts shown in Figure 4.9 occurs at a reaction of 50% for the curve marked ΔW/U2 5 1 and estimate its value using Soderberg’s correlation.
Solution
This value appears to be close to the peak value of the efficiency curve ΔW/U2 5 1.0 in Figure 4.9. Note that it is almost expected that the peak total-to-static efficiency would be at a reaction of 50% for a stage loading of 1, because this is where there is no interstage swirl, and thus for a fixed axial velocity, the exit kinetic energy will be minimized. If the total-to-total efficiency was considered, this would not be greatly affected by the choice of reaction. However,
the maximum value of ηtt is found, in general, to decrease slightly as the stage loading factor increases, see Section 4.12.
Diffusion within blade rows
Any diffusion of the flow through turbine blade rows is particularly undesirable and must, at the design stage, be avoided at all costs. This is because the adverse pressure gradient (arising from the flow diffusion), coupled with large amounts of fluid deflection (usual in turbine blade rows), makes boundary layer separation more than merely possible, with the result that large-scale losses arise. A compressor blade row, on the other hand, is designed to cause the fluid pressure to rise in
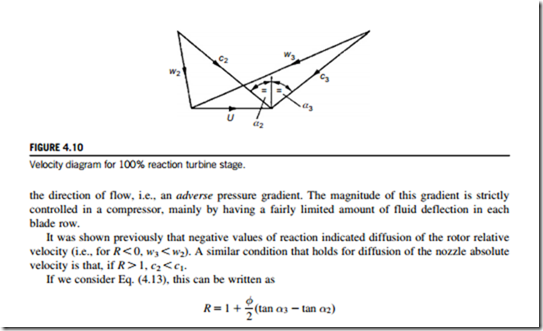
Thus, when α3 5 α2 the reaction is unity (also c2 5 c3). The velocity diagram for R 5 1 is shown in Figure 4.10 with the same values of cx, U, and ΔW used for R 5 0 and R 5 1=2. It will be apparent that if R exceeds unity, then c2 , c1 (i.e., nozzle flow diffusion).
EXAMPLE 4.4
A single-stage gas turbine operates at its design condition with an axial absolute flow at entry and exit from the stage. The absolute flow angle at nozzle exit is 70o. At stage entry, the total pressure and temperature are 311 kPa and 850oC, respectively. The exhaust static pressure is 100 kPa, the total-to-static efficiency is 0.87, and the mean blade speed is 500 m/s.
Assuming constant axial velocity through the stage, determine
1. the specific work done;
2. the Mach number leaving the nozzle;
3. the axial velocity;
4. the total-to-total efficiency;
5. the stage reaction.
Take Cp 5 1.148 kJ/(kg oC) and γ 5 1.33 for the gas.
Solution
1. From Eq. (4.19a), total-to-static efficiency is


