SYSTEM STABILITY:ROOT LOCUS

ROOT LOCUS

The root locus is one of the most powerful techniques used to analyse the stability of a closed- loop system. This technique is also used to design controllers with required time response characteristics. The root locus is a plot of the locus of the roots of the characteristic equation as the gain of the system is varied. The rules of the root locus for discrete-time systems are identical to those for continuous systems. This is because the roots of an equation Q(z) = 0 in the z-plane are the same as the roots of Q(s) = 0 in the s-plane. Even though the rules are the same, the interpretation of the root locus is quite different in the s-plane and the z-plane. For example, a continuous system is stable if the roots are in the left-hand s-plane. A discrete-time system, on the other hand, is stable if the roots are inside the unit circle. The construction and the rules of the root locus for continuous-time systems are described in many textbooks. In this section only the important rules for the construction of the discrete-time root locus are given, with worked examples.

Given the closed-loop system transfer function

System Stability-0084

we can write the characteristic equation as 1 + kF (z) = 0, and the root locus can then be plotted as k is varied. The rules for constructing the root locus can be summarized as follows:

1. The locus starts on the poles of F (z) and terminate on the zeros of F (z).

2. The root locus is symmetrical about the real axis.

3. The root locus includes all points on the real axis to the left of an odd number of poles and zeros.

4. If F (z) has zeros at infinity, the root locus will have asymptotes as k → ∞. The number of asymptotes is equal to the number of poles n p , minus the number of zeros nz . The angles of the asymptotes are given by

System Stability-0085

System Stability-0086

System Stability-0087

At this point one part of the locus moves towards the zero at z = −0.717 and the other moves towards the zero at −∞.

Figure 8.4 shows the root locus with the unit circle drawn on the same axis. The system will become marginally stable when the locus is on the unit circle. The value of k at these points can be found either from Jury’s test or by using the Routh–Hurwitz criterion.

Using Jury’s test, the characteristic equation is

System Stability-0088

Example 8.9

For Example 8.8, calculate the value of k for which the damping factor is ζ = 0.7.

Solution

In Figure 8.5 the root locus of the system is redrawn with the lines of constant damping factor and constant natural frequency.

From the figure, the roots when ζ = 0.7 are read as s1,2 = 0.61 ± j 0.25 (see Figure 8.6). The value of k can now be calculated as

System Stability-0089

System Stability-0090

System Stability-0091

which gives k = 0.12 and k = 2.08. The root locus of the system is shown in Figure 8.7. It is clear from this plot that the system is always stable since all poles are inside the unit circle for all values of k.

Lines of constant damping factor and constant angular frequency are plotted on the same axis in Figure 8.8.

Assuming that T = 1 s, ωn > 0.6 if the roots are on the left-hand side of the constant angular frequency line ωn = 0.2π/ T . The damping factor will be greater than 0.6 if the roots are below the constant damping ratio line ζ = 0.6. A point satisfying these properties has been chosen

System Stability-0092

System Stability-0093


SYSTEM STABILITY:ROUTH–HURWITZ CRITERION

ROUTH–HURWITZ CRITERION

The stability of a sampled data system can be analysed by transforming the system characteristic equation into the s-plane and then applying the well-known Routh–Hurwitz criterion.

A bilinear transformation is usually used to transform the left-hand s-plane into the interior of the unit circle in the z-plane. For this transformation, z is replaced by

System Stability-0080

The Routh–Hurwitz criterion states that the number of roots of the characteristic equation in the right hand s-plane is equal to the number of sign changes of the coefficients in the first column of the array. Thus, for a stable system all coefficients in the first column must have the same sign.

System Stability-0081

System Stability-0082

System Stability-0083


SAMPLED DATA SYSTEMS AND THE Z-TRANSFORM:PULSE TRANSFER FUNCTION AND MANIPULATION OF BLOCK DIAGRAMS

PULSE TRANSFER FUNCTION AND MANIPULATION OF BLOCK DIAGRAMS

The pulse transfer function is the ratio of the z-transform of the sampled output and the input at the sampling instants.

Suppose we wish to sample a system with output response given by

Sampled Data Systems and the z-Transform-0038Sampled Data Systems and the z-Transform-0039

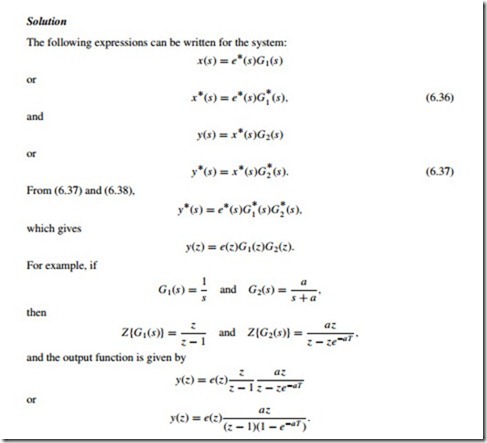
Equations (6.34) and (6.35) tell us that if at least one of the continuous functions has been sampled, then the z-transform of the product is equal to the product of the z-transforms of each function (note that [e*(s)]* = [e*(s)], since sampling an already sampled signal has no further effect). G(z) is the transfer function between the sampled input and the output at the sampling instants and is called the pulse transfer function. Notice from (6.35) that we have no information about the output y(z) between the sampling instants.

Open-Loop Systems

Some examples of manipulating open-loop block diagrams are given in this section.

Example 6.15

Figure 6.18 shows an open-loop sampled data system. Derive an expression for the z-transform of the output of the system.

Sampled Data Systems and the z-Transform-0040

Sampled Data Systems and the z-Transform-0041

Sampled Data Systems and the z-Transform-0042
Open-Loop Time Response

The open-loop time response of a sampled data system can be obtained by finding the inverse z-transform of the output function. Some examples are given below.

Example 6.18

A unit step signal is applied to the electrical RC system shown in Figure 6.21. Calculate and draw the output response of the system, assuming a sampling period of T = 1 s.

Solution

The transfer function of the RC system is

Sampled Data Systems and the z-Transform-0044

Sampled Data Systems and the z-Transform-0045

It is important to notice that the response is only known at the sampling instants. For example, in Figure 6.22 the capacitor discharges through the resistor between the sampling instants, and this causes an exponential decay in the response between the sampling intervals. But this behaviour between the sampling instants cannot be determined by the z-transform method of analysis.

Example 6.19

Assume that the system in Example 6.17 is used with a zero-order hold (see Figure 6.23). What will the system output response be if (i) a unit step input is applied, and (ii) if a unit ramp input is applied.

Sampled Data Systems and the z-Transform-0046Sampled Data Systems and the z-Transform-0047Sampled Data Systems and the z-Transform-0048

Example 6.20

The open-loop block diagram of a system with a zero-order hold is shown in Figure 6.26. Calculate and plot the system response when a step input is applied to the system, assuming that T = 1 s.

Sampled Data Systems and the z-Transform-0049Sampled Data Systems and the z-Transform-0050

Sampled Data Systems and the z-Transform-0051

Sampled Data Systems and the z-Transform-0052

Sampled Data Systems and the z-Transform-0053

Sampled Data Systems and the z-Transform-0054


SYSTEM STABILITY:JURY’S STABILITY TEST

JURY’S STABILITY TEST

Jury’s stability test is similar to the Routh–Hurwitz stability criterion used for continuous- time systems. Although Jury’s test can be applied to characteristic equations of any order, its complexity increases for high-order systems.

To describe Jury’s test, express the characteristic equation of a discrete-time system of order

System Stability-0076

The necessary and sufficient conditions for the characteristic equation (8.3) to have roots inside the unit circle are given as

System Stability-0077

• Check the three conditions given in (8.4) and stop if any of these conditions is not satisfied.

• Construct the array given in Table 8.1 and check the conditions given in (8.5). Stop if any condition is not satisfied.

Jury’s test can become complex as the order of the system increases. For systems of or- der 2 and 3 the test reduces to the following simple rules. Given the second-order system characteristic equation

System Stability-0078

System Stability-0079


SYSTEM STABILITY:FACTORIZING THE CHARACTERISTIC EQUATION

FACTORIZING THE CHARACTERISTIC EQUATION

The stability of a system can be determined if the characteristic equation can be factorized. This method has the disadvantage that it is not usually easy to factorize the characteristic equation. Also, this type of test can only tell us whether or not a system is stable as it is. It does not tell us about the margin of stability or how the stability is affected if the gain or some other parameter is changed in the system.

System Stability-0074

System Stability-0075


SYSTEM STABILITY

This chapter is concerned with the various techniques available for the analysis of the stability of discrete-time systems.

Suppose we have a closed-loop system transfer function

System Stability-0073

where 1 + GH(z) = 0 is also known as the characteristic equation. The stability of the system depends on the location of the poles of the closed-loop transfer function, or the roots of the characteristic equation D(z) = 0. It was shown in Chapter 7 that the left-hand side of the s-plane, where a continuous system is stable, maps into the interior of the unit circle in the z– plane. Thus, we can say that a system in the z-plane will be stable if all the roots of the characteristic equation, D(z) = 0, lie inside the unit circle.

There are several methods available to check for the stability of a discrete-time system:

• Factorize D(z) = 0 and find the positions of its roots, and hence the position of the closed- loop poles.

• Determine the system stability without finding the poles of the closed-loop system, such as Jury’s test.

• Transform the problem into the s-plane and analyse the system stability using the well- established s-plane techniques, such as frequency response analysis or the Routh–Hurwitz criterion.

• Use the root-locus graphical technique in the z-plane to determine the positions of the system poles.

The various techniques described in this section will be illustrated with examples.


SYSTEM TIME RESPONSE CHARACTERISTICS:DAMPING RATIO AND UNDAMPED NATURAL FREQUENCY USING FORMULAE

DAMPING RATIO AND UNDAMPED NATURAL FREQUENCY USING FORMULAE

In Section 7.4 above we saw how to find the damping ratio and the undamped natural frequency of a system using a graphical technique. Here, we will derive equations for calculating the damping ratio and the undamped natural frequency.

The damping ratio and the natural frequency of a system in the z-plane can be determined if we first of all consider a second-order system in the s-plane:

System Time Response Characteristics-0070

System Time Response Characteristics-0071

System Time Response Characteristics-0072


SYSTEM TIME RESPONSE CHARACTERISTICS:DAMPING RATIO AND UNDAMPED NATURAL FREQUENCY IN THE z-PLANE

DAMPING RATIO AND UNDAMPED NATURAL FREQUENCY IN THE z-PLANE
Damping Ratio

As shown in Figure 7.9(a), lines of constant damping ratio in the s-plane are lines where ζ = cos α for a given damping ratio. The locus in the z-plane can then be obtained by the substitution z = esT . Remembering that we are working in the third and fourth quadrants in

System Time Response Characteristics-0066

Undamped Natural Frequency

As shown in Figure 7.11, the locus of constant undamped natural frequency in the s-plane is a circle with radius ωn . From this figure, we can write

System Time Response Characteristics-0067

System Time Response Characteristics-0068System Time Response Characteristics-0069

The locus of constant ωn in the z-plane is given by (7.7) and is shown in Figure 7.10 as the vertical lines. Notice that the curves are given for values of ωn ranging from ωn = π/10T to ωn = π/ T .

Notice that the loci of constant damping ratio and the loci of undamped natural frequency are usually shown on the same graph.


SYSTEM TIME RESPONSE CHARACTERISTICS:MAPPING THE s-PLANE INTO THE z-PLANE

MAPPING THE s-PLANE INTO THE z-PLANE

The pole locations of a closed-loop continuous-time system in the s-plane determine the behaviour and stability of the system, and we can shape the response of a system by positioning its poles in the s-plane. It is desirable to do the same for the sampled data systems. This section describes the relationship between the s-plane and the z-plane and analyses the behaviour of a system when the closed-loop poles are placed in the z-plane.

First of all, consider the mapping of the left-hand side of the s-plane into the z-plane. Let s = σ + j ω describe a point in the s-plane. Then, along the j ω axis,

System Time Response Characteristics-0063

Hence, the pole locations on the imaginary axis in the s-plane are mapped onto the unit circle in the z-plane. As ω changes along the imaginary axis in the s-plane, the angle of the poles on the unit circle in the z-plane changes.

If ω is kept constant and σ is increased in the left-hand s-plane, the pole locations in the z-plane move towards the origin, away from the unit circle. Similarly, if σ is decreased in the left-hand s-plane, the pole locations in the z-plane move away from the origin in the z-plane. Hence, the entire left-hand s-plane is mapped into the interior of the unit circle in the z-plane. Similarly, the right-hand s-plane is mapped into the exterior of the unit circle in the z-plane. As far as the system stability is concerned, a sampled data system will be stable if the closed-loop poles (or the zeros of the characteristic equation) lie within the unit circle. Figure 7.5 shows the mapping of the left-hand s-plane into the z-plane.

As shown in Figure 7.6, lines of constant σ in the s-plane are mapped into circles in the z-plane with radius eσ T . If the line is on the left-hand side of the s-plane then the radius of the circle in the z-plane is less than 1. If on the other hand the line is on the right-hand side of the s-plane then the radius of the circle in the z-plane is greater than 1. Figure 7.7 shows the corresponding pole locations between the s-plane and the z-plane.

System Time Response Characteristics-0064

System Time Response Characteristics-0065

The time responses of a sampled data system based on its pole positions in the z-plane are shown in Figure 7.8. It is clear from this figure that the system is stable if all the closed-loop poles are within the unit circle.


SYSTEM TIME RESPONSE CHARACTERISTICS:TIME DOMAIN SPECIFICATIONS

TIME DOMAIN SPECIFICATIONS

The performance of a control system is usually measured in terms of its response to a step input. The step input is used because it is easy to generate and gives the system a nonzero steady-state condition, which can be measured.

Most commonly used time domain performance measures refer to a second-order system with the transfer function:

System Time Response Characteristics-0058

where ωn is the undamped natural frequency of the system and ζ is the damping ratio of the system.

When a second-order system is excited with a unit step input, the typical output response is as shown in Figure 7.3. Based on this figure, the following performance parameters are usually defined: maximum overshoot; peak time; rise time; settling time; and steady-state error.

The maximum overshoot, Mp , is the peak value of the response curve measured from unity. This parameter is usually quoted as a percentage. The amount of overshoot depends on the damping ratio and directly indicates the relative stability of the system.

The peak time, Tp , is defined as the time required for the response to reach the first peak of the overshoot. The system is more responsive when the peak time is smaller, but this gives rise to a higher overshoot.

The rise time, Tr , is the time required for the response to go from 0 % to 100 % of its final value. It is a measure of the responsiveness of a system, and smaller rise times make the system more responsive.

The settling time, Ts , is the time required for the response curve to reach and stay within a range about the final value. A value of 2–5 % is usually used in performance specifications.

The steady-state error, Ess , is the error between the system response and the reference input value (unity) when the system reaches its steady-state value. A small steady-tate error is a requirement in most control systems. In some control systems, such as position control, it is one of the requirements to have no steady-state error.

System Time Response Characteristics-0059

Having introduced the parameters, we are now in a position to give formulae for them (readers who are interested in the derivation of these formulae should refer to books on control theory). The maximum overshoot occurs at at peak time (t = Tp ) and is given by

System Time Response Characteristics-0060

i.e. overshoot is directly related to the system damping ratio – the lower the damping ratio, the higher the overshoot. Figure 7.4 shows the variation of the overshoot (expressed as a percentage) with the damping ratio.

The peak time is obtained by differentiating the output response with respect to time, letting this equal zero. It is given by

System Time Response Characteristics-0061

and the steady-state error when a unit step input is applied can be found from

System Time Response Characteristics-0062