LIQUID LEVEL DIGITAL CONTROL SYSTEM AND A CASE STUDY:THE SYSTEM SCHEMATIC

In this chapter we shall look at the design of a digital controller for a control system, namely a liquid level control system.

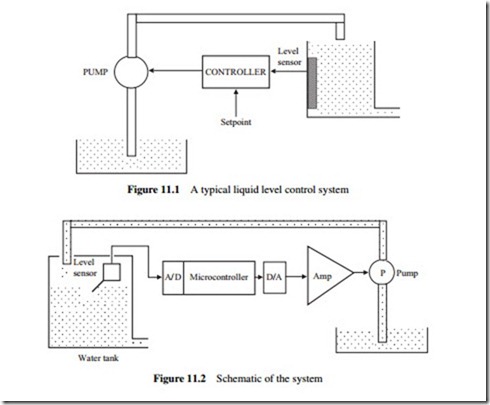
Liquid level control systems are commonly used in many process control applications to control, for example, the level of liquid in a tank. Figure 11.1 shows a typical liquid level control system. Liquid enters the tank using a pump, and after some processing within the tank the liquid leaves from the bottom of the tank. The requirement in this system is to control the rate of liquid delivered by the pump so that the level of liquid within the tank is at the desired point. In this chapter the system will be identified from a simple step response analysis. A constant voltage will be applied to the pump so that a constant rate of liquid can be pumped to the tank. The height of the liquid inside the tank will then be measured and plotted. A simple model of the system can then be derived from this response curve. After obtaining a model of the system, a suitable controller will be designed to control the level of the liquid inside the tank.

THE SYSTEM SCHEMATIC

The schematic of the liquid level control system used in this case study is shown in Figure 11.2. The system consists of a water tank, a water pump, a liquid level sensor, a microcontroller, a D/A converter and a power amplifier.

Water tank. This is the tank where the level of the liquid inside is to be controlled. Water is pumped to the tank from above and a level sensor measures the height of the water inside the tank. The microcontroller controls the pump so that the liquid is at the required level. The tank used in this case study is a plastic container with measurements 12 cm × 10 cm × 10 cm.

Water pump. The pump is a small 12 V water pump drawing about 3 A when operating at the full-scale voltage. Figure 11.3 shows the pump.

Level sensor. A rotary potentiometer type level sensor is used in this project. The sensor consists of a floating arm connected to the sliding arm of a rotary potentiometer. The level of the floating arm, and hence the resistance, changes as the liquid level inside the tank is changed. A voltage is applied across the potentiometer and the change of voltage is measured across the arm of the potentiometer. The resistance changes from 430Q when the floating arm is at the bottom (i.e. there is no liquid inside the tank) to 40 Q when the arm is at the top. The level sensor is shown in Figure 11.4.

Liquid Level Digital Control System a Case Study-0170

Microcontroller. A PIC16F877 type microcontroller is used in this project as the digital controller. In general, any other type of microcontroller with a built-in A/D converter can be used. The PIC16F877 incorporates an 8-channel, 10-bit A/D converter.

D/A converter. An 8-bit AD7302 type D/A converter is used in this project. In general, any other type of D/A converter can be used with similar specifications.

Power amplifier. The output power of the D/A converter is limited to a few hundred mil- liwatts, which is not enough to drive the pump. An LM675 type power amplifier is used to increase the power output of the D/A converter and drive the pump. The LM675 can provide around 30 W of power.


CONTROLLER REALIZATION:CHOICE OF SAMPLING INTERVAL

CHOICE OF SAMPLING INTERVAL

Whenever a digital control system is designed, a suitable sampling interval must be chosen. Choosing a large sampling time has destabilizing effects on the system. In addition, informa- tion loss occurs when large sampling times are selected. Also, the errors that occur when a continuous system is discretized increase as the sampling interval increases.

Controller Realization-0166Controller Realization-0167Controller Realization-0168

It may be thought that decreasing the sampling interval towards zero will make a discrete system converge towards an equivalent continuous system. However, in practice this is not the case since as the sampling interval is reduced, the change between the successive data values becomes less than the resolution of the system, leading to loss of information. In general, if a shorter sampling interval is to be used then the word length of the system should be increased so that the difference between adjacent samples can be resolved.

It has been found from practical applications in the process industry that a sampling interval of 1 s is generally short enough for most applications such as pressure control, temperature control and flow control. Systems with fast responses such as electromechanical systems (e.g. motors) require much shorter sampling intervals, usually of the order of milliseconds.

Various empirical rules have been suggested by many researchers for the selection of the sampling interval. These rules are based on practical experience and simulation results. Among them are the following

• If the plant has the dominant time constant Tp , then the sampling interval T for the closed- loop system should be selected such that T < Tp /10.

• Assuming that the process has a Ziegler–Nichols open-loop model

Controller Realization-0169

EXERCISES 267

• If the closed-loop system is required to have a settling time Tss or a natural frequency of ωn then choose the sampling interval T such that T < Tss /10 and ωs > 10ωn , where ωs is the sampling frequency, i.e. ωs = 2π/ T .


CONTROLLER REALIZATION:PID CONTROLLER IMPLEMENTATIONS

PID CONTROLLER IMPLEMENTATIONS

PID controllers are very important in many process control applications. In this section we shall look at the realization of this type of controller.

Controller Realization-0147

Controller Realization-0148

Controller Realization-0149

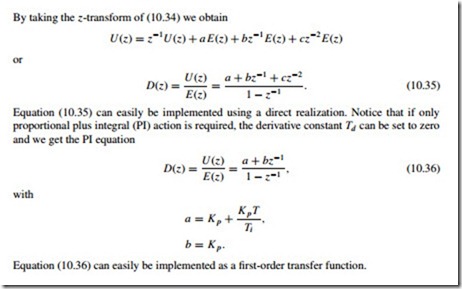
Equation (10.35) can easily be implemented using a direct realization. Notice that if only proportional plus integral (PI) action is required, the derivative constant Td can be set to zero and we get the PI equation

Controller Realization-0150


CONTROLLER REALIZATION:DIRECT STRUCTURE

A control algorithm which takes the form of a z-transform polynomial must be realized in the computer in the form of a program containing unit delays, constant multipliers, and adders.

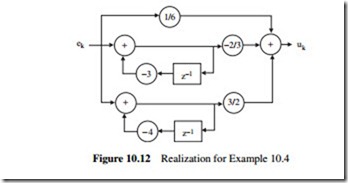
A given controller transfer function can be realized in many different ways. Mathematically the alternative realizations are all equivalent, differing only in the way they are implemented. Different realizations have different computational efficiencies, different sensitivities to pa- rameter errors, and different programming efforts are needed in each case. Only some of the important realizations, such as the direct structure, cascaded structure and parallel structure, as well as the second-order structures, are described in this chapter.

DIRECT STRUCTURE

The transfer function D(z) of a digital controller can be represented in general by a ratio of two polynomials

Controller Realization-0136

In direct structure the coefficients a j and b j appear as multipliers. There are several forms of direct structure, and we shall look at two of the most popular ones: the direct canonical structure and the direct noncanonical structure.

Direct Canonical Structure

Remembering that b0 = 1, we can rewrite (10.1) as

Controller Realization-0137

Controller Realization-0138

Controller Realization-0139

Controller Realization-0140

Draw the block diagram of the direct noncanonical realization of this controller.

Solution

With reference to (10.12) and Figure 10.3, we can draw the required block diagram as in Figure 10.4.


DISCRETE CONTROLLER DESIGN:PID CONTROLLER

PID CONTROLLER

The proportional–integral–derivative (PID) controller is often referred to as a ‘three-term’ controller. It is currently one of the most frequently used controllers in the process industry. In a PID controller the control variable is generated from a term proportional to the error, a term which is the integral of the error, and a term which is the derivative of the error.

Proportional: the error is multiplied by a gain K p . A very high gain may cause instability, and a very low gain may cause the system to drift away.

Integral: the integral of the error is taken and multiplied by a gain Ki . The gain can be adjusted to drive the error to zero in the required time. A too high gain may cause oscillations and a too low gain may result in a sluggish response.

Derivative: The derivative of the error is multiplied by a gain Kd . Again, if the gain is too high the system may oscillate and if the gain is too low the response may be sluggish.

Figure 9.23 shows the block diagram of the classical continuous-time PID controller. Tuning the controller involves adjusting the parameters K p , Kd and Ki in order to obtain a satisfactory

Discrete Controller Design-0127

Discrete Controller Design-0128

This form of the PID controller is known as the velocity PID controller. Here the current control action uses the previous control value as a reference. Because only a change in the control action is used, this form of the PID controller provides a smoother bumpless control when the error is small. If a large error exists, the response of the velocity PID controller may be slow, especially if the integral action time Ti is large.

The two forms of the PID algorithm, (9.18) and (9.20), may look quite different, but they are in fact similar to each other. Consider the positional controller (9.18). Shifting back one sampling interval, we obtain

Discrete Controller Design-0129

Saturation and Integral Wind-Up

In practical applications the output value of a control action is limited by physical constraints. For example, the maximum voltage output from a device is limited. Similarly, the maximum flow rate that a pump can supply is limited by the physical capacity of the pump. As a result of this physical limitation, the error signal does not return to zero and the integral term keeps adding up continuously. This effect is called integral wind-up (or integral saturation), and as a result of it long periods of overshoot can occur in the plant response. A simple example of what happens is the following. Suppose we wish to control the position of a motor and a large set- point change occurs, resulting in a large error signal. The controller will then try to reduce the error between the set-point and the output. The integral term will grow by summing the error signals at each sample and a large control action will be applied to the motor. But because of the physical limitation of the motor electronics the motor will not be able to respond linearly to the applied control signal. If the set-point now changes in the other direction, then the integral term is still large and will not respond immediately to the set-point request. Consequently, the system will have a poor response when it comes out of this condition.

The integral wind-up problem affects positional PID controllers. With velocity PID con- trollers, the error signals are not summed up and as a result integral wind-up will not occur, even though the control signal is physically constrained.

Many techniques have been developed to eliminate integral wind-up from the PID con- trollers, and some of the popular ones are as follows:

• Stop the integral summation when saturation occurs. This is also called conditional integra- tion. The idea is to set the integrator input to zero if the controller output is saturated and the input and output are of the same sign.

• Fix the limits of the integral term between a minimum and a maximum.

• Reduce the integrator input by some constant if the controller output is saturated. Usually the integral value is decreased by an amount proportional to the difference between the unsaturated and saturated (i.e maximum) controller output.

• Use the velocity form of the PID controller.

Derivative Kick

Another possible problem when using PID controllers is caused by the derivative action of the controller. This may happen when the set-point changes sharply, causing the error signal to change suddenly. Under such a condition, the derivative term can give the output a kick, known as a derivative kick. This is usually avoided in practice by moving the derivative term to the feedback loop. The proportional term may also cause a sudden kick in the output and it is common to move the proportional term to the feedback loop.

PID Tuning

When a PID controller is used in a system it is important to tune the controller to give the required response. Tuning a PID controller involves selecting values for the controller param- eters K p , Ti and Td . There are many techniques for tuning a controller, ranging from the first techniques described by J.G. Ziegler and N.B. Nichols (known as the Ziegler–Nichols tuning algorithm) in 1942 and 1943, to recent auto-tuning controllers. In this section we shall look at the tuning of PID controllers using the Ziegler–Nichols tuning algorithm.

Ziegler and Nichols suggested values for the PID parameters of a plant based on open-loop or closed-loop tests of the plant. According to Ziegler and Nichols, the open-loop transfer function of a system can be approximated with a time delay and a single-order system, i.e.

Discrete Controller Design-0130

where TD is the system time delay (i.e. transportation delay), and T1 is the time constant of the system.

Open-Loop Tuning

For open-loop tuning, we first find the plant parameters by applying a step input to the open- loop system. The plant parameters K , TD and T1 are then found from the result of the step test as shown in Figure 9.24.

Ziegler and Nichols then suggest using the PID controller settings given in Table 9.1 when the loop is closed. These parameters are based on the concept of minimizing the integral of the absolute error after applying a step change to the set-point.

Discrete Controller Design-0131

Discrete Controller Design-0132
Example 9.7

The open-loop unit step response of a thermal system is shown in Figure 9.25. Obtain the transfer function of this system and use the Ziegler–Nichols tuning algorithm to design (a) a proportional controller, (b) to design a proportional plus integral (PI) controller, and (c) to design a PID controller. Draw the block diagram of the system in each case.

Solution

From Figure 9.25, the system parameters are obtained as K = 40◦C, TD = 5s and T1 = 20 s, and the transfer function of the plant is

Discrete Controller Design-0133

Discrete Controller Design-0134

Discrete Controller Design-0135

Closed-Loop Tuning

The Ziegler–Nichols closed-loop tuning algorithm is based on plant closed-loop tests. The procedure is as follows:

• Disable any derivative and integral action in the controller and leave only the proportional action.

• Carry out a set-point step test and observe the system response.

• Repeat the set-point test with increased (or decreased) controller gain until a stable oscillation is achieved (see Figure 9.29). This gain is called the ultimate gain, Ku .

• Read the period of the steady oscillation and let this be Pu .

• Calculate the controller parameters according to the following formulae: K p = 0.45Ku , Ti = Pu /1.2 in the case of the PI controller; and K p = 0.6Ku , Ti = Pu /2, Td = Tu /8 in the case of the PID controller.
 

DISCRETE CONTROLLER DESIGN

The design of a digital control system begins with an accurate model of the process to be controlled. Then a control algorithm is developed that will give the required system response. The loop is closed by using a digital computer as the controller. The computer implements the control algorithm in order to achieve the required response.

Several methods can be used for the design of a digital controller:

• A system transfer function is modelled and obtained in the s-plane. The transfer function is then transformed into the z-plane and the controller is designed in the z-plane.

• System transfer function is modelled as a digital system and the controller is directly designed in the z-plane.

• The continuous system transfer function is transformed into the w-plane. A suitable controller is then designed in the w-plane using the well-established time response (e.g. root locus) or frequency response (e.g. Bode diagram) techniques. The final design is transformed into the z-plane and the algorithm is implemented on the digital computer.

In this chapter we are mainly interested in the design of a digital controller using the first method, i.e. the controller is designed directly in the z-plane.

The procedure for designing the controller in the z-plane can be outlined as follows:

• Derive the transfer function of the system either by using a mathematical approach or by performing a frequency or a time response analysis.

• Transform the system transfer function into the z-plane.

• Design a suitable digital controller in the z-plane.

• Implement the controller algorithm on a digital computer.

A discrete-time system can be in many different forms, depending on the type of input and the type of sensor used. Figure 9.1 shows a discrete-time system where the reference input is an analog signal, and the process output is also an analog signal. Analog-to-digital converters are then used to convert these signals into digital form so that they can be processed by a digital computer. A zero-order hold at the output of the digital controller approximates a D/A converter which produces an analog signal to drive the plant.

In Figure 9.2 the reference input is a digital signal, which is usually set using a keyboard or can be hard-coded into the controller algorithm. The feedback signal is also digital and the

Discrete Controller Design-0105

error signal is formed by the computer after subtracting the feedback signal from the reference input. The digital controller then implements the control algorithm and derives the plant.


SYSTEM STABILITY:BODE DIAGRAMS

BODE DIAGRAMS

The Bode diagrams used in the analysis of continuous-time systems are not very practical when used directly in the z-plane. This is because of the e j ωT term present in the sampled data system transfer functions when the frequency response is to be obtained. However, it is possible to draw the Bode diagrams of sampled data systems by transforming the system into the w-plane by making the substitution

System Stability-0100

System Stability-0101

where ws is the sampling frequency in radians per second. The interpretation of this is that the wt-plane and the s-plane frequencies will be approximately equal when the frequency is less than one-tenth of the sampling frequency.

We can use the transformations given in (8.10) and (8.11) to transform a sampled data system into the wt-plane and then use the standard continuous system Bode diagram analysis.

Some example Bode plots for sampled data systems are given below.

Example 8.13

Consider the closed-loop sampled data system given in Figure 8.11. Draw the Bode diagram and determine the stability of this system. Assume that T = 0.1 s.

System Stability-0102

System Stability-0103System Stability-0104


SYSTEM STABILITY:NYQUIST CRITERION

NYQUIST CRITERION

clip_image001The Nyquist criterion is one of the widely used stability analysis techniques in the s-plane, based on the frequency response of the system. To determine the frequency response of a continuous system transfer function G(s), we replace s by j ω and use the transfer function G( j ω). In the s-plane, the Nyquist criterion is based on the plot of the magnitude |GH ( j ω)| against the angle I GH ( j ω) as ω is varied.

clip_image002In a similar manner, the frequency response of a transfer function G(z) in the z-plane can be obtained by making the substitution z = e j ωT . The Nyquist plot in the z-plane can then be obtained by plotting the magnitude of |GH (z)|z=e j ωT against the angle I GH (z)|z=e j ωT as ω is varied. The criterion is then

System Stability-0094System Stability-0095

where N is the number of clockwise circles around the point −1, P the number of poles of GH(z) that are outside the unit circle, and Z the number of zeros of GH(z) that are outside the unit circle.

Fora stable system, Z must be equal to zero, and hence the number of anticlockwise circles around the point –1 must be equal to the number of poles of GH(z).

If GH(z)has no poles outside the unit circle then the criterion becomes simple and for stability the Nyquist plot must not encircle the point −1.

An example is given below.

System Stability-0096

System Stability-0097System Stability-0098

System Stability-0099