Activation Overpotential
The third main cause for overpotential in fuel cells is activation loss. This irreversible effect is related to finite reaction rates and activation barriers at the reaction sites. The following discussion is based in part on the ideas discussed in Sec. 24.
At interfaces between different substances one observes electric potentials, due to different charge distribution at the interface. Figure 26.7 shows schematically the electric double layers that result at the interfaces between catalyst layers and electrolyte at anode and cathode in a fuel cell. For the sake of simplicity, the electrolyte at the interface is assumed to be electrically neutral.
The upper part of the figure shows anode and cathode potentials at open circuit, denoted as Va,0 and Vc,0, with respect to an arbitrary reference, chosen such that the anode potential is negative and the cathode potential is positive. The overall cell potential at open circuit is V0 = Vc,0 − Va,0.
The lower part of the figure sketches the conditions at closed circuit: a current flows and negative charges are removed from the anode, which be- comes less negative, Va − Va,0 > 0. On the other side, the additional electrons weaken the cathode potential, Vc − Vc,0 < 0.
Due to reactions, new electrons are produced constantly at the anode, and consumed at the cathode. When the current is low, the electrons withdrawn are replaced through reactions, and the resulting change in the potentials is small. When the current is large, at the anode electrons are not replaced fast enough by reactions, and at the cathodes electrons are not consumed fast enough, so that the absolute values of the potentials drop. Thus, the overall potential of the cell, V = Vc − Va, depends on the rate of reactions relative to the current drawn.
The activation overpotentials for anode and cathode are defined as
From the above discussion follows that the activation overpotential η should be small for small current, and large for large current. We proceed to find the relation between overpotential η and current I.
The anode and cathode potentials are related to the Gibbs free energies of reaction at anode and cathode as
By subtracting this from the entropy generation, and multiplying with T /I we find the anode overpotential as
The overpotential is larger the further the system is away from equilibrium. The activation barriers g¯f (Va,T ) and g¯b (Va,T ) depend on the current, and we proceed with their determination.
As a first step we note that the above equation (26.38) is satisfied by
for arbitrary coefficients βa. For interpretation we can say that the parameter βa distributes the overpotential ηa between the forward and the backward reactions. In principle, βa could be a complicated function of current, temperature and other parameters, but experimental measurements show that it is a constant.
Reaction rates and current are related as
![]() where rf and rb are the forward and backward reaction rates, respectively. From the results of Chapter 24 we can write the reaction rates as
where rf and rb are the forward and backward reaction rates, respectively. From the results of Chapter 24 we can write the reaction rates as
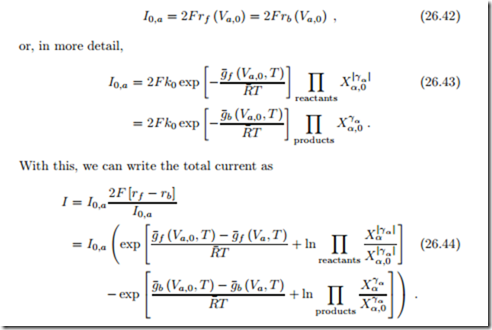
where k0 is a rate constant. We introduce the exchange current I0 as the current associated with the number of reactions taking place at open circuit in either direction; recall that forward and backward reaction rates are equal at open circuit. For the anode
The expressions in the exponentials are just those that occur in the 2nd law expression for the overpotential (26.38). Replacing them with (26.39) finally leads to the desired relation between current and overpotential, the Butler- Volmer equation (Max Volmer, 1885-1965; John Butler, 1899-1977):
Due to the sign conventions used here, the Butler-Volmer equation for the cathode is obtained simply by switching signs, as
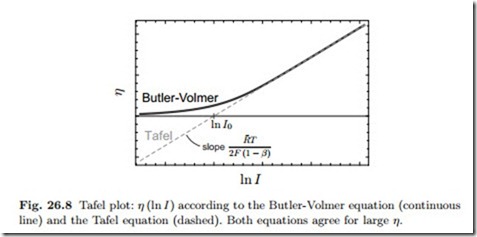
For large overpotentials the exponential with negative argument can be ignored against the exponential with positive argument; in this limit the Butler-Volmer equation reduces to the so-called Tafel equation (Julius Tafel, 1862-1918), e.g., for the anode,
Figure 26.8 shows the Butler-Volmer and the Tafel equation in a logarith- mic plot (Tafel plot ), that is overvoltage η as function of ln I. The curves are plotted for a constant value for the parameter β. Both curves coincide at larger η, where the approximation (26.47) is valid. The overpotential can be measured (not shown), and the resulting curve agrees with the prediction of the Butler-Volmer equation when β and I0 are adjusted properly. Indeed, β and I0 can be read of the experimental Tafel plot as slope and intercept as indicated in the figure.
According to the Butler-Volmer equation the activation overpotential will be smaller for large exchange currents I0. For an efficient fuel cell one must aim to make the exchange current large. According to (26.43), the exchange current depends on an activation energy and on temperature. It grows with temperature, so that activation losses are smaller for high temperature fuel cells. The activation barriers g¯f , g¯b depend strongly on the electrode material: good catalysts have low activation energies and thus low overpotential. For a hydrogen electrode at T0, the following data for the exchange current per unit area can be found in the literature:
The data indicates that expensive catalysts must be used at low tempera- tures. The most common catalyst for low temperature fuel cells is platinum. No catalysts are required for high temperature fuel cells. The total exchange current of a fuel cell is proportional to the surface of the catalyst layer, I0 = Iˆ0Acatalyst. To reach sufficient catalyst area, the catalyst must be distributed well within the catalyst layer, e.g., as extremely small spheres.
In hydrogen fuel cells, typically the reaction at the anode is considerably slower than the reaction at the cathode. Then, the activation overpotential at the cathode is small and can be ignored against the anode overpotential.
We end the discussion with a short look on the activation energies for forward and backward reactions, for which the reaction rates can be written as
These equations imply that the overpotential leads to a change in energy barriers and reaction rates. Figure 26.9 illustrates the influence of the over- potential on the energy landscape, similar to Fig. 24.2 and the discussion around it.


