Boltzmann Distribution & the Kinetic Model
Boltzmann Distribution
The kinetic model assumes that the point particles, of which the thermodynamic system is comprised, move around freely—i.e., without interacting— except when they collide with each other. These collisions are crucial, because they allow for a transfer of energy (and momentum) among the particles, which is necessary in order for the system to achieve equilibrium.
Even after the system has reached equilibrium, particle collisions continue to take place—giving rise to incessant changes in the individual particle states. Thus, over time, the position, (xi, yi, zi), and velocity, (vx,i, vy,i, vz,i ), of a given particle i, do not remain constant, but take on a range of values. Through time averaging (see Section 5.2), a probability distribution can be defined, representing the relative amount of time that the particle spends in any given state.
In most cases, all of the positions that lie within the system apparatus are accessible to any given particle, and equally probable (see Section 11.2). The situation is a bit more complicated for the velocity states, (vx,i, vy,i, vz,i ), however, because of energy conservation—whatever kinetic energy is gained by one particle in a single collision must be lost by its colliding partner. Particles with more kinetic energy are thus more likely to give up some of that energy in collisions. Accordingly, each particle spends less time in the higher-kinetic-energy states—as should be reflected in the equilibrium energy probability distribution.
In fact, this distribution is very well known; it was derived by Boltzmann long ago, using statistical mechanics.
Definition 6.1 For a system in thermal equilibrium, the relative amount of time spent in a molecular state with energy E is given by the Boltzmann distribution, denoted ‘f (E)’, which takes the following form:
. f (E) = exp(−E∕kT) [thermal equilibrium] (6.1)
The Boltzmann distribution as presented in Equation (6.1) is not normalized—meaning that a sum of f (E) over all molecular states does not equal one. Note that for a given T, there is indeed a decrease in probability with increasing E—a very sharp exponential decrease, in fact. Note also that for larger T, a greater effective range of E values—and therefore molecular states—is available. This aspect will be discussed further in Section 6.2.
Maxwell-Boltzmann Distribution
One of the nice features of Equation (6.1) is that it can be applied equally well to the molecular state of the whole system, or to the molecular state of a single particle (E → Ei ), or even to a single molecular coordinate [e.g., E → (m∕2)v2 ]. In the second (single-particle) context, it is clear that each individual particle i is described by the same probability distribution; in the third context, we learn that even individual velocity components, such as vx,i, are also all described by the same distribution.
The third context above—i.e., of individual velocity components—is particularly important; it gives rise to the Maxwell-Boltzmann distribution:
In Equation (6.2) above, the ‘x’ component is explicitly considered, and the ‘i’ subscript has been dropped for convenience—though it is under- stood that the distribution applies equally well to each velocity component of every particle. The distribution has also been normalized, so that ∫ (vx) dvx = 1.
For any molecular quantity that can be expressed in terms of vx, the statistical average is the integral of that quantity times (vx). For example, from Equation (6.2), we find that
implying that the mean particle velocity is zero, regardless of T. This does not mean that the individual particles are not moving—only that they are not moving in a statistically preferred direction.
The Maxwell-Boltzmann distribution also predicts that the most probable vx states are those clustered around vx = 0. Technically speaking, all vx values in the full range, −∞ < vx < +∞, are theoretically possible. In practice, however, the likelihood of observing a given vx value drops very sharply, as | | is increased beyond a certain point. As a consequence, the “effective” range of vx is finite. There is also a marked temperature dependence, with larger T values leading to broader vx ranges, as might be expected.
All of this can be seen clearly in Figure 6.1—a plot of the Maxwell-Boltzmann distribution, representing probability (or relative fraction of system particles) as a function of vx, for two different temperatures.
Figure 6.1 Maxwell-Boltzmann distribution. Maxwell-Boltzmann distribution for a single velocity component, vx, for a single particle (the vy and vz distributions are the same, as are those for all other system particles with the same mass). The two solid curves correspond to different values of the temperature, T . As T increases, the distributions become broader, thereby encompassing a greater effective range of available velocity states (represented by the dashed line segments).
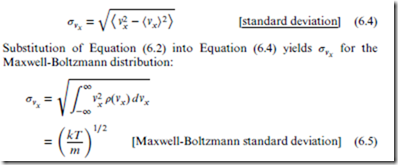
Statistical theory offers a very convenient quantitative measure of the effective range of a probability distribution, in the form of the standard deviation, denoted ‘’, and defined for vx as follows:
Equation 6.5 is important for understanding the entropy of the ideal gas (see Section 11.3).
Finally, from the Maxwell-Boltzmann distribution, the equipartition theorem may be easily derived. By inspection of Equation (6.5), we immediately see that integrating v2 (vx) to obtain ⟨ x⟩ yields Equation (5.6).
Maxwell Distribution of Speeds
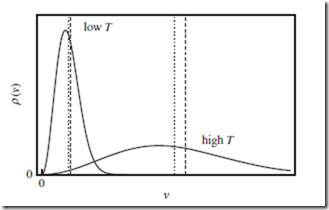
Our last distribution is the Maxwell distribution of speeds. This is obtained as follows. First, the three Maxwell-Boltzmann distributions for vx, vy, and vz, are combined together to form a single, single-particle, three dimensional distribution over the velocity vectors, (vx, vy, vz). Next, the velocity vectors are expressed in spherical coordinates as (v, , ), and the distribution is integrated over the two angular coordinates, (, ). This results in a probability distribution solely in terms of the speed, v, or mag- nitude of the velocity vector,
From Equations (6.7) and (6.8), we see that vrms is slightly larger than v . The most important conclusion, however, is that both speeds increase with temperature as T. The effective range (standard deviation) of the Maxwell distribution also increases with temperature.
All of these trends can be clearly seen in Figure 6.2.
In addition to the temperature trends discussed above, the mass trends are also important. You will notice that in every equation in Sections 6.2 and 6.3 where T appears, it does so as the ratio (T∕m). This means that the mass trends are exactly the opposite of the temperature trends. Thus, for a given temperature, heavy particles move more slowly than light particles (as discussed already in the marginal note on p. 39), and also have fewer velocity states available to them.
Figure 6.2 Maxwell distribution of speeds. Maxwell distribution of speeds v, for a single particle. This is obtained by integrating the three-dimensional Maxwell- Boltzmann distribution over the two angles. The two solid curves correspond to different values of the temperature, T . The mean speed, ⟨v⟩ (vertical dotted lines), is nonzero, and increases with T . The RMS speed, vrms = ⟨v2⟩1∕2 (vertical dashed lines), is larger than ⟨v⟩, but behaves similarly.
The Maxwell, Maxwell-Boltzmann, and Boltzmann distributions are all extremely important in their own right—the first two forming the basis of the kinetic theory of gases, and the last being the most important result in all of statistical mechanics! For our purposes, however, the most relevant result in this chapter is Equation (6.5)—which leads both to the equipartition theorem in Section 5.4, and to the ideal gas entropy in Section 11.3.


