Event Reporting
Event reporting is a standard feature in most microprocessor-based protective relays. The data and information saved in these reports are valuable for testing, measuring performance, analyzing problems, and identifying deficiencies before they cause future misoperations.
Event reports indicate whether the protective relay operated as expected. In addition, analysis identifies whether all associated components of the protection system were installed and operated correctly. Power system models, settings, wiring, auxiliary relays, circuit breakers, current and VTs, commu- nications equipment, the DC battery system, and connected loads can all be measured and monitored by analyzing event report data.
Every time the power system faults and relays capture data, you have readymade test reports. By analyzing actual relay and system performance, you can save money by extending or eliminating traditional routine tests.
When faults or other system events occur, protective relays record sampled analog currents and voltages, the status of optoisolated inputs and output contacts, the state of all relay elements and programmable logic, and the relay settings. The result is an event report, a stored record of what the relay saw and how it responded. With readily available information from product instruction manuals, the user is provided with all the necessary tools to determine if the response of the relay and the protection system was correct for the given system conditions.
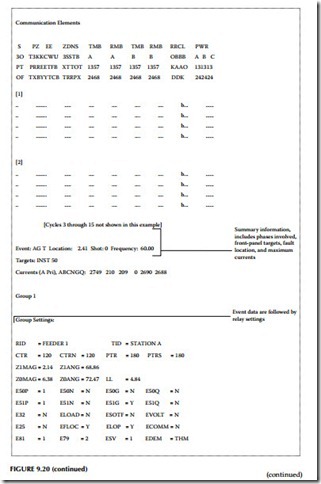
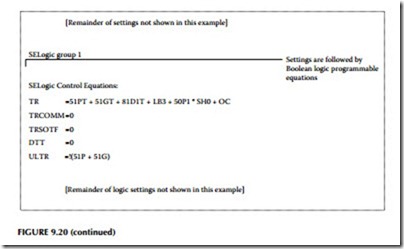
Event reports are formatted ASCII text files that are read vertically. Time increments as we read down the page, and data are displayed in columns. Each horizontal row represents a particular point in time. Figure 9.20 displays an example event report from a distribution relay.
The analog data in Figure 9.20 are reported every quarter-cycle or 90 electrical degrees. This makes it simple to take one sample, the oldest or pre- vious, as the y-component and the next sample, the newest or present, as the x-component of a phasor current or voltage. Modern relays, including the one that generated the event report in Figure 9.20, are capable of sampling much faster, as much as 16 to 64 samples per cycle, for better resolution and oscillography. However, the relays continue to offer the analyst a choice of display rates: 16 samples per cycle for generating detailed oscillography or four samples per cycle for quick visual analysis.
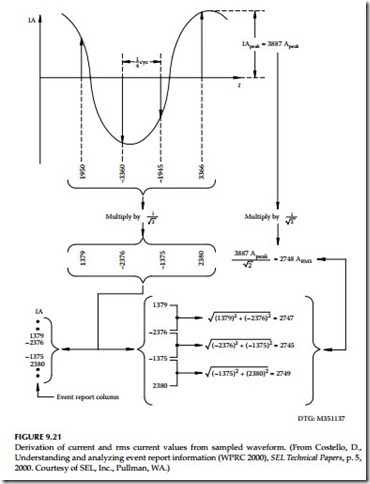
Figure 9.21 shows how the event report AC current column data relate to the actual sampled waveform and rms values. Note that any two rows of data, taken one quarter-cycle apart, can be used to calculate rms values. If an event report is displayed in a 16-sample per cycle format, every fourth row of data
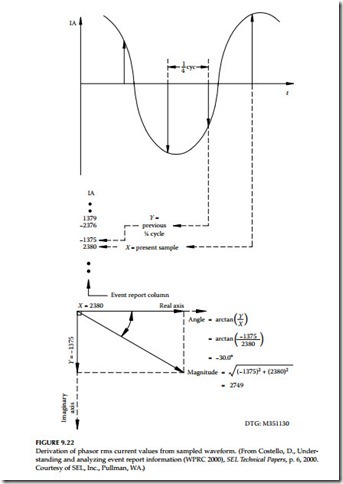
could be used to calculate rms values. Figure 9.22 shows how to convert the event report current column data to phasor rms values. Process voltages similarly.
Event report analysis can reveal problems with power system models, settings, breakers and auxiliary contacts, instrument transformers, and more. In the past, these problems would go undetected until they were either caught during routine maintenance or more serious consequences
occurred. It is a good practice to examine every event report to see if the operation was normal or exceptional.
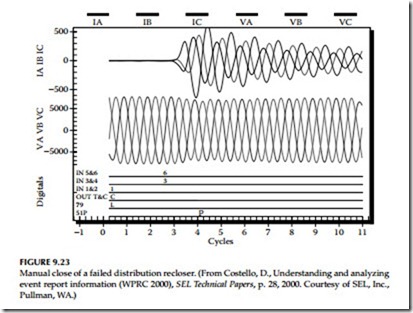
The Figure 9.23 shows a graphical plot of a typical event report. Analog and digital information can be analyzed using readily available software. The graphical plots are very useful for observing the actual waveforms and timing of the digital elements.
Event reports are useful in monitoring the following protection system components: protective relays, substation batteries, DC wiring, auxiliary tripping relays, circuit breakers, trip and close coils, breaker auxiliary con- tacts, CTs, AC wiring, VTs, communications equipment, settings and logic, power system models, and more.
