Adiabatic Saturation and Wet-Bulb Temperature
When moist air of temperature T and humidity ratio ω < ωsat flows over a surface of water, some water will evaporate and the humidity of the air will increase. Evaporation requires the heat of evaporation hfg , which is drawn from the air and the liquid, which therefore cool down as liquid evaporates. If there is sufficient contact between air and water, water will evaporate until the air will finally be saturated.
This effect is an important part of our life: When the body gets hot, humans sweat, the sweat evaporates by drawing the heat of vaporization from the body. The dryer the surrounding air is, the more vapor it can accept, and thus cooling by sweating is more efficient in dry climates. In moist climates, e.g., in tropical rainforests, the air can only accept little or no additional vapor, the sweat cannot evaporate, and no cooling is achieved. In dry climates, patios are cooled by spraying a fine mist of water. The small droplets evaporate immediately in the dry air, and this cools the air. Mothers blow air over their babies’ food to cool it, good restaurants serve the meals under covers, so that the food is only in contact with the saturated moist air under the cover, and remains hot.
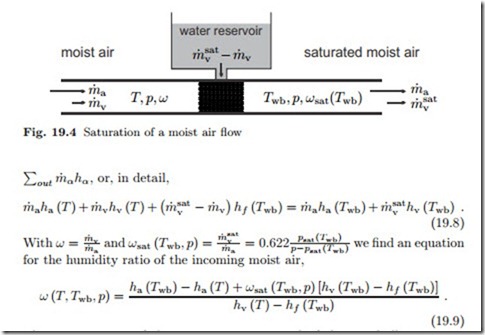
We study the system depicted in Fig. 19.4. Moist air at (T, p, ω) flows through a wetted porous material, which provides a large contact surface between air and liquid water. Pressure losses in the flow through the porous material are ignored in the following. The air leaves in saturated state at the so-called wet-bulb temperature Twb. We assume a steady state process under adiabatic conditions, that is no heat is added to the air flow from the exterior, and we assume that the make-up water flow from the reservoir is at the wet-bulb temperature Twb. The first law for the system then reduces to the equality between incoming and outgoing enthalpy flows, ),
The temperatures of the incoming air, T , and of the wet bulb, Twb, can be measured easily, and this measurement allows to determine the humidity ratio ω from the above equation.
Indeed, for the measurement of the wet-bulb temperature it is sufficient to cover a thermometer with a wet cloth, and expose it to air flow. After a while (before the cloth has dried, of course) a steady state is reached, and the thermometer shows the wet-bulb temperature of the air flow. For the measurement in standing air (e.g. in a room), the wet thermometer has to be moved, and one uses a sling psychrometer: two thermometers, one dry, one wet, on a handle are rotated in the air.
Psychrometric Chart
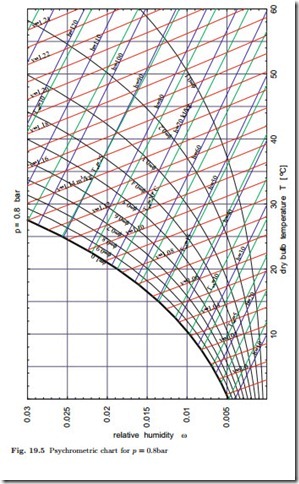
From (19.9) it is evident that determining humidity from the measurement of dry- and wet-bulb temperatures involves some work for finding property data. Instead of working with property tables it is practical to use a psychrometric chart, from which all interesting data for moist air can be extracted. Through the humidity ratio, the equations depend on the total pressure, p, and one should take care to use the proper chart. Small daily pressure changes at a location do not affect the results much, but one will have to account for changes of environmental pressure with height. Figure 19.5 shows a chart for p = 0.8 bar which would be appropriate for a location at a height of about 2000 m above sea level.
The psychrometric chart has the dry-bulb temperature T on the abscissa and the humidity ratio ω on the ordinate. The diagram shows lines of constant
relative humidity φ, constant wet-bulb temperature Twb, constant enthalpy h1+ω , and constant specific volume v1+ω . When two of these six quantities are known, all others can be easily read of the diagram. The chart will be used in subsequent sections.
The construction of the psychrometric chart is not difficult. For typical HVAC applications, vapor and dry air can be described as ideal gases with constant specific heats, and liquid water can be described as incompressible liquid with constant specific heat, so that
The psychrometric chart for p = 0.8 bar of Fig. 19.5 was obtained from the above equations. The chart exhibits lines of constant enthalpy (h1+ω = 10, 20…120 kJ ), constant relative humidity (φ = 0.1, 0.2, …, 1), constant wet- bulb temperature (Twb = 0, 2.5, 5, 7.5, …32.5 ◦C), and of constant specific volume (v1+ω = 0.99, 1.00, …, 1.24). Lines for enthalpy, volume and wet-bulb temperature have no meaning for φ > 1 and are not drawn. As can be seen from the equations above, the lines of constant wet-bulb temperature, constant enthalpy h1+ω and constant volume v1+ω are not straight. Their curvature is so small, however, that in the chart they appear to be straight lines. Also note that enthalpy and wet-bulb temperature lines are not parallel.
Differences in enthalpy values between diagrams obtained from the equations above and those commonly distributed could arise due to different reference states for enthalpies, while enthalpy differences will agree. Figure 19.6 shows a standard ASHRAE3 chart for p = 1.01325 bar; the process depicted in the chart will be discussed in the next section.
Related posts:
Incoming search terms:
- adiabatic saturation process
- in an adiabatic saturation process the quantity which remains constant is
- adiabatic saturation on psycometric chart
- adiabatic saturation in psychrometric process
- on psychrometric Chart the constant wet bulb lines conicide
- adiabatic saturation and wet bulb temperature equations
- adiabatic saturation
- constant wet bulb temperature line concide to constant enthalpy line are true or false
- adisbatic sauration
- enthalpy in psychrometric processes
- how the adiabatic saturator work
- According to the law of psychrometry the wet bulb temperature
- how to calculate adiabatic saturation temp from psycometric chart
- How to find adiabatic saturation temperature in psychrometrics chart
- in adiabatic saturation process which quantity remains constant
- psychrometry chart for adiabatic saturation process
- saturation temperature change during adiabatic saturation process?
- adiabatic saturator and sling psychrometer
- adiabatic saturation temperature psychrometric
- adiabatic saturation temperature
- adiabatic saturation humidity
- adiabatic saturation in psychometry
- adiabatic saturation in psychrometric chart
- adiabatic saturation is the process
- Adiabatic saturation lines coincide with wet bulb lines on psychrometer
- adiabatic saturation of air
- Adiabatic saturation on aiir cinditioning
- adiabatic saturation process for moist air involves
- adiabatic saturation process is also Known as
- adiabatic saturation process on pychrometric chart
- adiabatic saturation process with diagram
- what is the different between adiabatic saturation curve and wetbulb temperature in psychrometric chart


