Semiconductor Diodes

Types of Materials

Materials may be classified as conductors, semiconductors or insulators. The classification depends on the value of resistivity of the material. Good conductors are usually metals and have resistivities in the order of 10Ð7 to 10Ð8 Qm. Semiconductors have resistivities in the order of 10Ð3 to 3 ð 103 Qm. The resistivities of insulators are in the order of 104 to 1014 Qm. Some typical approximate values at normal room temperatures are:

image

In general, over a limited range of temperatures, the resistance of a conductor increases with temperature increase. The resistance of insulators remains approximately constant with variation of temperature. The resistance of semiconductor materials decreases as the temperature increases. For a specimen of each of these materials, having the same resistance (and thus completely different dimensions), at say, 15°C, the variation for a small increase in temperature to t°C is as shown in Figure 51.1.

Silicon and Germanium

The most important semiconductors used in the electronics industry are silicon and germanium. As the temperature of these materials is raised above room temperature, the resistivity is reduced and ultimately a point is reached where they effectively become conductors. For this reason, silicon should not operate at a working temperature in excess of 150°C to 200°C, depending on its purity, and germanium should not operate at a working temperature in excess of 75°C to 90°C, depending on its purity. As the temperature of a semiconductor is

image

reduced below normal room temperature, the resistivity increases until at very low temperatures the semiconductor becomes an insulator.

n-type and p-type Materials

Adding extremely small amounts of impurities to pure semiconductors in a controlled manner is called doping. Antimony, arsenic and phosphorus are called n-type impurities and form an n-type material when any of these impurities are added to silicon or germanium. The amount of impurity added usually varies from 1 part impurity in l05 parts semiconductor material to 1 part impurity to 108 parts semiconductor material, depending on the resistivity required. Indium, aluminium and boron are called p-type impurities and form a p-type material when any of these impurities are added to a semiconductor.

In semiconductor materials, there are very few charge carriers per unit volume free to conduct. This is because the ‘four electron structure’ in the outer shell of the atoms (called valency electrons), form strong covalent bonds with neighbouring atoms, resulting in a tetrahedral structure with the electrons held fairly rigidly in place. A two-dimensional diagram depicting this is shown for germanium in Figure 51.2.

image

image

Arsenic, antimony and phosphorus have five valency electrons and when a semiconductor is doped with one of these substances, some impurity atoms are incorporated in the tetrahedral structure. The ‘fifth’ valency electron is not rigidly bonded and is free to conduct, the impurity atom donating a charge carrier. A two-dimensional diagram depicting this is shown in Figure 51.3, in which a phosphorus atom has replaced one of the germanium atoms. The resulting material is called n-type material, and contains free electrons.

Indium, aluminium and boron have three valency electrons and when a semiconductor is doped with one of these substances impurity atoms replace some of the semiconductor atoms. One of the four bonds associated with the semiconductor material is deficient by one electron and this deficiency is called a hole.

Holes give rise to conduction when a potential difference exists across the semiconductor material due to movement of electrons from one hole to another, as shown in Figure 51.4. In this figure, an electron moves from A to B, giving the appearance that the hole moves from B to A. Then electron C moves to A, giving the appearance that the hole moves to C, and so on. The resulting material is p-type material containing holes.

The p-n Junction

A p-n junction is a piece of semiconductor material in which part of the material is p-type and part is n-type. In order to examine the charge situation, assume that separate blocks of p-type and n-type materials are pushed together. Also assume that a hole is a positive charge carrier and that an electron is a negative charge carrier.

At the junction, the donated electrons in the n-type material, called majority carriers, diffuse into the p-type material (diffusion is from an area of high density to an area of lower density) and the acceptor holes in the p-type material diffuse into the n-type material as shown by the arrows in Figure 51.5.

image

Because the n-type material has lost electrons, it acquires a positive potential with respect to the p-type material and thus tends to prevent further movement of electrons. The p-type material has gained electrons and becomes negatively charged with respect to the n-type material and hence tends to retain holes. Thus after a short while, the movement of electrons and holes stops due to the potential difference across the junction, called the contact potential. The area in the region of the junction becomes depleted of holes and electrons due to electron-hole recombinations, and is called a depletion layer, as shown in Figure 51.6.

Forward and Reverse Bias

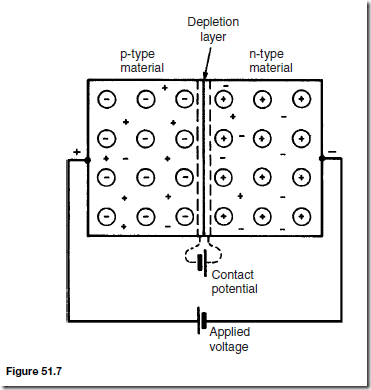
When an external voltage is applied to a p-n junction making the p-type material positive with respect to the n-type material, as shown in Figure 51.7, the p-n junction is forward biased. The applied voltage opposes the contact potential, and, in effect, closes the depletion layer. Holes and electrons can now cross the junction and a current flows.

An increase in the applied voltage above that required to narrow the depletion layer (about 0.2 V for germanium and 0.6 V for silicon), results in a rapid rise in the current flow. Graphs depicting the current-voltage relationship for forward biased p-n junctions, for both germanium and silicon, called the forward characteristics, are shown in Figure 51.8.

image

image

When an external voltage is applied to a p-n junction making the p- type material negative with respect to the n-type material as in shown in Figure 51.9, the p-n junction is reverse biased. The applied voltage is now in the same sense as the contact potential and opposes the movement of holes and electrons due to opening up the depletion layer. Thus, in theory, no current flows. However at normal room temperature certain electrons in the covalent bond lattice acquire sufficient energy from the heat available to leave the lattice, generating mobile electrons and holes. This process is called electron- hole generation by thermal excitation.

The electrons in the p-type material and holes in the n-type material caused by thermal excitation, are called minority carriers and these will be attracted by the applied voltage. Thus, in practice, a small current of a few microamperes for germanium and less than one microampere for silicon, at normal room temperature, flows under reverse bias conditions. Typical reverse characteristics are shown in Figure 51.10 for both germanium and silicon.

As the magnitude of the reverse voltage is increased a point will be reached where a large current suddenly starts to flow. The voltage at which this occurs is called the breakdown voltage. This current is due to two effects:

image

(i) the zener effect, resulting from the applied voltage being sufficient to break some of the covalent bonds, and

(ii) the avalanche effect, resulting from the charge carriers moving at sufficient speed to break covalent bonds by collision.

A zener diode is used for voltage reference purposes or for voltage stabilization. Two common circuit diagram symbols for a zener diode are shown in Figure 51.11.

Semiconductor Diodes

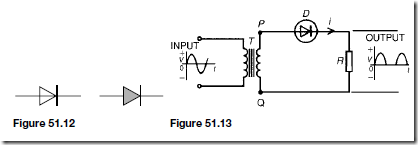
A semiconductor diode is a device having a p-n junction mounted in a con- tainer, suitable for conducting and dissipating the heat generated in operation and having connecting leads. Its operating characteristics are as shown in Figures 51.8 and 51.10. Two circuit diagram symbols for semiconductor diodes are in common use and are as shown in Figure 51.12. Sometimes the symbols are encircled as in Figure 51.13.

Rectification

The process of obtaining unidirectional currents and voltages from alternating currents and voltages is called rectification. Automatic switching in circuits is carried out by diodes.

Using a single diode, as shown in Figure 51.13, half-wave rectification is obtained. When P is sufficiently positive with respect to Q, diode D is switched on and current i flows. When P is negative with respect to Q, diode D is switched off. Transformer T isolates the equipment from direct connection with the mains supply and enables the mains voltage to be changed.

Two diodes may be used as shown in Figure 51.14 to obtain full wave rectification. A centre-tapped transformer T is used. When P is sufficiently positive with respect to Q, diode D1 conducts and current flows (shown by the broken line in Figure 51.14). When S is positive with respect to Q, diode D2 conducts and current flows (shown by the continuous line in Figure 51.14). The current flowing in R is in the same direction for both half cycles of the input. The output waveform is thus as shown in Figure 51.14.

Four diodes may be used in a bridge rectifier circuit, as shown in Figure 51.15 to obtain full wave rectification. As for the rectifier shown in

image

image

Figure 51.14, the current flowing in R is in the same direction for both half cycles of the input giving the output waveform shown.

To smooth the output of the rectifiers described above, capacitors having a large capacitance may be connected across the load resistor R. The effect of this is shown on the output in Figure 51.16.


Magnetically Coupled Circuits

Introduction

When the interaction between two loops of a circuit takes place through a magnetic field instead of through common elements, the loops are said to be inductively or magnetically coupled. The windings of a transformer, for example, are magnetically coupled (see Chapter 60).

Mutual Inductance

Mutual inductance is said to exist between two circuits when a changing current in one induces, by electromagnetic induction, an e.m.f. in the other. An ideal equivalent circuit of a mutual inductor is shown in Figure 49.1.

L1 and L2 are the self inductances of the two circuits and M the mutual inductance between them. The mutual inductance M is defined by the relationship:

image

where E2 is the e.m.f. in circuit 2 due to current I1 in circuit 1 and E1 is the e.m.f. in circuit 1 due to the current I2 in circuit 2.

The unit of M is the henry.

For example, two coils have a mutual inductance of 0.2 H; if the current in one coil is changed from 10 A to 4 A in 10 ms, the average induced e.m.f. in the second coil,

image

image

For example, A and B are two coils in close proximity. A has 1200 turns and B has 1000 turns. When a current of 0.8 A flows in coil A a flux of 100 µWb links with coil A and 75% of this flux links coil B. Then

image

Coupling Coefficient

The coupling coefficient k is the degree or fraction of magnetic coupling that flux linking two circuits image

When there is no magnetic coupling, k D 0. If the magnetic coupling is perfect, i.e. all the flux produced in the primary links with the secondary then k D 1. Coupling coefficient is used in communications engineering to denote the degree of coupling between two coils. If the coils are close together, most of the flux produced by current in one coil passes through the other, and the coils are termed tightly coupled. If the coils are spaced apart, only a part of the flux links with the second, and the coils are termed loosely coupled.

It may be shown that:

image

Coils Connected in Series

Figure 49.2 shows two coils 1 and 2 wound on an insulating core with termi- nals B and C joined. The fluxes in each coil produced by current i are in the same direction and the coils are termed cumulatively coupled.

Let the self inductance of coil 1 be L1 and that of coil 2 be L2 and let their mutual inductance be M.

If the winding between terminals A and D in Figure 49.2 are considered as a single circuit having a self inductance LA henrys then it may be shown that:

image

If terminals B and D are joined as shown in Figure 49.3 the direction of the current in coil 2 is reversed and the coils are termed differentially coupled.

If LB is the self inductance of the whole circuit between terminals A and C in Figure 49.3 then it may be shown that:

image

Thus the total inductance L of inductively coupled circuits is given by:

image

For example, two coils connected in series have self inductance of 40 mH and 10 mH respectively. The total inductance of the circuit is found to be 60 mH.

Then from equation (8),

image

An experimental method of determining the mutual inductance is indicated by equation (9), i.e. connect the coils both ways and determine the equivalent inductances LA and LB using an a.c. bridge. The mutual inductance is then given by a quarter of the difference between the two values of inductance.

Coupled Circuits

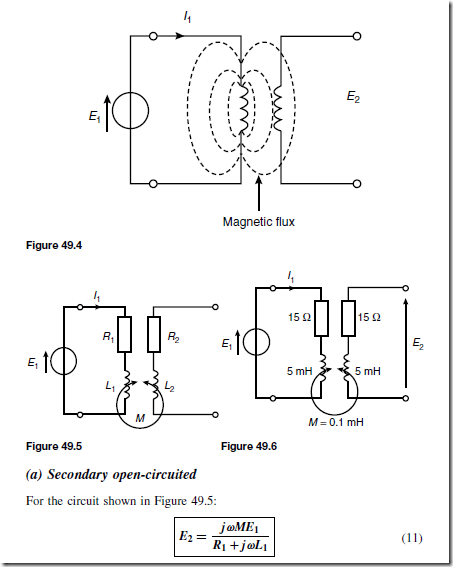
The magnitude of the secondary e.m.f. in Figure 49.4 is given by:

image

If L1 is the self inductance of the primary winding in Figure 49.4, there will be an e.m.f. generated equal to jωL1I1 induced into the primary winding since the flux set up by the primary current also links with the primary winding.

image

For example, for the circuit shown in Figure 49.6, the p.d. which appears across the open-circuited secondary winding, given that

E1 = 8 sin 2500t volts, is determined as follows:

Impedance of primary,

image

image

(b) Secondary terminals having load impedance

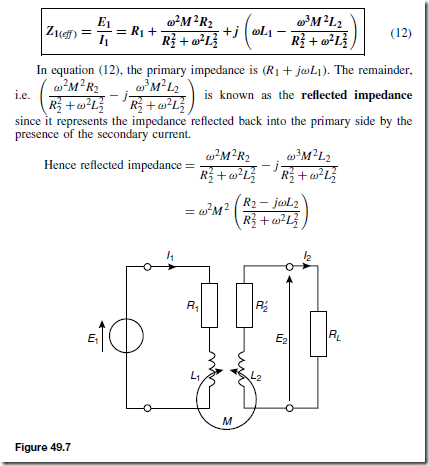
In the circuit shown in Figure 49.7 a load resistor RL is connected across the secondary terminals. Let

When an e.m.f. is induced into the secondary winding a current I2 flows and this will induce an e.m.f. into the primary winding.

The effective primary impedance Z1(eff ) of the circuit is given by:

image

image

image

(c) Resonance by tuning capacitors

Tuning capacitors may be added to the primary and/or secondary circuits to cause it to resonate at particular frequencies. These may be connected either in series or in parallel with the windings. Figure 49.9 shows each winding tuned by series-connected capacitors C1 and C2. The expression for the effective primary impedance, Z1(eff ) i.e. equation (12) applies except that ωL1 becomes

image

Dot Rule for Coupled Circuits

Applying Kirchhoff’s voltage law to each mesh of the circuit shown in Figure 49.10 gives:

image

In these equations the ‘M’ terms have been written as š because it is not possible to state whether the magnetomotive forces due to currents I1 and I2

image

are added or subtracted. To make this clearer a dot notation is used whereby the polarity of the induced e.m.f. due to mutual inductance is identified by placing a dot on the diagram adjacent to that end of each equivalent winding which bears the same relationship to the magnetic flux.

The dot rule determines the sign of the voltage of mutual inductance in the Kirchhoff’s law equations shown above, and states:

(i) when both currents enter, or both currents leave, a pair of coupled coils at the dotted terminals, the signs of the ‘M’ terms will be the same as the signs of the ‘L’ terms, or

(ii) when one current enters at a dotted terminal and one leaves by a dotted terminal, the signs of the ‘M’ terms are opposite to the signs of the ‘L’ terms

Thus Figure 49.11 shows two cases in which the signs of M and L are the same, and Figure 49.12 shows two cases where the signs of M and L are opposite. In Figure 49.10, therefore, if dots had been placed at the top end of coils L1 and L2 then the terms jωMI2 and jωMI1 in the Kirchhoff’s equations would be negative (since current directions are similar to Figure 49.12(a)).

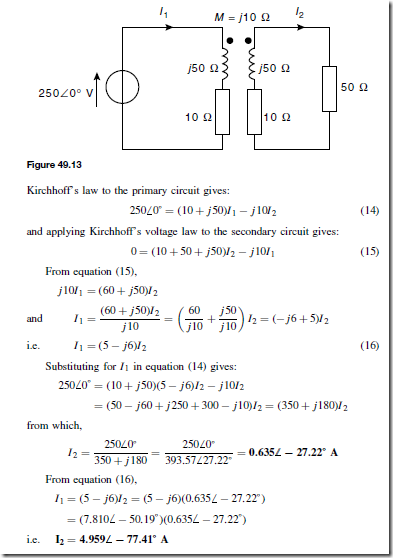
For example, for the coupled circuit shown in Figure 49.13, the values of currents I1 and I2 are determined as follows:

The position of the dots and the current directions correspond to Figure 49.12(a), and hence the signs of M and L terms are opposite. Applying

image

image


Electromagnetic Induction and Inductance

Introduction to Electromagnetic Induction

When a conductor is moved across a magnetic field so as to cut through the lines of force (or flux), an electromotive force (e.m.f.) is produced in the conductor. If the conductor forms part of a closed circuit then the e.m.f. produced causes an electric current to flow round the circuit. Hence, an e.m.f. (and thus current) is ‘induced’ in the conductor as a result of its movement across the magnetic field. This effect is known as ‘electromagnetic induction’.

Figure 48.1(a) shows a coil of wire connected to a centre-zero galvanometer, which is a sensitive ammeter with the zero-current position in the centre of the scale.

(a) When the magnet is moved at constant speed towards the coil (Figure 48.1(a)), a deflection is noted on the galvanometer showing that a current has been produced in the coil.

(b) When the magnet is moved at the same speed as in (a) but away from the coil the same deflection is noted but is in the opposite direction (see Figure 48.1(b)).

(c) When the magnet is held stationary, even within the coil, no deflection is recorded.

(d) When the coil is moved at the same speed as in (a) and the magnet held stationary the same galvanometer deflection is noted.

(e) When the relative speed is, say, doubled, the galvanometer deflection is doubled.

(f) When a stronger magnet is used, a greater galvanometer deflection is noted.

image

(g) When the number of turns of wire of the coil is increased, a greater galvanometer deflection is noted.

Figure 48.1(c) shows the magnetic field associated with the magnet. As the magnet is moved towards the coil, the magnetic flux of the magnet moves across, or cuts, the coil. It is the relative movement of the magnetic flux and the coil that causes an e.m.f. and thus current, to be induced in the coil. This effect is known as electromagnetic induction. The laws of electromagnetic induction evolved from experiments such as those described above.

Laws of Electromagnetic Induction

Faraday’s laws of electromagnetic induction state:

(i) An induced e.m.f. is set up whenever the magnetic field linking that circuit changes.

(ii) The magnitude of the induced e.m.f. in any circuit is proportional to the rate of change of the magnetic flux linking the circuit.

Lenz’s law states:

The direction of an induced e.m.f. is always such that it tends to set up a current opposing the motion or the change of flux responsible for inducing that e.m.f.

An alternative method to Lenz’s law of determining relative directions is given by Fleming’s Right-hand rule (often called the gene Rator rule) which states:

Let the thumb, first finger and second finger of the right hand be extended such that they are all at right angles to each other (as shown in Figure 48.2). If the first finger points in the direction of the magnetic field and the thumb points in the direction of motion of the conductor relative to the magnetic field, then the second finger will point in the direction of the induced e.m.f.

Summarising:

First finger — Field

ThuMb— Motion

SEcond finger — E.m.f.

In a generator, conductors forming an electric circuit are made to move through a magnetic field. By Faraday’s law, an e.m.f. is induced in the conductors, and thus a source of e.m.f. is created. A generator converts mechanical energy into electrical energy. (The action of a simple a.c. generator is described in Chapter 54).

The induced e.m.f. E set up between the ends of the conductor shown in Figure 48.3 is given by:

image

image

where B, the flux density, is measured in teslas, l, the length of conductor in the magnetic field, is measured in metres, and v, the conductor velocity, is measured in metres per second.

If the conductor moves at an angle e° to the magnetic field (instead of at 90° as assumed above) then:

image

For example, a conductor moves with a velocity of 15 m/s at an angle of 90° to a magnetic field produced between two square-faced poles of side length 2 cm. If the flux leaving a pole face is 5 µWb, the magnitude of the induced e.m.f., is given by:

image

If the conductor moves at an angle of, say, 30° then:

E30 D Blv sin 30° = E90 sin 30° = 3.75 sin 30° = 1.875 mV

Inductance

Inductance is the name given to the property of a circuit whereby there is an e.m.f. induced into the circuit by the change of flux linkages produced by a current change.

When the e.m.f. is induced in the same circuit as that in which the current is changing, the property is called self inductance, L

When the e.m.f. is induced in a circuit by a change of flux due to current changing in an adjacent circuit, the property is called mutual inductance, M (see chapter 49 following).The unit of inductance is the henry, H.

A circuit has an inductance of one henry when an e.m.f. of one volt is induced in it by a current changing at the rate of one ampere per second

Induced e.m.f. in a coil of N turns,

image

Inductors

A component called an inductor is used when the property of inductance is required in a circuit. The basic form of an inductor is simply a coil of wire.

Factors that affect the inductance of an inductor include:

(i) the number of turns of wire – the more turns the higher the inductance

(ii) the cross-sectional area of the coil of wire — the greater the cross-sectional area the higher the inductance

(iii) the presence of a magnetic core – when the coil is wound on an iron core the same current sets up a more concentrated magnetic field and the inductance is increased

 (iv) the way the turns are arranged– a short thick coil of wire has a higher inductance than a long thin one.

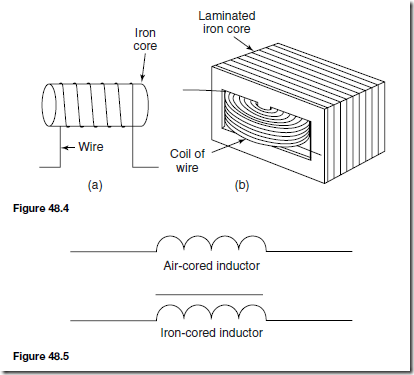
Two examples of practical inductors are shown in Figure 48.4, and the standard electrical circuit diagram symbols for air-cored and iron-cored inductors are shown in Figure 48.5.

An iron-cored inductor is often called a choke since, when used in a.c. circuits, it has a choking effect, limiting the current flowing through it.

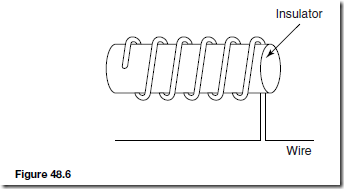
Inductance is often undesirable in a circuit. To reduce inductance to a minimum the wire may be bent back on itself, as shown in Figure 48.6, so that the magnetising effect of one conductor is neutralised by that of the adjacent conductor. The wire may be coiled around an insulator, as shown,

image

image

without increasing the inductance. Standard resistors may be non-inductively wound in this manner.

Energy Stored

An inductor possesses an ability to store energy. The energy stored, W, in the magnetic field of an inductor is given by:

image

For example, the energy is stored in the magnetic field of an 8 H inductor which has a current of 3 A flowing through it, is given by:

image


Electromagnetism

Magnetic Field due to an Electric Current

Magnetic fields can be set up not only by permanent magnets, as shown in chapter 45, but also by electric currents.

Let a piece of wire be arranged to pass vertically through a horizontal sheet of cardboard on which is placed some iron filings, as shown in Figure 47.1(a). If a current is now passed through the wire, then the iron filings will form a definite circular field pattern with the wire at the centre, when the cardboard is gently tapped. By placing a compass in different positions the lines of flux are seen to have a definite direction as shown in Figure 47.1(b). If the current direction is reversed, the direction of the lines of flux is also reversed. The effect on both the iron filings and the compass needle disappears when the current is switched off. The electric current thus produces the magnetic field. The magnetic flux produced has the same properties as the flux produced by a permanent magnet. If the current is increased the strength of the field increases and, as for the permanent magnet, the field strength decreases as we move away from the current-carrying conductor.

In Figure 47.1, the effect of only a small part of the magnetic field is shown. If the whole length of the conductor is similarly investigated it is found that the magnetic field round a straight conductor is in the form of concentric cylinders as shown in Figure 47.2, the field direction depending on the direction of the current flow.

When dealing with magnetic fields formed by electric current it is usual to portray the effect as shown in Figure 47.3. The convention adopted is:

(i) Current flowing away from the viewer, i.e. into the paper, is indicated by Ð. This may be thought of as the feathered end of the shaft of an arrow. See Figure 47.3(a)

image

image

(ii) Current flowing towards the viewer, i.e. out of the paper, is indicated by This may be thought of as the point of an arrow. See Figure 47.3(b).

The direction of the magnetic lines of flux is best remembered by the screw rule which states that:

If a normal right-hand thread screw is screwed along the conductor in the direction of the current, the direction of rotation of the screw is in the direction of the magnetic field.

For example, with current flowing away from the viewer (Figure 47.3(a)) a right-hand thread screw driven into the paper has to be rotated clockwise. Hence the direction of the magnetic field is clockwise.

A magnetic field set up by a long coil, or solenoid, is shown in Figure 47.4(a) and is seen to be similar to that of a bar magnet. If the solenoid is wound on an iron bar, as shown in Figure 47.4(b), an even stronger magnetic field is produced, the iron becoming magnetised and behaving like a permanent magnet. The direction of the magnetic field produced by the current I in the solenoid may be found by either of two methods, i.e. the screw rule or the grip rule.

image

(a) The screw rule states that if a normal right-hand thread screw is placed along the axis of the solenoid and is screwed in the direction of the current it moves in the direction of the magnetic field inside the solenoid. The direction of the magnetic field inside the solenoid is from south to north. Thus in Figures 47.4(a) and (b) the north pole is to the right.

(b) The grip rule states that if the coil is gripped with the right hand, with the fingers pointing in the direction of the current, then the thumb, outstretched parallel to the axis of the solenoid, points in the direction of the magnetic field inside the solenoid.

Electromagnets

The solenoid is very important in electromagnetic theory since the magnetic field inside the solenoid is practically uniform for a particular current, and is also versatile, in as much that a variation of the current can alter the strength of the magnetic field. An electromagnet, based on the solenoid, provides the basis of many items of electrical equipment, examples of which include electric bells, relays, lifting magnets and telephone receivers.

(i) Electric bell

There are various types of electric bell, including the single-stroke bell, the trembler bell, the buzzer and a continuously ringing bell, but all depend on the attraction exerted by an electromagnet on a soft iron armature. A typical single stroke bell circuit is shown in Figure 47.5. When the push button is operated a current passes through the coil. Since the iron-cored coil is energised the soft iron armature is attracted to the electromagnet. The armature also carries a striker that hits the gong. When the circuit is broken the coil becomes demagnetised and the spring steel strip pulls the armature back to its original position. The striker will only operate when the push is operated.

(ii) Relay

A relay is similar to an electric bell except that contacts are opened or closed by operation instead of a gong being struck. A typical simple relay is shown

image

in Figure 47.6, which consists of a coil wound on a soft iron core. When the coil is energised the hinged soft iron armature is attracted to the electromagnet and pushes against two fixed contacts so that they are connected together, thus closing some other electrical circuit.

(iii) Lifting magnet

Lifting magnets, incorporating large electromagnets, are used in iron and steel works for lifting scrap metal. A typical robust lifting magnet, capable of

image

exerting large attractive forces, is shown in the elevation and plan view of Figure 47.7 where a coil, C, is wound round a central core, P, of the iron casting. Over the face of the electromagnet is placed a protective non-magnetic sheet of material, R. The load, Q, which must be of magnetic material is lifted when the coils are energised, the magnetic flux paths, M, being shown by the broken lines.

(iv) Telephone receiver

Whereas a transmitter or microphone changes sound waves into correspond- ing electrical signals, a telephone receiver converts the electrical waves back into sound waves. A typical telephone receiver is shown in Figure 47.8 and consists of a permanent magnet with coils wound on its poles. A thin, flexible diaphragm of magnetic material is held in position near to the magnetic poles but not touching them. Variation in current from the transmitter varies the magnetic field and the diaphragm consequently vibrates. The vibration produces sound variations corresponding to those transmitted.

image

Force on a Current-carrying Conductor

If a current-carrying conductor is placed in a magnetic field produced by per- manent magnets, then the fields due to the current-carrying conductor and the permanent magnets interact and cause a force to be exerted on the conductor. The force on the current-carrying conductor in a magnetic field depends upon:

(a) the flux density of the field, B teslas

(b) the strength of the current, I amperes,

(c) the length of the conductor perpendicular to the magnetic field, l metres, and

(d) the directions of the field and the current.

When the magnetic field, the current and the conductor are mutually at right angles then:

Force F = BIl newtons

When the conductor and the field are at an angle g° to each other then:

Force F = Bil sin newtons

Since when the magnetic field, current and conductor are mutually at right angles, F D BIl, the magnetic flux density B may be defined by B D Il , i.e., the flux density is 1 T if the force exerted on 1 m of a conductor when the conductor carries a current of 1 A is 1 N.

For example, a conductor carries a current of 20 A and is at right angles to a magnetic field having a flux density of 0.9 T. If the length of the conductor in the field is 30 cm, the force acting on the conductor is given by:

F D BIl D ˛0.9)˛20)˛0.30) D 5.4 N when the conductor is at right angles to the field, as shown in Figure 47.9(a)

When the conductor is inclined at 30° to the field, as shown in Figure 47.9(b), then

image

Loudspeaker

A simple application of the above force is the moving coil loudspeaker. The loudspeaker is used to convert electrical signals into sound waves.

image

Figure 47.10 shows a typical loudspeaker having a magnetic circuit com- prising a permanent magnet and soft iron pole pieces so that a strong magnetic field is available in the short cylindrical air gap. A moving coil, called the voice or speech coil, is suspended from the end of a paper or plastic cone so that it lies in the gap. When an electric current flows through the coil it produces a force that tends to move the cone backwards and forwards according to the direction of the current. The cone acts as a piston, transferring this force to the air, and producing the required sound waves.

If the current-carrying conductor shown in Figure 47.3(a) is placed in the magnetic field shown in Figure 47.11(a), then the two fields interact and cause a force to be exerted on the conductor as shown in Figure 47.11(b). The field is strengthened above the conductor and weakened below, thus tending to move the conductor downwards. This is the basic principle of operation of the electric motor and the moving-coil instrument.

image

image

The direction of the force exerted on a conductor can be pre-determined by using Fleming’s left-hand rule (often called the motor rule) which states:

Let the thumb, first finger and second finger of the left hand be extended such that they are all at right angles to each other, (as shown in Figure 47.12). If the first finger points in the direction of the magnetic field, the second finger points in the direction of the current, then the thumb will point in the direction of the motion of the conductor.

Summarising:

image

Principle of Operation of a Simple d.c. Motor

A rectangular coil that is free to rotate about a fixed axis is shown placed inside a magnetic field produced by permanent magnets in Figure 47.13. A direct current is fed into the coil via carbon brushes bearing on a commutator, which consists of a metal ring split into two halves separated by insulation. When current flows in the coil a magnetic field is set up around the coil that interacts with the magnetic field produced by the magnets. This causes a force F to be exerted on the current-carrying conductor, which, by Fleming’s left- hand rule, is downward between points A and B and upward between C and D for the current direction shown. This causes a torque and the coil rotates anticlockwise. When the coil has turned through 90° from the position shown in Figure 47.13 the brushes connected to the positive and negative terminals

image

of the supply make contact with different halves of the commutator ring, thus reversing the direction of the current flow in the conductor. If the current is not reversed and the coil rotates past this position the forces acting on it change direction and it rotates in the opposite direction thus never making more than half a revolution. The current direction is reversed every time the coil swings through the vertical position and thus the coil rotates anti-clockwise for as long as the current flows. This is the principle of operation of a d.c. motor which is thus a device that takes in electrical energy and converts it into mechanical energy.

Principle of Operation of a Moving-coil Instrument

A moving-coil instrument operates on the motor principle. When a conductor carrying current is placed in a magnetic field, a force F is exerted on the conductor, given by F D BIl. If the flux density B is made constant (by using permanent magnets) and the conductor is a fixed length (say, a coil) then the force will depend only on the current flowing in the conductor.

In a moving-coil instrument a coil is placed centrally in the gap between shaped pole pieces as shown by the front elevation in Figure 47.14(a). (The air-gap is kept as small as possible, although for clarity it is shown exaggerated in Figure 47.14). Steel pivots, resting in jewel bearings, on a cylindrical iron core, support the coil. Current is led into and out of the coil by two phosphor bronze spiral hairsprings which are wound in opposite directions to minimise the effect of temperature change and to limit the coil swing (i.e. to control the

image

movement) and return the movement to zero position when no current flows. Current flowing in the coil produces forces as shown in Figure 47.14(b), the directions being obtained by Fleming’s left-hand rule. The two forces, FA and FB, produce a torque that will move the coil in a clockwise direction, i.e. move the pointer from left to right. Since force is proportional to current the scale is linear.

When the aluminium frame, on which the coil is wound, is rotated between the poles of the magnet, small currents (called eddy currents) are induced into the frame, and this provides automatically the necessary damping of the system due to the reluctance of the former to move within the magnetic field.

The moving-coil instrument will measure only direct current or voltage and the terminals are marked positive and negative to ensure that the current passes through the coil in the correct direction to deflect the pointer ‘up the scale’. The range of this sensitive instrument is extended by using shunts and multipliers (see Chapter 50)

Force on a Charge

When a charge of Q coulombs is moving at a velocity of v m/s in a magnetic field of flux density B teslas, the charge moving perpendicular to the field, then the magnitude of the force F exerted on the charge is given by:

image


Magnetic Materials

Magnetic Properties of Materials

The full theory of magnetism is one of the most complex of subjects. How- ever the phenomenon may be satisfactorily explained by the use of a simple model. Bohr and Rutherford, who discovered atomic structure, suggested that electrons move around the nucleus confined to a plane, like planets around the sun. An even better model is to consider each electron as having a surface, which may be spherical or elliptical or something more complicated.

Magnetic effects in materials are due to the electrons contained in them, the electrons giving rise to magnetism in the following two ways:

(i) by revolving around the nucleus

(ii) by their angular momentum about their own axis, called spin.

In each of these cases the charge of the electron can be thought of as moving round in a closed loop and therefore acting as a current loop.

The main measurable quantity of an atomic model is the magnetic moment. When applied to a loop of wire carrying a current,

magnetic moment = current x area of the loop

Electrons associated with atoms possess magnetic moment which gives rise to their magnetic properties.

Diamagnetism is a phenomenon exhibited by materials having a relative permeability less than unity. When electrons move more or less in a spherical orbit around the nucleus, the magnetic moment due to this orbital is zero, all the current due to moving electrons being considered as averaging to zero.

If the net magnetic moment of the electron spins were also zero then there would be no tendency for the electron motion to line up in the presence of a magnetic field. However, as a field is being turned on, the flux through the electron orbitals increases. Thus, considering the orbital as a circuit, there will be, by Faraday’s laws, an e.m.f. induced in it which will change the current in the circuit. The flux change will accelerate the electrons in its orbit, causing an induced magnetic moment. By Lenz’s law the flux due to the induced magnetic moment will be such as to oppose the applied flux. As a result, the net flux through the material becomes less than in a vacuum. Since

image

materials the relative permeability is less than one.

Paramagnetism is a phenomenon exhibited by materials where the relative permeability is greater than unity. Paramagnetism occurs in substances where atoms have a permanent magnetic moment. This may be caused by the orbitals not being spherical or by the spin of the electrons. Electron spins tend to pair up and cancel each other. However, there are many atoms with odd numbers of electrons, or in which pairing is incomplete. Such atoms have what is called a permanent dipole moment. When a field is applied to them they tend to line up with the field, like compass needles, and so strengthen the flux in that region. (Diamagnetic materials do not tend to line up with the field in this way.) When this effect is stronger than the diamagnetic effect, the overall effect is to make the relative permeability greater than one. Such materials are called paramagnetic.

Ferromagnetic materials

Ferromagnetism is the phenomenon exhibited by materials having a relative permeability which is considerably greater than 1 and which varies with flux density. Iron, cobalt and nickel are the only elements that are ferromagnetic at ordinary working temperatures, but there are several alloys containing one or more of these metals as constituents, with widely varying ferromagnetic properties.

Consider the simple model of a single iron atom represented in Figure 46.1. It consists of a small heavy central nucleus surrounded by a total of 26 electrons. Each electron has an orbital motion about the nucleus in a limited region, or shell, such shells being represented by circles K, L, M and N. The numbers in Figure 46.1 represent the number of electrons in each shell. The outer shell N contains two loosely held electrons, these electrons becoming the carriers of electric current, making iron electrically conductive. There are 14 electrons in the M shell and it is this group that is responsible for magnetism. An electron carries a negative charge and a charge in motion constitutes an electric current with which is associated a magnetic field. Magnetism would therefore result from the orbital motion of each electron in the atom. However, experimental evidence indicates that the resultant magnetic effect due to all the orbital motions in the metal solid is zero; thus the orbital currents may be disregarded.

In addition to the orbital motion, each electron spins on its own axis. A rotating charge is equivalent to a circular current and gives rise to a magnetic field. In any atom, all the axes about which the electrons spin are parallel, but rotation may be in either direction. In the single atom shown in Figure 46.1, in each of the K, L and N shells equal numbers of electrons spin in the clockwise and anticlockwise directions respectively and therefore these shells are magnetically neutral. However, in shell M, nine of the electrons spin in one direction while five spin in the opposite direction. There is therefore a resultant effect due to four electrons.

image

The atom of cobalt has 15 electrons in the M shell, nine spinning in one direction and six in the other. Thus with cobalt there is a resultant effect due to 3 electrons. A nickel atom has a resultant effect due to 2 electrons. The atoms of the paramagnetic elements, such as manganese, chromium or aluminium, also have a resultant effect for the same reasons as that of iron, cobalt and nickel. However, in the diamagnetic materials there is an exact equality between the clockwise and anticlockwise spins.

The total magnetic field of the resultant effect due to the four electrons in the iron atom is large enough to influence other atoms. Thus the orientation of one atom tends to spread through the material, with atoms acting together in groups instead of behaving independently. These groups of atoms, called domains (which tend to remain permanently magnetised), act as units. Thus, when a field is applied to a piece of iron, these domains as a whole tend to line up and large flux densities can be produced. This means that the relative permeability of such materials is much greater than one. As the applied field is increased, more and more domains align and the induced flux increases.

The overall magnetic properties of iron alloys and materials containing iron, such as ferrite (ferrite is a mixture of iron oxide together with other oxides — lodestone is a ferrite), depend upon the structure and composition of the material. However, the presence of iron ensures marked magnetic properties of some kind in them. Ferromagnetic effects decrease with temperature, as do those due to paramagnetism. The loss of ferromagnetism with temperature is more sudden, however; the temperature at which it has all disappeared is called the Curie temperature. The ferromagnetic properties reappear on cooling, but any magnetism will have disappeared. Thus a permanent mag- net will be demagnetised by heating above the Curie temperature (1040 K for iron) but can be remagnetised after cooling. Above the Curie temperature, ferromagnetics behave as paramagnetics.

Nonpermanent Magnetic Materials

General

Nonpermanent magnetic materials are those in which magnetism may be induced. With the magnetic circuits of electrical machines, transformers and heavy current apparatus a high value of flux density B is desirable so as to limit the cross-sectional area A ( D BA) and therefore the weight and cost

involved. At the same time the magnetic field strength H (=NI/I) should be as small as possible so as to limit the I2R losses in the exciting coils. The relative permeability image  and the saturation flux density should therefore be high. Also, when flux is continually varying, as in transformers, inductors and armature cores, low hysteresis and eddy current losses are essential.

Silicon-iron alloys

In the earliest electrical machines the magnetic circuit material used was iron with low content of carbon and other impurities. However, it was later

discovered that the deliberate addition of silicon to the iron brought about a great improvement in magnetic properties. The laminations now used in electrical machines and in transformers at supply frequencies are made of silicon-steel in which the silicon in different grades of the material varies in amounts from about 0.5% to 4.5% by weight. The silicon added to iron increases the resistivity. This in turn increases the resistance imageand thus helps to reduce eddy current loss. The hysteresis loss is also reduced; however, the silicon reduces the saturation flux density.

A limit to the amount of silicon which may be added in practice is set by the mechanical properties of the material, since the addition of silicon causes a material to become brittle. Also the brittleness of a silicon-iron alloy depends on temperature. About 4.5% silicon is found to be the upper practical limit for silicon-iron sheets. Lohys is a typical example of a silicon-iron alloy and is used for the armatures of d.c. machines and for the rotors and stators of a.c. machines. Stalloy, which has a higher proportion of silicon and lower losses, is used for transformer cores.

Silicon steel sheets are often produced by a hot-rolling process. In these finished materials the constituent crystals are not arranged in any particular manner with respect, for example, to the direction of rolling or the plane of the sheet. If silicon steel is reduced in thickness by rolling in the cold state and the material is then annealed it is possible to obtain a finished sheet in which the crystals are nearly all approximately parallel to one another. The material has strongly directional magnetic properties, the rolling direction being the direction of highest permeability. This direction is also the direction of lowest hysteresis loss. This type of material is particularly suitable for use in transformers, since the axis of the core can be made to correspond with the rolling direction of the sheet and thus full use is made of the high permeability, low loss direction of the sheet.

With silicon-iron alloys a maximum magnetic flux density of about 2 T is possible. With cold-rolled silicon steel, used for large machine construction, a maximum flux density of 2.5 T is possible, whereas the maximum obtainable with the hot-rolling process is about 1.8 T. (In fact, with any material, only under the most abnormal of conditions will the value of flux density exceed 3 T).

It should be noted that the term ‘iron-core’ implies that the core is made of iron; it is, in fact, almost certainly made from steel, pure iron being extremely hard to come by. Equally, an iron alloy is generally a steel and so it is preferred to describe a core as being a steel rather than an iron core.

Nickel-iron alloys

Nickel and iron are both ferromagnetic elements and when they are alloyed together in different proportions a series of useful magnetic alloys is obtained. With about 25% – 30% nickel content added to iron, the alloy tends to be very hard and almost nonmagnetic at room temperature. However, when the nickel content is increased to, say, 75% – 80% (together with small amounts of molybdenum and copper), very high values of initial and maximum permeabilities and very low values of hysteresis loss are obtainable if the alloys are given suitable heat treatment. For example, Permalloy, having a content of 78% nickel, 3% molybdenum and the remainder iron, has an initial permeability of 20 000 and a maximum permeability of 100 000 compared with values of 250 and 5000 respectively for iron. The maximum flux density for Permalloy is about 0.8 T. Mumetal (76% nickel, 5% copper and 2% chromium) has similar characteristics. Such materials are used for the cores of current and a.f. trans- formers, for magnetic amplifiers and also for magnetic screening. However, nickel-iron alloys are limited in that they have a low saturation value when compared with iron. Thus, in applications where it is necessary to work at a high flux density, nickel-iron alloys are inferior to both iron and silicon-iron. Also nickel-iron alloys tend to be more expensive than silicon-iron alloys.

Eddy current loss is proportional to the thickness of lamination squared, thus using laminations as thin as possible can reduce such losses. Nickel-iron alloy strip as thin as 0.004 mm, wound in a spiral, may be used.

Dust cores

In many circuits high permeability may be unnecessary or it may be more important to have a very high resistivity. Where this is so, metal powder or dust cores are widely used up to frequencies of 150 MHz. These consist of particles of nickel-iron-molybdenum for lower frequencies and iron for the higher frequencies. The particles, which are individually covered with an insulating film, are mixed with an insulating, resinous binder and pressed into shape.

Ferrites

Magnetite, or ferrous ferrite, is a compound of ferric oxide and ferrous oxide and possesses magnetic properties similar to those of iron. However, being a semiconductor, it has a very high resistivity. Manufactured ferrites are com- pounds of ferric oxide and an oxide of some other metal such as manganese, nickel or zinc. Ferrites are free from eddy current losses at all but the highest frequencies (i.e. >100 MHz) but have a much lower initial permeability com- pared with nickel-iron alloys or silicon-iron alloys. Ferrites have typically a maximum flux density of about 0.4 T. Ferrite cores are used in audio-frequency transformers and inductors.

Permanent Magnetic Materials

A permanent magnet is one in which the material used exhibits magnetism without the need for excitation by a current-carrying coil. The silicon-iron and nickel-iron alloys discussed earlier are ‘soft’ magnetic materials having high permeability and hence low hysteresis loss. The opposite characteristics are required in the ‘hard’ materials used to make permanent magnets. In permanent magnets, high remanent flux density and high coercive force, after magnetisation to saturation, are desirable in order to resist demagnetisation. The hysteresis loop should embrace the maximum possible area. Possibly the best criterion of the merit of a permanent magnet is its maximum energy prod- uct (BH)m , i.e. the maximum value of the product of the flux density B and the magnetic field strength H along the demagnetisation curve (shown as cd in Figure 45.4, page 249). A rough criterion is the product of coercive force and remanent flux density, i.e. (Od)(Oc) in Figure 45.4. The earliest materials used for permanent magnets were tungsten and chromium steel, followed by a series of cobalt steels, to give both a high remanent flux density and a high value of (BH)m Alni was the first of the aluminium-nickel-iron alloys to be discovered, and with the addition of cobalt, titanium and niobium, the Alnico series of magnets was developed, the properties of which vary according to composition. These materials are very hard and brittle. Many alloys with other compositions and trade names are commercially available.

A considerable advance was later made when it was found that directional magnetic properties could be induced in alloys of suitable composition if they were heated in a strong magnetic field. This discovery led to the powerful Alcomex and Hycomex series of magnets. By using special casting techniques to give a grain-oriented structure, even better properties are obtained if the field applied during heat treatment is parallel to the columnar crystals in the magnet. The values of coercivity, the remanent flux density and hence (BH)m are high for these alloys.

The most recent and most powerful permanent magnets discovered are made by powder metallurgy techniques and are based on an intermetallic compound of cobalt and samarium. These are very expensive and are only available in a limited range of small sizes.


Capacitors and Capacitance

Electrostatic Field

Figure 44.1 represents two parallel metal plates, A and B, charged to different potentials. If an electron that has a negative charge is placed between the plates, a force will act on the electron tending to push it away from the negative plate B towards the positive plate, A. Similarly, a positive charge would be acted on by a force tending to move it toward the negative plate. Any region such as that shown between the plates in Figure 44.1, in which an electric charge experiences a force, is called an electrostatic field. The direction of the field is defined as that of the force acting on a positive charge placed in the field. In Figure 44.1, the direction of the force is from the positive plate to the negative plate. Such a field may be represented in magnitude and direction by lines of electric force drawn between the charged surfaces. The closeness of the lines is an indication of the field strength. Whenever a p.d. is established between two points, an electric field will always exist.

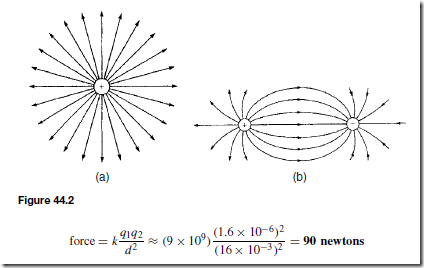
Figure 44.2(a) shows a typical field pattern for an isolated point charge, and Figure 44.2(b) shows the field pattern for adjacent charges of opposite polarity. Electric lines of force (often called electric flux lines) are continuous and start and finish on point charges; also, the lines cannot cross each other. When a charged body is placed close to an uncharged body, an induced charge of opposite sign appears on the surface of the uncharged body. This is because lines of force from the charged body terminate on its surface.

The concept of field lines or lines of force is used to illustrate the properties of an electric field. However, it should be remembered that they are only aids to the imagination.

The force of attraction or repulsion between two electrically charged bodies is proportional to the magnitude of their charges and inversely proportional to the square of the distance separating them,

image

This is known as Coulomb’s law.

Hence the force between two charged spheres in air with their centres 16 mm apart and each carrying a charge of C1.6 µC is given by:

image

image

Electric Field Strength

Figure 44.3 shows two parallel conducting plates separated from each other by air. They are connected to opposite terminals of a battery of voltage V volts. There is therefore an electric field in the space between the plates. If the plates are close together, the electric lines of force will be straight and parallel and equally spaced, except near the edge where fringing will occur (see Figure 44.1). Over the area in which there is negligible fringing,

image

where d is the distance between the plates. Electric field strength is also calledpotential gradient.

image

Capacitance

Static electric fields arise from electric charges, electric field lines beginning and ending on electric charges. Thus the presence of the field indicates the presence of equal positive and negative electric charges on the two plates of Figure 44.3. Let the charge be CQ coulombs on one plate and šQ coulombs on the other. The property of this pair of plates which determines how much charge corresponds to a given p.d. between the plates is called their :

image

The unit of capacitance is the farad F (or more usually f.LF D 10š6 F or pF D 10š12 F), which is defined as the capacitance when a p.d. of one volt appears across the plates when charged with one coulomb.

For example, the p.d. across a 4 µF capacitor when charged with 5 mC is determined as follows:

image

Capacitors

Every system of electrical conductors possesses capacitance. For example, there is capacitance between the conductors of overhead transmission lines and also between the wires of a telephone cable. In these examples the capacitance is undesirable but has to be accepted, minimised or compensated for. There are other situations where capacitance is a desirable property.

Devices specially constructed to possess capacitance are called capacitors (or condensers, as they used to be called). In its simplest form a capacitor consists of two plates that are separated by an insulating material known as a dielectric. A capacitor has the ability to store a quantity of static electricity.

The symbols for a fixed capacitor and a variable capacitor used in electrical circuit diagrams are shown in Figure 44.4 The charge Q stored in a capacitor is given by:

image

Electric Flux Density

Unit flux is defined as emanating from a positive charge of 1 coulomb. Thus electric flux is measured in coulombs, and for a charge of Q coulombs, the flux D Q coulombs.

Electric flux density D is the amount of flux passing through a defined area A that is perpendicular to the direction of the flux:

image

Permittivity

At any point in an electric field, the electric field strength E maintains the electric flux and produces a particular value of electric flux density D at that point. For a field established in vacuum (or for practical purposes in air), the

image

where εo is called the permittivity of free space or the free space constant. The value of εo is 8.85 × 10¹² F/m.

When an insulating medium, such as mica, paper, plastic or ceramic, is introduced into the region of an electric field the ratio of D/E is modified:

image

where εr , the relative permittivity of the insulating material, indicates its insulating power compared with that of vacuum:

image

The insulating medium separating charged surfaces is called a dielectric. Compared with conductors, dielectric materials have very high resistivities. They are therefore used to separate conductors at different potentials, such as capacitor plates or electric power lines.

For example, if two parallel plates having a p.d. of 200 V between them are spaced 0.8 mm apart, then

image

The Parallel Plate Capacitor

For a parallel-plate capacitor, as shown in Figure 44.5(a),

image

where εo D 8.85 x 10š12 F/m (constant), εr = relative permittivity, A = area of one of the plates, in m2, and d D thickness of dielectric in m.

Another method used to increase the capacitance is to interleave several plates as shown in Figure 44.5(b). Ten plates are shown, forming nine capacitors with a capacitance nine times that of one pair of plates.

If such an arrangement has n plates then capacitance C / (n – 1).

image

For example, a parallel plate capacitor has nineteen interleaved plates each 75 mm by 75 mm separated by mica sheets 0.2 mm thick. Assuming the relative permittivity of the mica is 5, the capacitance of the capacitor is

image

given by:

image

Capacitors Connected in Parallel and Series

(a) Capacitors connected in parallel

Figure 44.6 shows three capacitors, C1, C2 and C3, connected in parallel with a supply voltage V applied across the arrangement.

When the charging current I reaches point A it divides, some flowing

into C1 , some flowing into C2 and some into C3 . Hence the total charge QT(D I ð t) is divided between the three capacitors. The capacitors each store a charge and these are shown as Q1, Q2 and Q3 respectively.

image


For example, capacitance’s of 1 µF, 3 µF, 5 µF and 6 µF are connected in parallel to a direct voltage supply of 100 V.

The equivalent capacitance C = C1 + C2 + C3 + C4 = 1 + 3 + 5 + 6 = 15 µF

image

(b) Capacitors connected in series

Figure 44.7 shows three capacitors, C1, C2 and C3, connected in series across a supply voltage V. Let the p.d. across the individual capacitors be V1, V2 and V3 respectively as shown.

Let the charge on plate ‘a’ of capacitor C1 be CQ coulombs. This induces an equal but opposite charge of šQ coulombs on plate ‘b’. The conductor between plates ‘b’ and ‘c’ is electrically isolated from the rest of the circuit so that an equal but opposite charge of CQ coulombs must appear on plate ‘c’, which, in turn, induces an equal and opposite charge of šQ coulombs on plate ‘d’, and so on. Hence when capacitors are connected in series the charge on each is the same.

image

(Note that this formula is similar to that used for resistors connected in parallel).

For example, capacitance’s of 3 µF, 6 µF and 12 µF are connected in series across a 350 V supply. The circuit diagram is shown in Figure 44.8.

image

In practice, capacitors are rarely connected in series unless they are of the same capacitance. The reason for this can be seen from above where the lowest valued capacitor (i.e. 3 µF) has the highest p.d. across it (i.e. 200 V) which means that if all the capacitors have an identical construction they must all be rated at the highest voltage.

For the special case of two capacitors in series:

image

Dielectric Strength

The maximum amount of field strength that a dielectric can withstand is called the dielectric strength of the material.

image

Energy Stored in Capacitors

The energy, W, stored by a capacitor is given by:

image

Practical Types of Capacitor

Practical types of capacitor are characterised by the material used for their dielectric. The main types include: variable air, mica, paper, ceramic, plastic, titanium oxide and electrolytic.

1. Variable air capacitors. These usually consist of two sets of metal plates (such as aluminium), one fixed, the other variable. The set of moving plates rotate on a spindle as shown by the end view of Figure 44.9.

As the moving plates are rotated through half a revolution, the meshing, and therefore the capacitance, varies from a minimum to a maximum value. Variable air capacitors are used in radio and electronic circuits where very low losses are required, or where a variable capacitance is needed. The maximum value of such capacitors is between 500 pF and 1000 pF.

2. Mica capacitors. A typical older type construction is shown in Figure 44.10.

Usually the whole capacitor is impregnated with wax and placed in a bake- lite case. Mica is easily obtained in thin sheets and is a good insulator.

image

However, mica is expensive and is not used in capacitors above about 0.2 µF. A modified form of mica capacitor is the silvered mica type. The mica is coated on both sides with a thin layer of silver that forms the plates.

Capacitance is stable and less likely to change with age. Such capacitors have a constant capacitance with change of temperature, a high working voltage rating and a long service life and are used in high frequency circuits with fixed values of capacitance up to about 1000 pF.

3. Paper capacitors. A typical paper capacitor is shown in Figure 44.11 where the length of the roll corresponds to the capacitance required. The whole is usually impregnated with oil or wax to exclude moisture, and then placed in a plastic or aluminium container for protection. Paper capacitors are made in various working voltages up to about 150 kV and are used where loss is not very important. The maximum value of this type of capacitor is between 500 pF and 10 µF. Disadvantages of paper capacitors include variation in capacitance with temperature change and a shorter service life than most other types of capacitor.

4. Ceramic capacitors. These are made in various forms, each type of construction depending on the value of capacitance required. For high values, a tube of ceramic material is used as shown in the cross section of Figure 44.12. For smaller values the cup construction is used as shown in Figure 44.13, and for still smaller values the disc construction shown in Figure 44.14 is used. Certain ceramic materials have a very high permittivity and this enables capacitors of high capacitance to be made which are of small physical size with a high working voltage rating. Ceramic capacitors are available in the range 1 pF to 0.1 µF and may be used in high frequency electronic circuits subject to a wide range of temperatures.

image

5. Plastic capacitors. Some plastic materials such as polystyrene and Teflon can be used as dielectrics. Construction is similar to the paper capacitor but using a plastic film instead of paper. Plastic capacitors operate well under conditions of high temperature, provide a precise value of capacitance, a very long service life and high reliability.

6. Titanium oxide capacitors have a very high capacitance with a small physical size when used at a low temperature.

7. Electrolytic capacitors. Construction is similar to the paper capacitor with aluminium foil used for the plates and with a thick absorbent material, such as paper, impregnated with an electrolyte (ammonium borate), separating the plates. The finished capacitor is usually assembled in an aluminium container and hermetically sealed. Its operation depends on the formation of a thin aluminium oxide layer on the positive plate by electrolytic action when a suitable direct potential is maintained between the plates. This oxide layer is very thin and forms the dielectric. (The absorbent paper between the plates is a conductor and does not act as a dielectric.) Such capacitors must always be used on d.c. and must be connected with the correct polarity; if this is not done the capacitor will be destroyed since the oxide layer will be destroyed. Electrolytic capacitors are manufactured with working voltage from 6 V to 600 V, although accuracy is generally not very high. These capacitors possess a much larger capacitance than other types of capacitors of similar dimensions due to the oxide film being only a few microns thick.

The fact that they can be used only on d.c. supplies limit their usefulness.

Discharging Capacitors

When a capacitor has been disconnected from the supply it may still be charged and it may retain this charge for some considerable time. Thus precautions must be taken to ensure that the capacitor is automatically discharged after the supply is switched off. Connecting a high value resistor across the capacitor terminals does this.


Magnetic Circuits

Magnetic Fields

A permanent magnet is a piece of ferromagnetic material (such as iron, nickel or cobalt) that has properties of attracting other pieces of these materials. A permanent magnet will position itself in a north and south direction when freely suspended. The north-seeking end of the magnet is called the north pole, N, and the south-seeking end the south pole, S.

The area around a magnet is called the magnetic field and it is in this area that the effects of the magnetic force produced by the magnet can be detected. A magnetic field cannot be seen, felt, smelt or heard and therefore is difficult to represent. Michael Faraday suggested that the magnetic field could be represented pictorially, by imagining the field to consist of lines of magnetic flux, which enables investigation of the distribution and density of the field to be carried out.

The distribution of a magnetic field can be investigated by using some iron filings. A bar magnet is placed on a flat surface covered by, say, cardboard, upon which is sprinkled some iron filings. If the cardboard is gently tapped the filings will assume a pattern similar to that shown in Figure 45.1. If a number of magnets of different strength are used, it is found that the stronger the field the closer are the lines of magnetic flux and vice versa. Thus a magnetic field has the property of exerting a force, demonstrated in this case by causing the iron filings to move into the pattern shown. The strength of the magnetic field decreases as we move away from the magnet. It should be realised, of course, that the magnetic field is three dimensional in its effect, and not acting in one plane as appears to be the case in this experiment.

If a compass is placed in the magnetic field in various positions, the direction of the lines of flux may be determined by noting the direction of the compass pointer. The direction of a magnetic field at any point is taken as that in which the north-seeking pole of a compass needle points when suspended in the field. The direction of a line of flux is from the north pole to the south pole on the outside of the magnet and is then assumed to continue through the magnet back to the point at which it emerged at the north pole. Thus such lines of flux always form complete closed loops or paths, they never intersect and always have a definite direction.

image

image

The laws of magnetic attraction and repulsion can be demonstrated by using two bar magnets. In Figure 45.2(a), with unlike poles adjacent, attraction takes place. Lines of flux are imagined to contract and the magnets try to pull together. The magnetic field is strongest in between the two magnets, shown by the lines of flux being close together. In Figure 45.2(b), with similar poles adjacent (i.e. two north poles), repulsion occurs, i.e. the two north poles try to push each other apart, since magnetic flux lines running side by side in the same direction repel.

Magnetic Flux and Flux Density

Magnetic flux is the amount of magnetic field (or the number of lines of force) produced by a magnetic source. The symbol for magnetic flux is  (Greek letter ‘phi’). The unit of magnetic flux is the weber, Wb.

Magnetic flux density is the amount of flux passing through a defined area that is perpendicular to the direction of the flux:

image

Magnetomotive Force and Magnetic Field Strength

Magnetomotive force (m.m.f.) is the cause of the existence of a magnetic flux in a magnetic circuit,

image

where N is the number of conductors (or turns) and I is the current in amperes. The unit of m.m.f. is sometimes expressed as ‘ampere-turns’. However since ‘turns’ have no dimensions, the S.I. unit of m.m.f. is the ampere.

image

For example, a magnetising force of 8000 A/m is applied to a circular magnetic circuit of mean diameter 30 cm by passing a current through a coil wound on the circuit. The coil is uniformly wound around the circuit and has 750 turns. To determine the current in the coil:

image

Permeability and B-H Curves

For air, or any non-magnetic medium, the ratio of magnetic flux density to magnetising force is a constant, i.e. B/H D a constant. This constant is f.L0 , the permeability of free space (or the magnetic space constant) and is equal 10Ł7 H/m, i.e. for air, or any non-magnetic medium,image 

(Although all non-magnetic materials, including air, exhibit slight magnetic properties, these can effectively be neglected.)

For all media other than free space, image

where ur is the relative permeability, and is defined as

image

varies with the type of magnetic material and, since it is a ratio of flux densities, it has no unit. From its definition, f.Lr for a vacuum is 1.

image

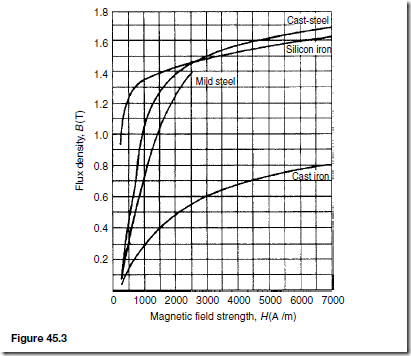
By plotting measured values of flux density B against magnetic field strength H, a magnetisation curve (or B-H curve) is produced. For non-magnetic materials this is a straight line. Typical curves for four magnetic materials are shown in Figure 45.3

For example, a uniform ring of cast iron has a cross-sectional area of 10 cm2 and a mean circumference of 20 cm. The m.m.f. necessary to produce a flux of 0.3 mWb in the ring is determined as follows:

image

image

The relative permeability of a ferromagnetic material is proportional to the slope of the B-H curve and thus varies with the magnetic field strength. The approximate range of values of relative permeability f.Lr for some common magnetic materials are:

image

For example, a flux density of 1.2 T is produced in a piece of cast steel by a magnetising force of 1250 A/m. The relative permeability of the steel under these conditions is determined using

imageReluctance

Reluctance S (or RM ) is the ‘magnetic resistance’ of a magnetic circuit to the presence of magnetic flux.

image

The unit of reluctance is 1/H (or H-1) or A/Wb.

For example, the reluctance of a piece of mumetal of length 150 mm and cross-sectional area 1800 mm2 when the relative permeability is 4000 is given by:

image

Ferromagnetic materials have a low reluctance and can be used as magnetic screens to prevent magnetic fields affecting materials within the screen.

Composite Series Magnetic Circuits

For a series magnetic circuit having n parts, the total reluctance S is given by:

S = S1 + S2 + ··· + Sn

(This is similar to resistors connected in series in an electrical circuit) For example, a closed magnetic circuit of cast steel contains a 6 cm long path of cross-sectional area 1 cm2 and a 2 cm path of cross-sectional area 0.5 cm2. A coil of 200 turns is wound around the 6 cm length of the circuit and a current of 0.4 A flows. If the relative permeability of the cast steel is 750 the flux density in the 2 cm path is determined as follows:

For the 6 cm long path:

image

Comparison between Electrical and Magnetic Quantities

image

Hysteresis and Hysteresis Loss
Hysteresis loop

Let a ferromagnetic material which is completely demagnetised, i.e. one in which B D H D 0, be subjected to increasing values of magnetic field strength H and the corresponding flux density B measured. The resulting relationship between B and H is shown by the curve Oab in Figure 45.4. At a particular value of H, shown as Oy, it becomes difficult to increase the flux density any further. The material is said to be saturated. Thus by is the saturation flux density.

If the value of H is now reduced it is found that the flux density follows curve bc. When H is reduced to zero, flux remains in the iron. This

image

remanent flux density or remanence is shown as Oc in Figure 45.4. When H is increased in the opposite direction, the flux density decreases until, at a value shown as Od, the flux density has been reduced to zero. The magnetic field strength Od required to remove the residual magnetism, i.e. reduce B to zero, is called the coercive force.

Further increase of H in the reverse direction causes the flux density to increase in the reverse direction until saturation is reached, as shown by curve de. If H is varied backwards from Ox to Oy, the flux density follows the curve efgb, similar to curve bcde.

It is seen from Figure 45.4 that the flux density changes lag behind the changes in the magnetic field strength. This effect is called hysteresis. The closed figure bcdefgb is called the hysteresis loop (or the B/H loop).

Hysteresis loss

A disturbance in the alignment of the domains (i.e. groups of atoms) of a ferromagnetic material causes energy to be expended in taking it through a cycle of magnetisation. This energy appears as heat in the specimen and is called the hysteresis loss The energy loss associated with hysteresis is proportional to the area of the hysteresis loop.

If the hysteresis loop is plotted to a scale of 1 cm D ˛ ampere/metre along the horizontal axis and 1 cm D ˇ tesla along the vertical axis, and if A repre- sents the area of the loop in square centimetres, then

image

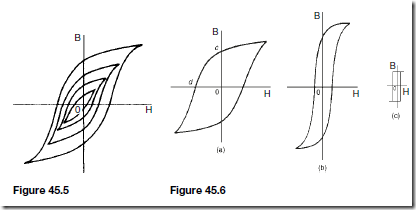
The maximum sized hysteresis loop for a particular material is obtained at saturation. If, for example, the maximum flux density is reduced to half its value at saturation, the area of the resulting loop is considerably less than the area of the loop at saturation. From the areas of a number of such hysteresis loops, as shown in Figure 45.5, the hysteresis loss per cycle was found by Steinmetz (an American electrical engineer) to be proportional to (Bm )n, where n is called the Steinmetz index and can have a value between about 1.6 and 3.0, depending on the quality of the ferromagnetic material and the range of flux density over which the measurements are made.

It is found that the hysteresis loss is given by:

image

where v D volume in cubic metres, f D frequency in hertz, and kh is a constant for a given specimen and given range of B.

For example, if a ferromagnetic specimen has a hysteresis loss of 62500 Wb/m3 when the maximum flux density is 1.5 T at a frequency of 50 Hz, then the hysteresis loss per m3 for a maximum flux density of 1.1 T and frequency of 25 Hz, assuming the Steinmetz index to be 1.6, is determined as follows:

image

The magnitude of the hysteresis loss depends on the composition of the specimen and on the heat treatment and mechanical handling to which the specimen has been subjected.

Figure 45.6 shows typical hysteresis loops for (a) hard steel, which has a high remanence Oc and a large coercivity Od, (b) soft steel, which has a large remanence and small coercivity and (c) ferrite, this being a ceramic- like magnetic substance made from oxides of iron, nickel, cobalt, magnesium, aluminium and manganese. The hysteresis of ferrite is very small.

For a.c.-excited devices the hysteresis loop is repeated every cycle of alternating current. Thus a hysteresis loop with a large area (as with hard steel) is often unsuitable since the energy loss would be considerable.

image

Silicon steel has a narrow hysteresis loop, and thus small hysteresis loss, and is suitable for transformer cores and rotating machine armatures.

Eddy Current Loss

If a coil is wound on a ferromagnetic core (such as in a transformer) and alternating current is passed through the coil, an alternating flux is set up in the core. The alternating flux induces an e.m.f. e in the coil given by:

image However, in addition to the desirable effect of inducing an e.m.f.

in the coil, the alternating flux induces undesirable voltages in the iron core.

These induced e.m.f.’s set up circulating currents in the core, known as eddy currents. Since the core possesses resistance, the eddy currents heat the core, and this represents wasted energy.

Eddy currents can be reduced by laminating the core, i.e. splitting it into thin sheets with very thin layers of insulating material inserted between each pair of the laminations (this may be achieved by simply varnishing one side of the lamination or by placing paper between each lamination). The insulation presents a high resistance and this reduces any induced circulating currents.

image

From equation (4) it is seen that eddy current loss is proportional to the square of the thickness of the core strip. It is therefore desirable to make lamination strips as thin as possible. However, at high frequencies where it is not practicable to make very thin laminations, using ferrite or dust cores may reduce core losses. Dust cores consist of fine particles of carbonyl iron or permalloy (i.e. nickel and iron), each particle of which is insulated from its neighbour by a binding material. Such materials have a very high value of resistivity.

For example, the core of a transformer operating at 50 Hz has an eddy current loss of 100 W/m3and the core laminations have a thickness of 0.50 mm. The core is redesigned so as to operate with the same eddy current loss but at a different voltage and at a frequency of 250 Hz. Assuming that at the new voltage the maximum flux density is one-third of its original value and the resistivity of the core remains unaltered, the necessary new thickness of the laminations is determined as follows:

From equation (4), Pe D ke(Bm )2 f2t2 watts per m3.

Hence, at 50 Hz frequency, 100 D ke(Bm )2 (50)2 (0.50 ð 10Ł3 )2 from 100

image

image

Separation of Hysteresis and Eddy Current Losses

image

which is of the straight line form y D mx C c. Thus if Pc /f is plotted vertically against f horizontally, a straight line graph results having a gradient k2 and a vertical-axis intercept k1

If the total core loss Pc is measured over a range of frequencies, then k1 and k2 may be determined from the graph of Pc /f against f. Hence the hysteresis loss Ph (D k1f) and the eddy current loss Pe(D k2f2) at a given frequency may be determined.

The above method of separation of losses is an approximate one since the Steinmetz index n is not a constant value but tends to increase with increase of frequency. However, a reasonable indication of the relative magnitudes of the hysteresis and eddy current losses in an iron core may be determined.

For example, the total core loss of a ferromagnetic cored transformer winding is measured at different frequencies and the results obtained are:

image


Series and Parallel Networks

Series Circuits

Figure 43.1 shows three resistors R1, R2 and R3 connected end to end, i.e. in series, with a battery source of V volts. Since the circuit is closed a current I will flow and the p.d. across each resistor may be determined from the voltmeter readings V1 , V2 and V3

image

In a series circuit

(a) the current I is the same in all parts of the circuit and hence the same reading is found on each of the ammeters shown, and

(b) the sum of the voltages V1, V2 and V3 is equal to the total applied voltage, V, i.e.

V = V1 + V2 + V3

image

Thus for a series circuit, the total resistance is obtained by adding together the values of the separate resistance’s.

Potential Divider

The voltage distribution for the circuit shown in Figure 43.2(a) is given by:

image

image

The circuit shown in Figure 43.2(b) is often referred to as a potential divider circuit. Such a circuit can consist of a number of similar elements in series connected across a voltage source, voltages being taken from connections between the elements. Frequently the divider consists of two resistors as shown in Figure 43.2(b), where

image

For example, to determined the value of voltage V shown in Figure 43.3: Redrawing the circuit as shown in Figure 43.4

image

Parallel Networks

Figure 43.5 shows three resistors, R1, R2 and R3 connected across each other, i.e. in parallel, across a battery source of V volts.

image

Current Division

For the circuit shown in Figure 43.6,

image

image

Wiring Lamps in Series and in Parallel

Series connection

Figure 43.9 shows three lamps, each rated at 240 V, connected in series across a 240 V supply.

(i) Each lamp has onlyimage V across it and thus each lamp glows dimly.

(ii) If another lamp of similar rating is added in series with the other three lamps then each lamp now has image V across it and each now glows even more dimly.

(iii) If a lamp is removed from the circuit or if a lamp develops a fault (i.e. an open circuit) or if the switch is opened, then the circuit is broken, no current flows, and the remaining lamps will not light up.

(iv) Less cable is required for a series connection than for a parallel one.

image

image

The series connection of lamps is usually limited to decorative lighting such as for Christmas tree lights.

Parallel connection

Figure 43.10 shows three similar lamps, each rated at 240 V, connected in parallel across a 240 V supply.

(i) Each lamp has 240 V across it and thus each will glow brilliantly at their rated voltage.

(ii) If any lamp is removed from the circuit or develops a fault (open circuit)

or a switch is opened, the remaining lamps are unaffected.

(iii) The addition of further similar lamps in parallel does not affect the bright- ness of the other lamps.

(iv) More cable is required for parallel connection than for a series one.

The parallel connection of lamps is the most widely used in electrical installations.


Chemical Effects of Electricity

Introduction

A material must contain charged particles to be able to conduct electric current. In solids, electrons carry the current. Copper, lead, aluminium, iron and carbon are some examples of solid conductors. In liquids and gases, the current is carried by the part of a molecule that has acquired an electric charge, called ions. These can possess a positive or negative charge, and examples include hydrogen ion HC, copper ion Cu++ and hydroxyl ion OH-. Distilled water contains no ions and is a poor conductor of electricity, whereas salt water contains ions and is a fairly good conductor of electricity.

Electrolysis

Electrolysis is the decomposition of a liquid compound by the passage of electric current through it. Practical applications of electrolysis include the electroplating of metals, the refining of copper and the extraction of aluminium from its ore.

An electrolyte is a compound that will undergo electrolysis. Examples include salt water, copper sulphate and sulphuric acid.

The electrodes are the two conductors carrying current to the electrolyte. The positive-connected electrode is called the anode and the negative-connected electrode the cathode.

When two copper wires connected to a battery are placed in a beaker containing a salt-water solution, current will flow through the solution. Air bubbles appear around the wires as the water is changed into hydrogen and oxygen by electrolysis.

Electroplating

Electroplating uses the principle of electrolysis to apply a thin coat of one metal to another metal. Some practical applications include the tin-plating of steel, silver-plating of nickel alloys and chromium plating of steel. If two copper electrodes connected to a battery are placed in a beaker containing copper sulphate as the electrolyte it is found that the cathode (i.e. the electrode connected to the negative terminal of the battery) gains copper whilst the anode loses copper.

The Simple Cell

The purpose of an electric cell is to convert chemical energy into electrical energy.

A simple cell comprises two dissimilar conductors (electrodes) in an electrolyte. Such a cell is shown in Figure 42.1, comprising copper and zinc electrodes. An electric current is found to flow between the electrodes. Other possible electrode pairs exist, including zinc-lead and zinc-iron. The electrode potential (i.e. the p.d. measured between the electrodes) varies for each pair of metals. By knowing the e.m.f. of each metal with respect to some standard electrode, the e.m.f. of any pair of metals may be determined. The standard used is the hydrogen electrode. The electrochemical series is a way of listing elements in order of electrical potential, and Table 42.1 shows a number of elements in such a series.

image

In a simple cell two faults exist — those due to polarisation and local action.

Polarisation

If the simple cell shown in Figure 42.1 is left connected for some time, the current I decreases fairly rapidly. This is because of the formation of a film of hydrogen bubbles on the copper anode. This effect is known as the polarisation of the cell. The hydrogen prevents full contact between the copper electrode and the electrolyte and this increases the internal resistance of the

image

cell. The effect can be overcome by using a chemical depolarising agent or depolariser, such as potassium dichromate that removes the hydrogen bubbles as they form. This allows the cell to deliver a steady current. For more on polarisation, see chapter 78.

Local action

When commercial zinc is placed in dilute sulphuric acid, hydrogen gas is liberated from it and the zinc dissolves. The reason for this is that impurities, such as traces of iron, are present in the zinc that set up small primary cells with the zinc. These small cells are short-circuited by the electrolyte, with the result that localised currents flow causing corrosion. This action is known as local action of the cell. This may be prevented by rubbing a small amount of mercury on the zinc surface, which forms a protective layer on the surface of the electrode.

When two metals are used in a simple cell the electrochemical series may be used to predict the behaviour of the cell:

(i) The metal that is higher in the series acts as the negative electrode, and vice-versa. For example, the zinc electrode in the cell shown in Figure 42.1 is negative and the copper electrode is positive.

(ii) The greater the separation in the series between the two metals the greater is the e.m.f. produced by the cell.

The electrochemical series is representative of the order of reactivity of the metals and their compounds:

(i) The higher metals in the series react more readily with oxygen and vice- versa.

(ii) When two metal electrodes are used in a simple cell the one that is higher in the series tends to dissolve in the electrolyte.

Corrosion

Corrosion is the gradual destruction of a metal in a damp atmosphere by means of simple cell action. In addition to the presence of moisture and air required for rusting, an electrolyte, an anode and a cathode are required for corrosion. Thus, if metals widely spaced in the electrochemical series, are used in contact with each other in the presence of an electrolyte, corrosion will occur. For example, if a brass valve is fitted to a heating system made of steel, corrosion will occur.

The effects of corrosion include the weakening of structures, the reduction of the life of components and materials, the wastage of materials and the expense of replacement.

Corrosion may be prevented by coating with paint, grease, plastic coatings and enamels, or by plating with tin or chromium. Also, iron may be galvanised, i.e. plated with zinc, the layer of zinc helping to prevent the iron from corroding.

E.m.f. and Internal Resistance of a Cell

The electromotive force (e.m.f.), E, of a cell is the p.d. between its terminals when it is not connected to a load (i.e. the cell is on ‘no load’).

The e.m.f. of a cell is measured by using a high resistance voltmeter connected in parallel with the cell. The voltmeter must have a high resistance otherwise it will pass current and the cell will not be on ‘no-load’. For example, if the resistance of a cell is 1 Q and that of a voltmeter 1 MQ then the equivalent resistance of the circuit is 1 MQ C 1 Q, i.e. approximately 1 MQ, hence no current flows and the cell is not loaded.

The voltage available at the terminals of a cell falls when a load is connected. This is caused by the internal resistance of the cell, that is, the opposition of the material of the cell to the flow of current. The internal resistance acts in series with other resistances in the circuit. Figure 42.2 shows a cell of e.m.f. E volts and internal resistance, r, and XY represents the terminals of the cell.

When a load (shown as resistance R) is not connected, no current flows and the terminal p.d., V D E. When R is connected a current I flows which causes a voltage drop in the cell, given by Ir. The p.d. available at the cell terminals is less than the e.m.f. of the cell and is given by:

image

Thus, if a battery of e.m.f. 12 volts and internal resistance 0.01 Q delivers a current of 100 A, the terminal p.d.,

V = 12 – (100)(0.01) = 12 – 1 = 11 V

When different values of potential difference V across a cell or power supply are measured for different values of current I, a graph may be plotted as shown in Figure 42.3. Since the e.m.f. E of the cell or power supply is the p.d. across its terminals on no load (i.e. when I D 0), then E is as shown by the broken line.

Since V = E – Ir then the internal resistance may be calculated from

imageWhen a current is flowing in the direction shown in Figure 42.2 the cell is said to be discharging (E > V).

When a current flows in the opposite direction to that shown in Figure 42.2 the cell is said to be charging (V > E).

A battery is a combination of more than one cell. The cells in a battery may be connected in series or in parallel.

(i) For cells connected in series:

Total e.m.f. = sum of cell’s e.m.f.’s

Total internal resistance = sum of cell’s internal resistance’s

(ii) For cells connected in parallel:

If each cell has the same e.m.f. and internal resistance: Total e.m.f. D e.m.f. of one cell

Total internal resistance of n cells

image

For example, eight cells, each with an internal resistance of 0.2 Q and an e.m.f. of 2.2 V are connected (a) in series, (b) in parallel.

image

Primary Cells

Primary cells cannot be recharged, that is, the conversion of chemical energy to electrical energy is irreversible and the cell cannot be used once the chemicals are exhausted. Examples of primary cells include the Leclanche´ cell and the mercury cell.

Lechlanche´ cell

A typical dry Lechlanche´ cell is shown in Figure 42.4. Such a cell has an e.m.f. of about 1.5 V when new, but this falls rapidly if in continuous use due to polarisation. The hydrogen film on the carbon electrode forms faster than can be dissipated by the depolarizer. The Lechlanche´ cell is suitable only for intermittent use, applications including torches, transistor radios, bells, indicator circuits, gas lighters, controlling switch-gear, and so on. The cell is the most commonly used of primary cells, is cheap, requires little maintenance and has a shelf life of about 2 years.

image

Mercury cell

A typical mercury cell is shown in Figure 42.5. Such a cell has an e.m.f. of about 1.3 V which remains constant for a relatively long time. Their main advantage over the Lechlanche´ cell is its smaller size and its long shelf life. Typical practical applications include hearing aids, medical electronics, cam- eras and for guided missiles.

Secondary Cells

Secondary cells can be recharged after use, that is, the conversion of chemical energy to electrical energy is reversible and the cell may be used many times. Examples of secondary cells include the lead-acid cell and the alkaline cell. Practical applications of such cells include car batteries, telephone circuits and for traction purposes — such as milk delivery vans and fork lift trucks.

Lead-acid cell

A typical lead-acid cell is constructed of:

(i) A container made of glass, ebonite or plastic.

(ii) Lead plates

(a) the negative plate (cathode) consists of spongy lead

(b) the positive plate (anode) is formed by pressing lead peroxide into the lead grid.

The plates are interleaved as shown in the plan view of Figure 42.6 to increase their effective cross-sectional area and to minimise internal resistance.

(iii) Separators made of glass, celluloid or wood.

(iv) An electrolyte which is a mixture of sulphuric acid and distilled water.

The relative density (or specific gravity) of a lead-acid cell, which may be measured using a hydrometer, varies between about 1.26 when the cell is fully charged to about 1.19 when discharged. The terminal p.d. of a lead-acid cell is about 2 V.

When a cell supplies current to a load it is said to be discharging. During discharge:

(i) the lead peroxide (positive plate) and the spongy lead (negative plate) are converted into lead sulphate, and

(ii) the oxygen in the lead peroxide combines with hydrogen in the electrolyte to form water. The electrolyte is therefore weakened and the relative density falls.

The terminal p.d. of a lead-acid cell when fully discharged is about 1.8 V. A cell is charged by connecting a d.c. supply to its terminals, the positive

image

terminal of the cell being connected to the positive terminal of the supply. The charging current flows in the reverse direction to the discharge current, and the chemical action is reversed. During charging:

(i) the lead sulphate on the positive and negative plates is converted back to lead peroxide and lead respectively, and (ii) the water content of the electrolyte decreases as the oxygen released from the electrolyte combines with the lead of the positive plate. The relative density of the electrolyte thus increases.

The colour of the positive plate when fully charged is dark brown and when discharged is light brown. The colour of the negative plate when fully charged is grey and when discharged is light grey.

Alkaline cell

There are two main types of alkaline cell — the nickel-iron cell and the nickel- cadmium cell. In both types the positive plate is made of nickel hydroxide enclosed in finely perforated steel tubes, the resistance being reduced by the addition of pure nickel or graphite. The tubes are assembled into nickel-steel plates.

In the nickel-iron cell, (sometimes called the Edison cell or nife cell), the negative plate is made of iron oxide, with the resistance being reduced by a little mercuric oxide, the whole being enclosed in perforated steel tubes and assembled in steel plates. In the nickel-cadmium cell the negative plate is made of cadmium. The electrolyte in each type of cell is a solution of potassium hydroxide that does not undergo any chemical change and thus the quantity can be reduced to a minimum. The plates are separated by insulating rods and assembled in steel containers that are then enclosed in a non-metallic crate to insulate the cells from one another. The average discharge p.d. of an alkaline cell is about 1.2 V.

Advantages of an alkaline cell (for example, a nickel-cadmium cell or a nickel-iron cell) over a lead-acid cell include:

(i) More robust construction

(ii) Capable of withstanding heavy charging and discharging currents without damage

(iii) Has a longer life

(iv) For a given capacity is lighter in weight

(v) Can be left indefinitely in any state of charge or discharge without damage

(vi) Is not self-discharging

Disadvantages of an alkaline cell over a lead-acid cell include:

(i) Is relatively more expensive

(ii) Requires more cells for a given e.m.f.

(iii) Has a higher internal resistance

(iv) Must be kept sealed

(v) Has a lower efficiency

Alkaline cells may be used in extremes of temperature, in conditions where vibration is experienced or where duties require long idle periods or heavy

discharge currents. Practical examples include traction and marine work, lighting in railway carriages, military portable radios and for starting diesel and petrol engines.

However, the lead-acid cell is the most common one in practical use.

Cell Capacity

The capacity of a cell is measured in ampere-hours (Ah). A fully charged 50 battery rated for 10 h discharge can be discharged at a steady current of 5 A for 10 h, but if the load current is increased to 10 A then the battery is discharged in 3– 4 h, since the higher the discharge current, the lower is the effective capacity of the battery. Typical discharge characteristics for a lead-acid cell are shown in Figure 42.7.

image


Resistance Variation

Resistance and Resistivity

The resistance of an electrical conductor depends on four factors, these being:

(a) the length of the conductor, (b) the cross-sectional area of the conductor,

(c) the type of material and (d) the temperature of the material.

Resistance, R, is directly proportional to length, l, of a conductor, i.e. R / l. Thus, for example, if the length of a piece of wire is doubled, then the resistance is doubled.

Resistance, R, is inversely proportional to cross-sectional area, a, of a conductor, i.e. image. Thus, for example, if the cross-sectional area of a piece of wire is doubled then the resistance is halved.

Since R / l and image then image . By inserting a constant of proportionality into this relationship the type of material used may be taken into account.

The constant of proportionality is known as the resistivity of the material and is given the symbol p (Greek rho).

image

Temperature Coefficient of Resistance

In general, as the temperature of a material increases, most conductors increase in resistance, insulators decrease in resistance, whilst the resistance of some special alloys remain almost constant.

image

If the resistance of a material at room temperature (approximately 20°C), R20, and the temperature coefficient of resistance at 20°C, ˛20, are known, then the resistance Rˇ at temperature ˇ°C is given by:

image

For example, a coil of copper wire has a resistance of 10 Q at 20°C. If the temperature coefficient of resistance of copper at 20°C is 0.004/° C the resistance of the coil when the temperature rises to 100° C is given by:

image

If the resistance at 0°C is not known, but is known at some other temperature ˇ1, then the resistance at any temperature can be found as follows:

image

For example, some copper wire has a resistance of 200 Q at 20°C. A current is passed through the wire and the temperature rises to 90° C. The resistance of the wire at 90°C, assuming that the temperature coefficient of resistance is 0.004/° C at 0°C, is given by:

image

Resistor Colour Coding and Ohmic Values

(a) Colour code for fixed resistors

The colour code for fixed resistors is given in Table 41.1

(i) For a four-band fixed resistor (i.e. resistance values with two significant figures):

image

image

yellow-violet-orange-red indicates 47 kQ with a tolerance of š2% (Note that the first band is the one nearest the end of the resistor)

(ii) For a five-band fixed resistor (i.e. resistance values with three significant figures):

red-yellow-white-orange-brown indicates 249 kQ with a tolerance of š1%

(Note that the fifth band is 1.5 to 2 times wider than the other bands)

(b) Letter and digit code for resistors

Another way of indicating the value of resistors is the letter and digit code shown in Table 41.2

Tolerance is indicated as follows:

image