Voltage/Current and Power/Current Diagrams
Summarizing the results of the last sections, the fuel cell potential is
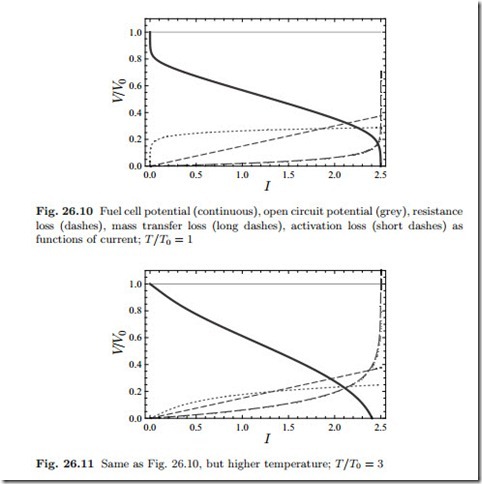
where the first term is the open circuit potential, and the following three terms describe the irreversible losses due to resistance, mass transfer and activation. Figure 26.10 compares the actual potential (continuous) with the open circuit potential (grey), and also shows the individual losses, all in dimensionless quantities where the open circuit potential is unity.
The activation loss (short dashes) causes the sharp drop of the potential for small currents, it grows only slightly for larger currents. The resistance
loss (dashes) grows linearly with current and causes the linear drop of the potential in the middle. The mass transfer loss (long dashes) is relatively small until the current approaches the limiting current which causes a sharp increase, and the sudden drop of the potential.
These curves agree qualitatively with curves found in the specialist literature on fuel cells. The relative contribution of the different losses depends on design and materials, and on temperature.
Figure 26.11 shows the same curves at a higher temperature. Now the activation losses are reduced, but the mass transfer losses are increased. It should be noted that low and high temperature fuel cells are fundamentally different in materials, physical processes and design, and thus this is only a qualitative comparison.
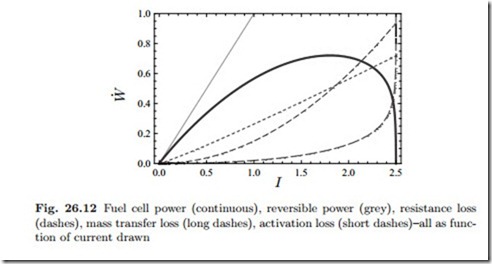
The power-current characteristic is shown in Fig. 26.12, based on the same data as the first voltage curve, Fig. 26.10. A reversible fuel cell would deliver the power V0I (continuous), but due to the various losses, the power curve exhibits a maximum, and drops to zero at the limiting current. In order to minimize the losses, a fuel cell should operate at currents well left of the maximum, where the losses are relatively small. Note that the power loss is the difference between the actual power curve and the reversible curve, and grows non-linearly with current!


