Practical aspects
Introduction
Programmable controllers are, simply, tools that enable a plant to function reliably, economically and safely. This chapter considers some of the factors that must be included in the design of a control system to meet these criteria.
Safety
Introduction
Most industrial plant has the capacity to maim or kill. It is therefore the responsibility of all people, both employers and employees, to ensure that no harm comes to any person as a result of activities on an industrial site.
Not surprisingly, this moral duty is also backed up by legislation. It is interesting that most safety legislation is reactive, i.e. responding to inci- dents which have occurred and trying to prevent them happening again. Most safety legislation has a common theme. Employers and employees are deemed to have a duty of care to ensure the health, safety and welfare of the employees, visitors and the public. Failure in this duty of care is called negligence. Legislation defines required actions at three levels.
· Shall or must are absolute duties which have to be obeyed without regard to cost. If the duty is not feasible the related activity must not take place.
· If practicable means the duty must be obeyed if feasible. Cost is not
a consideration. If an individual deems the duty not to be feasible, proof of this assertion will be required if an incident occurs.
· Reasonably practicable is the trickiest as it requires a balance of risk
against cost. In the event of an incident an individual will be required to justify the actions taken.
Safety legislation differs from country to country, although harmoni- zation is under way in Europe. This section describes safety from a British viewpoint, although the general principles apply throughout the European community and are applicable in principle throughout the world. The descriptions are, of course, a personal view and should only be taken as a guide. The reader is advised to study the original legisla- tion before taking any safety related decisions.
The Health and Safety at Work Act 1974 (HASWA) lays down the main safety provisions in the United Kingdom. It is wide ranging and covers everyone involved with work (both employers and employees) or affected by it. In the USA the Occupational Safety and Health Act (OSHA) affords similar protection.
HASWA defines and builds on general duties to avoid all possible hazards, and its main requirement is described in section 2(l) of the act:
It shall be the duty of every employer to ensure, so far as is reasonably practicable, the health, safety and welfare at work for his employees.
This duty is extended in later sections to visitors, customers, the general public and (upheld in the courts) even trespassers. The onus of proof of ‘reasonably practicable’ lies with the employer in the event of an incident.
Risk assessment
It is all but impossible to design a system which is totally and absolutely fail-safe. Modern safety legislation (such as the ‘six pack’ listed in Section 8.2.6) recognizes the need to balance the cost and complexity of the safety system against the likelihood and severity of injury. The procedure, known as risk assessment, uses common terms with specific definitions:
· Hazard The potential to cause harm.
· Risk A function of the likelihood of the hazard occurring and
the severity.
· Danger The risk of injury.
Risk assessment is a legal requirement under most modern legisla- tion, and is covered in detail in standard prEN1050 ‘Principles of Risk Assessment’.
The first stage is identification of the hazards on the machine or process. This can be done by inspections, audits, study of incidents (near misses) and, for new plant, by investigation at the design stage. Examples of hazards are: impact/crush, snag points leading to entan- glement, drawing in, cutting from moving edges, stabbing, shearing (leading to amputation), electrical hazards, temperature hazards (hot
and cold), contact with dangerous material and so on. Failure modes should also be considered, using standard methods such as HAZOPS (Hazard and Operability Study, with key words ‘too much of’ and ‘too little of’), FMEA (Failure Modes and Effects Analysis) and Fault Tree Analysis.
With the hazards documented the next stage is to assess the risk for each. There is no real definitive method for doing this, as each plant has different levels of operator competence and maintenance standards. A risk assessment, however, needs to be performed and the results and conclu- sions documented. In the event of an accident, the authorities will ask to see the risk assessment. There are many methods of risk assessment, some quantitative assigning points, and some using broad qualitative judgements.
Whichever method is used there are several factors that need to be considered. The first is the severity of the possible injury. Many sources suggest the following four classifications:
· Fatality One or more deaths.
· Major Non-reversible injury, e.g. amputation, loss of sight, disability.
· Serious Reversible but requiring medical attention, e.g. burn, broken
joint.
· Minor Small cut, bruise, etc.
The next step is to consider how often people are exposed to the risk.
Suggestions here are:
· Frequent Several times per day or shift.
· Occasional Once per day or shift.
· Seldom Less than once per week.
Linked to this is how long the exposure lasts. Is the person exposed to danger for a few seconds per event or (as with major maintenance work) several hours? There may also be a need to consider the number of people who may be at risk; often a factor in petrochemical plants.
Where the speed of a machine or process is slow, the exposed person can easily move out of danger in time. There is less risk here than with a silent high-speed machine which can operate before the person can move. From studying the machine operation, the probability of injury in the event of failure of the safety system can be assessed as:
Certain, Probable, Possible, Unlikely
From this study, the risk of each activity is classified. This classification will depend on the application. Some sources suggest applying a points scoring scheme to each of the factors above, then using the total score to determine high, medium and low risks. Maximum possible loss (MPL), for example, uses a 50 point scale ranging from 1 for a minor scratch to 50
for a multi-fatality. This is combined with the frequency of the hazardous activity (F ) and the probability of injury (again on a 1–50 scale) in the formula:
risk rating (RR) = F ´ (MPL + P )
The course of action is then based on the risk rating.
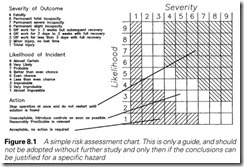
An alternative and simpler (but less detailed approach) uses a table as in Figure 8.1 from which the required action can be quickly read.
There is, however, no single definitive method, but the procedure used must suit the application and be documented. The study and reduction of risks is the important aim of the activity.
The final stage is to devise methods of reducing the residual risk to an acceptable level. These methods will include removal of risk by good design (e.g. removal of trap points), reduction of the risk at source (e.g. lowest possible speed and pressures, less hazardous material), containment by guarding, reducing exposure times, provision of personal protective equipment and establishing written safe working procedures which must be followed. The latter implies competent employees and training programs.
PLCs, computers and safety
A PLC can introduce potentially dangerous situations in different ways. The first (and probably commonest) route is via logical errors in the program. These can be the result of oversight, or misunderstanding, on behalf of the original designer who did not appreciate that this set of actions could be dangerous, or by later modifications by people who deliberately (or accidentally) removed some protection to overcome a failure in the middle of the night. Midnight programming is particularly worrying as usually the only person who knows it has been done is the offending person, and the danger may not be apparent until a con- siderable time (days, weeks, months, years) passes and the hazardous condition occurs.
The second possible cause is failure of the input and output modules; in particular the components connected directly to the plant which will be exposed to high-voltage interference (and possibly direct-connected high voltages in the not unlikely event of cable damage). Output modules can also suffer high currents in the (again not unlikely) event of a short circuit.
Typical output devices are triacs, thyristors or transistors. The failure mode of these cannot be predicted; all can fail short circuit or open circuit. In these conditions the PLC would be unable to control the outputs. Similarly an input signal card can fail in either the ‘On’ or ‘Off’ state, leaving the PLC misinterpreting a possibly important signal.
The next failure mode is the PLC itself. This can be further divided into hardware, software and environmental failures. A hardware failure is concerned with the machine itself; its power supply, its processor, the memory (which contains the supplier’s software with the ‘personality’ of the PLC, the user’s program, and the data storage). Some of these failures will have predictable effects; a power supply failing will cause all outputs to de-energize, and the PLC supplier will have included checks on the memory in his design (using techniques similar to the CRC dis- cussed in Section 5.2.7). Environmental effects arise from peculiarities in the installation such as dust, temperature (and rapid temperature changes) and vibration.
The final cause is electrical interference (usually called noise). Inter- nally almost all PLCs work with 5 volt signals, but are surrounded externally by high-voltage, high-current devices. Noise can cause input signals to be misread by the PLC, and in extreme cases can corrupt the PLC’s internal memory. PLCs generally have internal protection against memory corruption and noise on remote I/O serial lines (again using CRC and similar ideas) so the usual effect of noise is to cause a PLC to stop (and outputs to de-energize). This cannot, however, be relied upon.
There is no such thing as an absolutely safe process; it is always poss- ible to identify some means of failure which could result in an unsafe condition. In a well-designed system these failure modes are exceedingly unlikely.
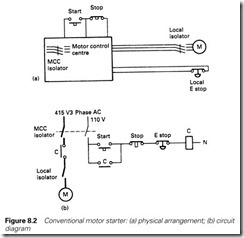
Figure 8.2 shows a normal motor starter circuit built without a PLC. We will deal with emergency stop circuits in the following section, but for the time being the safety precautions here are
(a) Isolation switch at the MCC removes the supply.
(b) Local isolation switch by the motor. This, and (a), are for protec- tion during maintenance work on the motor or its load.
(c) Normally closed contact on the stop and emergency stop buttons. A broken wire will act as if a stop button has been pressed, as will loss of the supply.
(d) If the emergency stop is pressed and released, the motor will not restart.
(e) Isolation, stop and emergency stop have priority over start.
It is possible, though, to identify dangerous failure modes. The button head of the emergency stop button could unscrew and fall off, or the contacts of the contactor could weld made (albeit two welding together
are needed to cause an unsafe condition), but these failure modes are exceedingly rare, and, without discussing further details of the emer- gency stop function, Figure 8.2 would be generally accepted as safe.
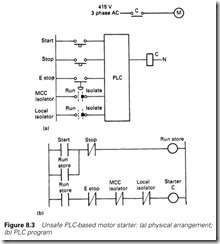
In Figure 8.3 the same function has been provided by an unsafe PLC system. To save costs the MCC and local isolators have been replaced by simple switches which make to say ‘isolate’. Similarly normally open contacts have been used for stop and emergency stop. This is controlled by the unsafe program of Figure 8.3(b).
It is important to realize that to the casual user, Figures 8.2 and 8.3 behave in an identical manner. The differences (and dangers) come in fault, or unusual, conditions. In particular
(a) A person using a programming terminal can force inputs or outputs and override the isolation. Although it is unlikely that anyone
would do this deliberately, it is easy to confuse similar addresses and swap digits (forcing 0:23/01 instead of 0:32/01, for example).
(b) A loss of the input control supply during running will mean the motor cannot be stopped by any means.
(c) If the emergency stop is pressed and released, the motor will restart.
None of these are apparent to the user until they are needed in an emergency.
A prime rule, therefore, for using PLCs and computers is ‘The system should be at least as safe as a conventional system.’
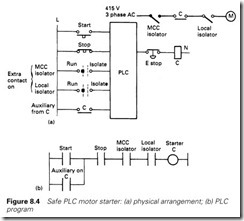
Figure 8.4 is a revised PLC version of Figure 8.2. The isolators have been reinstated with auxiliary contacts as PLC inputs, and normally closed contacts used for the stop and emergency stop buttons. An auxil- iary contact has been added to the starter, and this is used to latch the PLC program of Figure 8.4(b). The emergency stop is hardwired into the output and is independent of the PLC, and on release the motor will not restart (because the latching auxiliary contact in the program will have been lost). On loss of control supply the program will think the
stop button has been pressed, and the motor will stop. Figure 8.4 thus behaves in failure as Figure 8.2, and meets the rule above.
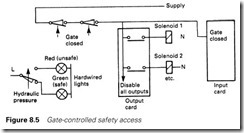
Figure 8.5 shows a similar idea used to disable a hydraulic system when the operator opens a gate giving access to a machine. The gate removes power to the PLC output card driving the solenoids which will all de-energize regardless of what the PLC is doing. A separate input to the PLC also software disables outputs. One of the solenoids is the load- ing valve which, when de-energized, causes the manifold pressure to fall to near zero. This pressure is monitored by hardwired traffic lights.
Although these examples are simple, the necessary analysis and con- siderations are identical in more complex systems.
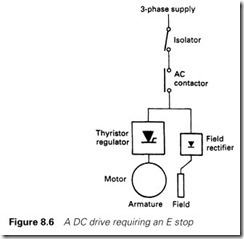
Complex electronic systems can bring increased safety. In Figure 8.6 a thyristor drive is controlling the speed of a large DC motor. The arrangement is typical; switched isolator for maintenance and an upstream AC contactor. It is required to add an emergency stop to this drive. Using this to hardwire the AC contactors will obviously stop the drive, but the inertia of the motor and the load will keep it rotating for several seconds. A thyristor drive, however, can stop the load in less than one second by regenerative braking the motor, but this requires the drive to be alive and functional.
The operation of the emergency stop implies a dangerous condition in which the fastest possible stop is required. It is almost certain that at this time the drive controls are functional and there are no ‘latent’ faults. Faults with the speed control system would have been noticed by the operator, for example. From a risk assessment, the author would argue that if a guarding system was not practicable, the emergency stop should operate in two ways. First, it initiates an electronic regenerative crash stop via the control system which should stop the drive in less
than one second (albeit at great strain to the motor and mechanics). The emergency stop also releases a delay drop-out hardwire relay set for 1.5 seconds which releases the AC contactor. This gives the safest possible reaction to the pressing of the emergency stop button.
Safety considerations do not therefore explicitly require relay-based, non-electronic hardware, but the designer must be prepared to justify the design decisions and the methods used. Where complex control sys- tems are to be used, a common method is to duplicate sensors, control systems and actuators. This is known as redundancy.
A typical application is a boiler with feed water being held in a drum. Deviations in water level are dangerous; too low and the boiler will overheat, possibly to the point of melting the boiler tubes; too high and water can be carried over to the downstream turbine with risk of catastrophic blade failure. High- and low-level sensors are provided and each are duplicated. The control system reacts to any fault signal, so two sensors have to fail for a dangerous condition to arise. If the probability of a sensor failure in time T is p (where 0 < p < 1) the probability of both failing is p2. In a typical case, p will be of the order of 10-4 giving p2 a probability of 10-8.
There are two disadvantages. The first is that a sensor can fail into
a permanently safe signal state, and this failure will be ‘latent’, i.e. hidden from the user with the plant running on one sensor. The second prob- lem is that the plant reliability will go down, since the number of sensors
goes up and any sensor failure can result in a shutdown. Both of these effects can be reduced by using ‘majority voting’ circuits, taking the vote of two out of three or three out of five signals.
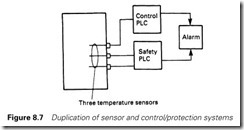
So far we have duplicated the sensors. To give true redundancy, it is sensible to provide duplication in the control system as well to protect against hardware and software failures in the system itself. Figure 8.7 shows three temperature sensors (for redundancy) connected into two separate and independent PLC systems, one concerned with control and safety and one purely concerned with control. A simultaneous failure of both is required to give a hazard.
Redundancy can be defeated by ‘Common mode’ failures. These are failures which affect all the parallel paths simultaneously. Power supplies, electrical interference on cables following the same route and identical components from the same batch from the same supplier are all prone to common mode failure. For true protection, diverse redundancy must be used, with differences in components, routes and implementation to reduce the possibility of simultaneous failure.
Examples such as the duplicate control scheme of Figure 8.7 are also vulnerable to a form of common mode failure called a ‘systematic failure’. Suppose the temperature sensors are compared, inside the program, with an alarm temperature. Suppose both are identical systems, running the same program containing a bug which inadvertently (but rarely, so it does not show up during simple testing) changes the setting for the alarm temperature (from, say, 60 °C to 32 053 °C). Such an effect could easily occur by a mistype in a move instruction in a totally unrelated part of the program. This error will affect both control systems, and totally remove the redundancy.
If reliance is being made on redundant control systems, they should be totally different; different machines with different I/O and different programs written by different people with the machines installed running
on different power supplies with different types of sensors connected by different cable routes. This is what true redundancy means.
The Health and Safety Executive (HSE) became concerned about the safety of direct plant control with computers, and produced an occasional paper OP2 ‘Microprocessors in Industry’ in 1981. This was followed in 1987 by two booklets Programmable Electronics Systems in Safety Related Applications, book 1, an Introductory Guide and book 2, General Technical Guidelines. Book 1, like the earlier 1981 publication, is a general discus- sion of the topic, with book 2 going through the necessary design stages. They suggest a five stage process:
(i) Perform a hazard analysis of the plant or process (key phrases like ‘too much of’, ‘too little of’, ‘over’, ‘under’ are useful here).
(ii) From this, identify which parts of the control system are concerned with safety and which are concerned purely with efficient produc- tion. The latter can be ignored for the rest of the analysis.
(iii) Determine the required safety level (based on accepted attainable standards or published material).
(iv) Design safety systems to meet or exceed these standards. The HSE stress the importance of ‘quality’ in the design; quality of components, quality of the suppliers and so on.
(v) Assess the achieved level (by using predicted probability of failure for individual parts of the design). Revise the design if the required level has not been achieved.
Testing is a crucial part of safety, and it can be difficult to complete a sensible test routine with the unavoidable pressures to get a plant into production. Once the control room lights are on, there is a ‘gung-ho, let’s be away’ attitude. This can be hard to resist, particularly if the project is late, but it can be lethal. The only way to avoid this trap is to have a pre-agreed safety checklist (written in the cold light of day well before testing starts) which can be ticked off item by item. The engineer then has firm grounds for not releasing the plant until all items are cleared.
Maintenance is, perhaps, the most dangerous time. Chernobyl, Flixborough, Three Mile Island, Bhopal, Piper Alpha and the Charing Cross rail accident all had seeds in ill-advised maintenance activity. The author has seen faulty protection systems bypassed ‘to get the plant away’, with the bypasses still in place weeks later. The ease of program- ming of PLCs makes them very vulnerable (and it is for this reason that programs held in ROM are preferred for safety applications).
Plant must be put into a safe condition before people work on it. The need for electrical isolation and a Permit to Work system is generally appreciated (and the isolators in Figure 8.2 are provided for this purpose) but the danger from pneumatic or hydraulic actuators is often overlooked.
If a PLC stops or is powered down (a not unlikely event on maintenance periods) all solenoids will de-energize and plant may move. Isolation procedures must therefore include all actuators and not just the obvious electric motors.
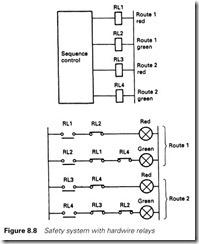
Using relays it is possible to design circuits which are almost fail-safe using the principle shown for simple traffic lights in Figure 8.8. (No circuit can ever be totally fail-safe, of course.) Here the cross-coupling of the relays, along with the use of techniques such as spring-loaded terminals to prevent cores coming loose under vibration, ensures that the system can fail with no lights, or locked onto one route, or showing both red, but it cannot fail showing both green. To achieve this, high-quality relays are used, constructed in such a manner that an internal mechanical collapse cannot lead to normally open and normally closed contacts being made together. With a very high degree of safety, the idea of
Figure 8.8 is widely used in lifts, traffic lights, burner control and railway signalling.
The safety levels of Figure 8.8 are becoming achievable with some PLCs. Siemens market the 115F PLC which has been approved by the German TUV Bayern (Technical Inspectorate of Bavaria) for use in safety critical applications such as transport systems, underground railways, road traffic control and elevators. The system is based on two 115 PLCs and is a model of diverse redundancy. The two machines run diverse system software and check each other’s actions. There is still a responsibility on the user to ensure that no systematic faults exist in the application software.
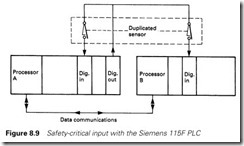
Inputs are handled as in Figure 8.9. Diverse (separate) sensors are fed from a pulsed output. A signal is dealt with only if the two processors agree. Obviously the choice of sense of the signal for safety is important. For an over-travel limit, for example, the sensors should be made for healthy and open for a fault.
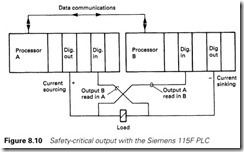
Actuators use two outputs (of opposite sense) and two inputs to check the operation as Figure 8.10. Each subunit checks the operation of the other by brief pulsing of the outputs allowing the circuit to detect cable damage, faulty output modules and open circuit actuators. If, for example, output B fails On, both inputs A and B will go high in the Off state (but the actuator will safely de-energize).
The operation of Figures 8.9 and 8.10 is straightforward, but it should not be taken as an immediately acceptable way of providing a fail-safe PLC. The 115F is truly diverse redundant, even the internal integrated circuits are selected from different batches and different manufacturers, and it contains well-tested diverse self-checking internal
software. A DIY system would not have these features, and could be prone to common mode or systematic failures.
Figure 8.11 shows a dynamic fail-safe circuit sometimes used in appli- cations such as gas burner control. Here a valid output signal is a square wave pulse train of a specific frequency (obtained by turning an output on and off rapidly). This oscillating signal passes through a narrow bandpass filter and, when rectified, energizes the actuator. Failure of the CPU would lead to failure of the pulse train (or a shift in frequency of the pulse train which would then be rejected by the filter). Failure of the output would give a DC signal which would again be rejected by the filter. Failure of any component in the filter will cause a shift in the band- pass frequency and a failure to respond to normal outputs. The principle of Figure 8.11 is often used as a single ‘watchdog’ output which can be used as an interlock to say the PLC is healthy.
Emergency stops
Most plants have moving parts with the ability to cause harm. There is therefore a need to provide some method of stopping the operation in the shortest possible time when some form of danger is seen by the operators. Usually the initiation is provided by emergency stop push- buttons at strategic points around the plant. These must be red, mush- room headed buttons surrounded by a yellow surface. They must latch and need some form of manual action (key, twist or pull) to release. Even when the button is released the plant must not start again without some separate restart operation. Conveyors and similar items use pull wire emergency stops which have to be physically reset.
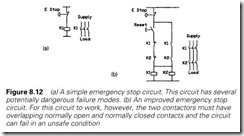
Until fairly recently, an emergency stop circuit would operate as shown in Figure 8.12(a), and indeed the earlier circuit of Figure 8.2 implemented the emergency stop in this way. Operation of the button breaks the control circuit to the contactor, causing it to de-energize and remove power from the machine. This circuit, however, has several failure modes which may be dangerous. In particular, the contactor contacts may weld made or the opening spring in the contactor may break. In these circumstances the emergency stop will have no effect.
Figure 8.12(b) uses redundancy to give improved safety. With redun- dancy, care must be taken to ensure that the failure of one element cannot lead to continued, apparently normal, operation on the remaining elements with reduced safety. In this circuit both contactors must fail for the emergency stop to be inoperative. The two normally closed contacts in the left-hand leg give some protection against welding or sticking of a contactor. A firm fault with one contactor hard welded will cause its normally closed contact to open, and the circuit will fail to start. The
circuit, though, is not ideal. For it to operate at all there must be an overlap between the normally open and normally closed contacts (i.e. a short region where both are made together). It is thus feasible for a contactor to fail with both normally open and normally closed contacts made. In addition overlapping contacts must be spring loaded in some way, which introduces additional hazardous failure modes. Although much better than the circuit in Figure 8.12(a) it still has hazards.
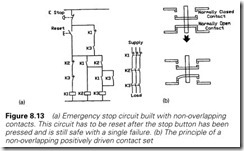
Safety can be improved further by using three contactors as in Figure 8.13(a) and positively driven contacts. These ideas have been traditionally used in traffic lights and railway signalling to ensure, for example, that two routes cannot be given a green ‘Go!’ signal at the same time. Positively driven contacts are constructed in such a way that both normally open and normally closed contacts are moved by the same mechanism and cannot both make at the same time even in the event of failure. The principle is shown in Figure 8.13(b).
In Figure 8.13(a), three contactors are used in series. One, K1, uses normally closed contacts and the others normally open contacts. For normal operation, therefore, K1 must be de-energized and K2/K3 ener- gized. When first powered up, or when the emergency stop has been pressed and released, all contactors are de-energized. When the reset button is pressed, K1 will first energize provided K2 and K3 have not stuck (positively driven contacts remember). Contacts from K1 then bring in K2 and K3 which de-energize K1 but hold themselves in via their own contacts.
A single failure of any contactor will cause the circuit to fail or prevent it from starting. It is still, however, vulnerable to simultaneous
welding of K2 and K3, but the probability of this is usually thought to be acceptably low.
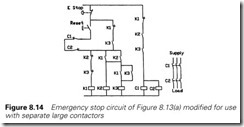
Figure 8.13(a) is acceptable for small loads of a few kilowatts, but is a bit impractical (and expensive) for large loads. In Figure 8.14 the safety circuit is constructed from low-power positively driven relays, which then control two redundant contactors C1 and C2. The (positively driven) auxiliary contacts of these contactors are connected in series with the reset pushbutton. Failure of a contactor in an unsafe mode thus prevents a restart and, like Figure 8.13(a), the circuit can only be started with both contactors in a healthy condition. Also like Figure 8.13(a) there is a residual risk of both contactors failing in a made state whilst running.
The arrangement of Figures 8.13(a) and 8.14 is commonly used and is available as a pre-made safety relay from many control gear manu- facturers.
Although the residual risk in these circuits is very low, it may not be acceptable in some circumstances. In particular, the circuit relies on a single contact in the emergency stop itself, and it is possible for a cable fault to bridge out the pushbutton contact (a severed cable will, of course, cause the safety relay to stop the plant). If a risk assessment of the application demands a lower residual risk (often when flexible cable is used to the stop button), two contacts may be used on each pushbutton, with one switching the supply voltage to the safety relay and one the return as in Figure 8.15. If a four core cable is used to link the button, there is a very high probability that any cable fault will either de-energize the safety relay or cause the circuit protection fuse or breaker to open.
Emergency stop circuits need regular maintenance and testing. The author has seen buttons in a dusty and humid atmosphere build up an
almost concrete ring under the mushroom head which prevented the button operating even when hit with a hammer! Regular inspection and testing will prevent similar problems. Remember that inspection and maintenance of safety equipment is a legal requirement under most safety legislation.
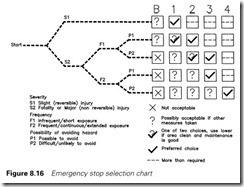
Section 8.2.2 introduced the idea of Risk Assessment. European Standard prEN954-1 gives a risk assessment chart (shown in Figure 8.16) for fail-safe control equipment (which includes emergency stops and movable guards). This results in the following categories:
· Category B Minimum standards to meet operational requirements of the plant with factors such as consideration of humidity, tempera- ture and vibration.
· Category 1 As ‘B’ but safety systems must use ‘well-tried’ principles and components. Sole reliance on electronic or programmable systems at this level is not permitted.
· Category 2 As ‘B’ but the machine must be inhibited from starting if
a safety system fault is detected on starting. Single channel actuation (i.e. emergency stop buttons or gate limit switches) is permitted providing there is a well-defined regular manual testing procedure.
· Category 3 As ‘B’ but any fault in the safety system must not lead to
the loss of the safety function and, where possible, the fault should be identified. This implies redundancy and dual channel switches as Figure 8.15.
· Category 4 As ‘B’ any single fault must be detected, and any three
simultaneous faults shall not lead to the loss of the safety function.
The previous section discussed the safety aspects of PLCs and com- puters. In all bar the most complex system it is not financially viable to use the redundancy techniques needed to achieve adequate safety levels from a purely software/electronic emergency stop system. The best system is to have a hardwired safety system which acts in series between the PLC outputs and the actuators (contactors, valves or whatever). A contact should also be taken as an input to the PLC to say the safety system has operated (in practice, of course, an input is given which says the safety system has not operated so a fault or loss of supply causes motion to cease). This input will, via the program, cause the output to turn off so the system needs some manual action beyond the removal of the emergency signal to restart.
Where several devices are to be turned off together in an emergency (e.g. several solenoid valves), the emergency stop contacts can remove the supply to the relevant output cards as shown earlier in Figure 8.5.
One final comment is that an effective guarding system can reduce the requirements of the emergency stop system by reducing the exposure (i.e. the system will be inoperative whenever people are at risk). This is discussed in the following section.
Guarding
One very effective method of reducing risk is to restrict access to dangerous parts of a machine or process by fixed or movable guards. Fixed guards are simple to design, but movable guards, often required where access is required for production or maintenance, need careful design.
Movable guards must provide two safety functions. Firstly, they must ensure the machine cannot operate when the guards are open. Secondly, if the machine or plant has an extended stopping time, the
guards must be locked in some way until the machine has come to a standstill.
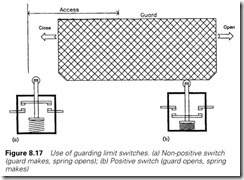
The intuitive, but incorrect, method of ensuring machine isolation when a guard is open is to use a limit switch which makes when the guard is closed as shown on Figure 8.17(a). This has two potentially dangerous shortcomings. In this arrangement (called negative or non-positive operation) the switch is closed by the guard and opened by a spring. Failure of this spring may result in the contacts still being made when the guard is open. In addition the switch is accessible when the guard is open and can easily be ‘frigged’ by the operators to bypass the safety feature.
In Figure 8.17(b) the guard itself pushes open the switch on opening, and a spring is used to make the switch when the guard recloses. Failure of the spring thus prevents the machine from operating. If the contacts weld, either the guard cannot be opened, or the opening action will break the weld or switch. With the switch being pushed down by the guard and raised for operation it is very difficult to bypass. This is called positive operation. A very low residual risk is obtained if the guard is equipped with both types of switch.
Photocell beams are another possible solution to guarding. These should be self-checking systems designed for safety applications, not simple photocell sensors. Care must be taken in the mounting to ensure the beam cannot be bypassed by going over or under, and the operator
cannot pass totally through the beam and out the other side. Pressure mats may also be used but again the design needs some care.
In applications such as shears and presses, dual two-handed push- buttons offer good protection. The use of these builds on the relay circuits described above, and specialist dual control relays can be purchased. It should, though, be noted that dual pushbutton systems only protect the operator and not other people.
Maintenance and repair usually requires access to parts of the process barred to operators. This puts maintenance staff at higher risk from trapping, entanglement and crushing. Often the only way to achieve an acceptable residual risk is a full isolation and Permit to Work system with removal of energy at pre-determined points such as motor control centres, hydraulic accumulators, air lines, etc. The removal of energy should be tested, then the isolation points locked, isolation boards applied and the written permit issued. Only then can work commence. For smaller/shorter jobs with low risk, the risk assessment may show that a local removable safety key system may be acceptable. Note that a risk assessment should be done for each possible maintenance job.
Safety legislation
There is a vast amount of legislation covering health and safety, and a list is given below of those which are commonly encountered in indus- try. It is by no means complete, and a fuller description of this, and other, legislation is given in the third edition of the author’s Industrial Control Handbook. An even more detailed study can be found in Safety at Work by John Ridley, both books published by Butterworth-Heinemann.
Health and Safety at Work Act 1974 (the prime UK legislation)
The following six regulations are based on EEC directives and are known collectively as ‘the six pack’:
Management of Health and Safety at Work Regulations 1992 Provision and Use of Work Equipment Regulations 1992 (PUWER) Manual Handling Regulations 1992
Workplace Health, Safety and Welfare Regulations 1992 Personal Protective Equipment Regulations 1992 Display Screen Equipment Regulations 1992
Reporting of Injuries, Diseases and Dangerous Occurrences Regulations (RIDDOR) 1995
Construction (Design and Management) Regulations (CDM) 1994 Electricity at Work Regulations (1990)
Control of Substances Hazardous to Health (COSHH) 1989 Noise at Work Regulations 1989
Ionizing Radiation Regulations 1985 Safety Signs and Signals Regulations 1996
Highly Flammable Liquids and Liquefied Petroleum Gas Regulations Fire Precautions Act 1971
Safety Representative and Safety Committee Regulations 1977 Health and Safety Consultation with Employees Regulations 1996 Health and Safety (First Aid) Regulations 1981
Pressure Systems and Transportable Gas Containers Regulations 1989.
IEC 61508
IEC61508 is the International Electrochemical Committee Standard on electrical, electronic and programmable (E/E/PE) safety systems. Like all modern safety concepts it is based on the idea of risk assessment and the implementation of measures to reduce the risk to an acceptable level. It is a complex document and this section can only give a brief introduc- tion to the basic ideas. The reader is strongly advised to study the full standard or take professional advice before designing any system where safety will be an issue.
Because it is an international standard rather than a UK or European directive compliance is not mandatory, however the Health and Safety Executive’s official view is ‘IEC61508 will be used as a reference standard in determining whether a reasonably practical level of safety has been achieved when E/E/PE systems are used to carry out safety functions’.
There are several terms in IEC61508 which carry specific meaning:
Hazard is the potential for causing harm to people or the environment.
Risk is a combination of the probability of the hazard and the severity of the result:
Risk = probability ´ consequence
You can reduce the risk by reducing the probability or the consequence. For example, with motor cars, imposing speed limits reduces both the probability of an accident and also the likely consequences. A cycle rider wearing a helmet reduces the concequences of an accident.
Equipment under Control (or EUC) is the plant under consideration.
It consists of sensors, a logic control system and actuators.
Functional Safety relies on the correct operation of safety functions when required. Safety functions are the parts of the plant which provide safety such as flow sensors, pressure relief valves, safety gates, emergency stop buttons, pull wires, etc.
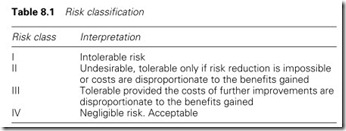
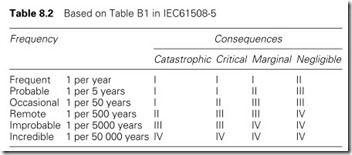
IEC 61508 defines the four levels of risk classification given in Table 8.1. The level of accepted risks varies surprisingly from industry to industry,
but IEC61508 suggests the risk classifications in Table 8.2 are typical.
Catastrophic is more than one death.
Critical is one death or one or more serious injuries. Marginal is one or more minor injuries.
Negligible is a trivial injury or plant damage and resultant loss of production.
A hazardous plant can be represented by Figure 8.18. The probability and consequence of each hazard gives a risk. This can be reduced by a combination of external risk reduction facilities (e.g. enclosures), other systems (e.g. personal protective equipment) and in the centre the E/E/PE safety system itself. The combination of these three measures gives the necessary risk reduction to produce a tolerable risk.
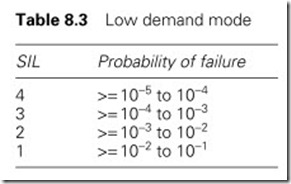
Risk reduction is described in terms of Safety Integrity Levels or SILs. There are two groups of SIL. The first, called a Low Demand Mode of Operation will only be required to operate very rarely (if at all). A typical example is a car air bag which is a complex safety function designed to reduce the probability of injury to the occupants of a car in the event of an accident. Here the SIL is determined by the probability of failure to perform its design function on demand as shown on Table 8.3.
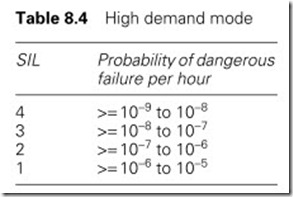
The second, called High Demand Mode or Continuous Mode is concerned with a safety function that monitors the EUC continuously. A typical example would be the drum water level system in a high pres- sure boiler. Here the SIL is the probability of dangerous failure per hour as defined in Table 8.4.
The study of Figure 8.18 will show the SIL level required. Note that a complete study is required with investigation of all failure modes of the safety functions. It is not just a case of obtaining the failure rate of a sensor and valve.
Suppose we have done a risk assessment and identified a risk frequency of once per year with a consequence of one injury. Table 8.2 gives this a risk classification of I. We need to reduce this from class I to class III which means we need to reduce the risk frequency to approximately 1 per 5000 years. This implies a Risk Reduction Factor (RRF) of 5000.
The plant designers, though, can provide a risk reduction factor of 15 by improved mechanical design. The demand on the E/E/PE safety
system now becomes a RRF of 333 giving a required probability of failure on demand of 3 ´ 10-2 . From Table 8.3 this gives an aim integ- rity level of SIL-2 for our E/E/PE safety system.
The Heath and Safety Executive publish an excellent book called ‘Out of Control’, ISBN 0-7176-0847-6 which every PLC user should read. Part of this book analyses the major causes of control related accidents and comes up with the following worrying statistics:
44% caused by bad or incomplete specification 15% caused by design errors
6% introduced during installation and commissioning 14% occur during operation and maintenance
21% caused by ill thought out modifications
In other words, the commonest cause of accidents were flaws in the original specification where the need for a safety function was not recognized or was badly described.
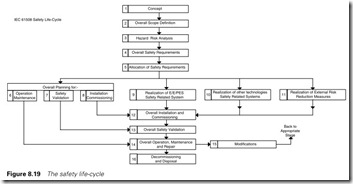
IEC61508 therefore lays down the safety life-cycle shown on Figure 8.19. Each stage produces output documentation which is the input for the following stages. This documentation should be available at all times. The sixteen stages are:
Stage 1 Concept. An understanding of the EUC and its environment is developed along with relevant legislation.
Stage 2. Overall Scope Definition. Define the boundaries of the EUC and its control system in all modes of operation (e.g. start up, normal oper- ation, etc.). Specify the scope of the hazard and risk analysis.
Stage 3. Hazard and Risk Analysis. This should be done for all modes of operation and all reasonably foreseeable conditions including faults and operator errors.
Stage 4. Overall Safety Requirements. Develop the specification for the over- all safety function requirements.
Stage 5. Safety Requirement Allocation. Determination of how a safety function is to be achieved and allocate a SIL to each safety function.
Stage 6. Overall Operation and Maintenance Planning. Developing a plan of for operating and maintaining the E/E/PE safety related systems so the safety system operates correctly.
Stage 7. Overall Safety Validation Planning. Developing a plan for validating the safety system.
Stage 8. Overall Installation and Commissioning. Developing a plan to ensure the safety system is correctly installed and operational.
Stage 9. E/E/PE Safety System Realization. Create the E/E/PE safety system that conforms to the safety requirements specification.
Stage 10. Realization of safety systems implemented in other technologies. Creation of non P/E/PE safety systems. This stage is not part of IEC61508.
Stage 11. Other Risk Reduction Factors. Again not part of IEC61508.
Stage 12. Overall Installation and Commissioning. Based on the plans from Stage 8.
Stage 13. Overall Safety Validation. Based on the plans from Stage 7.
Stage 14. Overall Operation, Maintenance and Repair. This covers the majority of the plant life. The safety systems should be operated, maintained and repaired in such a way that their integrity is ensured. This will be based on the plans from Stage 6.
Stage 15. Overall Modification and Retrofit. Plant modifications and changes are a very dangerous operation, see the earlier HSE study in Out of Control. Flixborough and Chernobyl originated because of poorly thought out maintenance work. If any maintenance work or plant changes have safety implications the safety life-cycle procedure should be repeated.
Stage 16. De-commissioning. Ensuring that the functional safety of the E/E/PE safety related system is appropriate for the final shut down and disposal of the EUC.
IEC61508 also imposes some system architectural constraints. The most important of these is that the safety system and the control system should be separate. This is normal in most PLC based systems where safety devices such as Emergency Stops or guards operate directly into the actuators. It can, though, be more difficult in a complex petro-chemical plant where a controlled shutdown sequence is required.
Another important architectural constraint is the failure mode of devices and the probability of ‘safe failure’ must be considered. For a cooling water modulating valve a safe failure is a failure to close. For a fuel control valve a safe failure is a failure to open. Tables in IEC61508 relate the required SIL and the probability of safe failure to the required level of redundancy. For example, with a required level of SIL-2 and a probability of safe failure of less than 0.6 for a safety related actuator, dual redundancy is mandatory even if the calculated SIL is adequate.
IEC61508 also emphasizes the need for quality in the design procedure and quality of the component parts. Needless to say the people concerned should be knowledgeable and competent.
Design criteria
In Chapter 3 the problems of defining what functions a PLC system is to perform were discussed. In this section we will consider similar points that have to be established for the PLC hardware.
The first (and possibly most important) of these is to establish the amount of I/O (how many digital inputs, how many digital outputs, etc.) and from this determine how many cards are needed. This can be sur- prisingly difficult, as it depends very much on the user’s requirements.
Consider, for example, a simple hydraulic pump started and stopped from a main control desk. At the simplest level this requires one PLC input (the desk run switch) and one output (the pump contactor). With pushbuttons, desk lamps and useful diagnostics this could rise to eight inputs (start PB, stop PB, contactor auxiliary, trip healthy, emergency stop healthy, local isolator healthy, MCC on, hydraulic pressure switch and five outputs (the pump contactor plus indicators for running, stopped, tripped, fault, not available). The designer needs to know the point between these two extremes that the user expects. I much prefer to connect to everything that is available and then decide later whether it is to be used. Adding ‘forgets’ in later is messy and expensive. (‘We’ve just decided it would be useful to know when a motor is tripped’ says the user. ‘There are 47 motors, no spare contacts on the overload relays in the MCC and no spare I/O in the PLC, and we want to start testing tomorrow.’) Avoid problems like this.
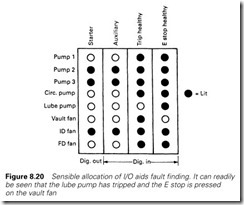
The I/O is not simply the number of signals divided by the number of channels per card. It helps maintenance to group functions by card; Figure 8.20 shows a typical example. PLC cards have LEDs showing signal status and with sensible I/O allocation readily identifiable ‘patterns’ can be established which assist fault finding.
This functional grouping also generates useful spare I/O. A PLC system should never be built without spare I/O (and never installed without the ability to expand). If the project is well documented and the user trusted implicitly, 10% installed spare I/O may be feasible. If there is no real written specification, 50% installed spare I/O is not unreason- able. Inputs and indicator lamps have a tendency to appear magically from out of nowhere, so be prepared.
Cabling is a major capital cost, and can be significantly reduced by the use of remote I/O which is connected via simple coaxial or twin- axial cable. The geography of the plant should be studied to establish where I/O can be clustered to minimize cabling. Desks, for example, can often be built with integral I/O cards only connecting to the outside world via the remote I/O cable, a power supply and a few hardwire signals such as emergency stop buttons. Such an approach allows useful offsite testing before installation.
Constructional notes
Power supplies
A PLC system obviously requires a power supply to operate. This will usually be a low voltage; 110 V AC is probably the commonest in industry. If at all possible, an entire system should be fed from one common supply. If separate supplies are used, any noise spikes on one supply can cause momentary loss of communication between different parts of the system and result in mysterious shutdowns. With a common supply, all component parts experience the same effects and are more tolerant of noise.
In each cubicle, a power supply distribution system similar to Figure 8.21 will be needed. It can be seen that this feeds several different areas, each requiring breakers, or fuses, for protection.
The PLC racks and processors obviously need a supply, and this should be clean and free of noise to prevent unexplained trips. Until recently, it was common practice to use constant-voltage transformers (CVTs) to give a smooth clean supply for the PLC power supplies. These act as a block to high-frequency noise on the supply. Unfortu- nately they also block high-frequency loads from the supply, and can give some very odd results with switched-mode power supplies. If the PLC is to work off a potentially noise-prone supply (on a 110-V supply derived direct from the bars of an MCC, for example) CVTs should be considered. CVTs have a very high inrush current, which results in higher rated upstream protection and cables than might be first thought. In-line filters are also useful, but these also are prone to odd effects with switched-mode power supplies.
In Figure 8.21 a single emergency stop relay has been used. This removes all power to output cards in slot 0 and disables one output in slot 1. If this latter arrangement is used, snubbers should be put across the load and/or the contact to reduce the inductive voltage spike as the contact opens. This voltage spike can be a major source of electrical interference and can even cause damage to the PLC output transistors or triacs.
It is good practice to have independent protection for each output card as shown. This limits the affected area in the event of any external fault, and aids fault finding by locating the problem to outputs connected to one card. Usually PLC output cards have their own internal protection, often at the level of one fuse per output (with a common fuse blown indicator). Often each output supply is fed back as an input to allow the PLC to check the supply state and give an alarm when a blown fuse or tripped breaker occurs.
With inputs there are two possible protection methods. In the first all inputs for one card are fed from the same breaker. This means that a card can be isolated at one point (but has the disadvantage that several different supplies may exist inside a desk or junction box). With the second approach, every point at one location is fed from a common supply. This has only one supply at a location (allowing isolation of several limit switches at one breaker) but means that a single card is fed from many different supplies. The author prefers the second scheme but this is only a personal opinion.
During commissioning, maintenance and fault finding, it is often use- ful to be able to shut down outputs or inputs whilst leaving the system running. Switches, breakers or fuses on Figure 8.21 allow this isolation to be performed.
A cubicle often contains non-PLC devices, 24-V power supplies, instruments and chart recorders. These also need individual protection. Finally we have two often-overlooked essential supplies. Cubicle lighting and sockets for the programming terminal and tools such as a soldering iron can aid commissioning and fault finding. The author always includes a standard 15-A and 5-A 110-V socket in every cubicle.
It would obviously not be desirable to have the whole PLC system shut down by a simple fault like a stuck AC solenoid (which produces a high current) tripping the main breaker. A hierarchy such as that of Figure 8.21 needs discrimination between the various protection devices to ensure that a breaker trips or a fuse blows at only the lowest level. This is a complex subject, but as a rough rule the rating of the protection should be between five and ten times the rating of the protection at the next lowest level. Remember that the protection is for the cable, not the device it is connected to.
A supply hierarchy needs sensible labelling. The author uses a scheme with each level adding a one-digit suffix:
In this way the origin and route of any supply in the system can be quickly determined.
One common source of trouble is centre-tapped supplies (55/0/55 is often used). Although these reduce the voltage from any point to earth, they complicate fault finding and can bring increased danger if not properly installed. Protection in each leg (two pole breakers or two fuses), is needed, not just in the supply line. The author once nearly burnt out a cubicle which was connected to a 55/0/55 supply via a single pole breaker.
The relative merits of fuses and breakers are often discussed. Certainly DIN rail-mounted breakers simplify fault finding and maintenance, and a fault does not necessitate a trip to the stores to get a pocketful of fuses. If fuses are used, indicating holders should be used to allow a blown fuse to be quickly located. Standardization of fuse dimension in a par- ticular area should be specified. There are few things more annoying than a cubicle equipped with different lengths of fuse in what appear to be identical holders.
Earthing is important for safety and reliable operation. There are many separate earths, typically:
(a) safety earths for cubicle, desks and junction box frames
(b) dirty earths for antisocial high current loads such as inductive relay and solenoid coils
(c) clean earths for low current signals
These should meet at one, and only one, common earth point to prevent earth loops (the connection of the screens on analog cables was discussed in Section 4.12). Where items such as PLC racks are mounted on the backplane of a cubicle, earthing via the mounting screws should not be assumed, and earth links should be added.
All supply wiring should be installed to local standards. In the United Kingdom these are the wiring regulations of the Institute of Electrical Engineers (IEE). This is currently at the 16th Edition.
Equipment protection
The designer must build the PLC and its associated equipment into a plant. To achieve this, cubicles, junction boxes and cabling are needed.
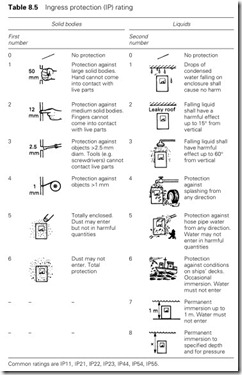
The cubicles serve to protect the PLC from the environment (notably dust and moisture), to deter unskilled tampering and separate dangerous voltages from production staff. The protection given by an enclosure is given by its IP number (for ingress protection). This is a two-digit number; the first digit refers to protection against solid objects, and the second to protection against liquids. The higher the number, the better the protection, as summarized in Table 8.5. Some IP numbers have commonly used names, but these have no official standing:
IP22 Drip-proof IP54 Dust-proof IP55 Weatherproof IP57 Watertight
Most industrial applications require IP55, even if used indoors (but it should be remembered that IP55 is only IP55 with the door closed).
High ambient temperatures can often be a problem, and it is always wise to check what dissipation is expected inside a cubicle. Manufacturers give figures for their PLC equipment (these are generally low) but devices such as transformers (particularly CVTs) can generate a fair amount of heat.
For a standard cubicle, 5 W per m2 of free cubicle surface will produce a temperature rise of 1 °C. For example, 400 W dissipation in a cubicle of 5 m2 free surface area will give a temperature rise of about 16 °C inside the cubicle. The base and any sides in close proximity to walls should be ignored in calculating the free area.
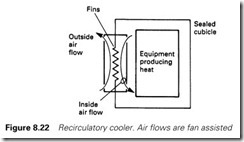
If the elevation from this calculation above the expected highest ambient exceeds the manufacturer’s maximum temperature specifica- tion (usually around 60 °C), cooling will be needed (or a larger cubicle). Recirculatory coolers as in Figure 8.22 allow around 100 W for a 1 °C rise per m2 of free surface. In extreme cases, refrigeration can be used.
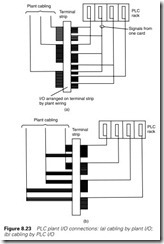
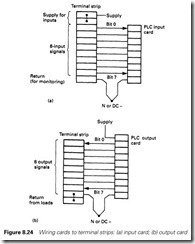
In either case, an overtemperature alarm should be fitted for protection. Heat-sensitive paints or stickers are also useful for monitoring temperature. There are two ways in which terminal strips can be laid out. In Figure 8.23(a), the terminal strip has been grouped by plant side cabling (with unused I/O being placed together at the end of the terminal strip). In Figure 8.23(b), the grouping is by PLC I/O, which leads to splits in the
plant cabling. Of these, the author much prefers the second arrangement. To achieve the first successfully, all plant I/O and cabling must be known exactly before construction starts, and any (inevitable) late changes will split the external cables anyway. With Figure 8.23(b), construction can start once the quantity of I/O is known (without knowing its allocation) and the arrangement is clear and self-explanatory. For later modifications, unused I/O is clearly visible. Whichever scheme is used, all installed I/O should be brought out to the terminal strip whether it is used or not; 2.5-mm2 cable added to a card by a shift electrician at 3 a.m. looks distinctly unsightly in comparison to 0.5-mm2 looms installed by a panelbuilder.
The supply requirements of the outside plant should be provided at the terminal strip. Figure 8.24 shows recommended arrangements for an 8-bit output and 8-bit input card. This is straightforward; the only point requiring comment is the neutral for the input card, which allows easy monitoring with a meter at a plant-mounted junction box.
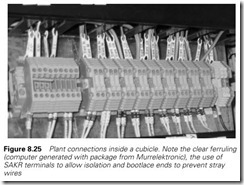
Terminals allowing local disconnection of a signal are very useful for commissioning and fault finding. The cubicle in Figure 8.25 uses Klippon SAKR disconnect terminals. These allow the cubicle to be powered up for initial testing with the plant totally disconnected, and then areas can be brought in step by step. A similar, but less controlled, approach is to drop all PLC I/O card arms off the card on first power-up and replace them one at a time.
Figure 8.25 also shows the importance of ferruling. This is essential both for installation and maintenance. All cable cores on a PLC-based system should be ferruled in a way that relates to the PLC addressing (so if you are working on a solenoid you can see immediately it is bit 05 of card 3 in rack 4). Typical ferrule systems are:
· 12413 input bit 13 of slot 4 in rack 2 on an Allen Bradley PLC5
· A02/12 input bit 12 of word 02 in a GEM-80
· Q63/6 output bit 6 in byte 63 in a Siemens S5
Ferruling is expensive; in the author’s experience it costs as much in labour to ferrule a multicore cable as it does to pull and install it. The costs can, however, be recovered at the first major fault. A recent devel- opment is computer-generated ferrules, also shown in Figure 8.25.
A useful, and for once inexpensive, aid is to colour-code cores inside a cubicle according to their function. An example is the following:
Supplies (AC and DC) Red
Returns (Neutral and DC –) Black
AC Outputs Orange
AC Inputs Yellow
DC Outputs Blue
DC Inputs and analogs White
Isolated outputs and non-PLC Violet
The colour coding helps cable location and gives a useful last-minute confirmation that a signal being added during later plant modifications are of the correct signal type for the card (connecting a 110-V AC supplied limit switch to an input card wired in the cubicle with white cores is wrong).
Terminals should have no more than two cores connected, and ideally two cores per terminal should only occur where a linking run is being formed. In a really perfect world, linking bars should be used. Cores
should have crimped ends (called bootlace ferrules) as in Figure 8.25 to prevent problems from splayed ends.
Maintenance and fault finding
Introduction
It is the designer’s duty to ensure that in all new plant:
1 There is at least one item which is experimental.
2 There is at least one item which is obsolete.
3 There is at least one item on six months delivery (and this is the one item which has not been placed on stores stock).
4 The drawings do not include site or commissioning modifications.
Perhaps not, there must be a better way.
When a project is completed, the plant becomes the responsibility of the maintenance staff, who always lead a difficult and unappreciated life. They do not really share in the glamour and glory of the new plant, and inevitably get blamed for all the designer’s mistakes that do not become apparent until the plant has been in production for a few months.
Production management view maintenance staff as a necessary, and expensive, evil and often express a plant goal of zero fault time. Absolute zero lost time is unachievable, but practically any desired finite level of
reliability can be achieved. Surprisingly, this may not be what is really required.
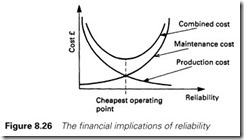
Low reliability is achieved at low cost, but brings high cost in lost production. As reliability increases, the maintenance costs increase but the production costs fall. Eventually a point is reached where an increase in reliability requires an increase in maintenance costs that exceeds the benefit in reduced production costs, giving curves similar to Figure 8.26. The ‘art’ of maintenance is to identify, and work at, the point of minimum cost.
This is assisted by designing a plant so it is, to some degree, failure tolerant. Most plants operate in some form of failure mode for a high percentage of the time. Good plant design considers the effect of failures, and provides methods to allow a plant to continue operating economically and safely whilst a fault is located and rectified.
Statistical representation of reliability
It is not possible to predict when any one item will fail, so statistical techniques are used to discuss reliability. The reliability of an item, or a complete system, is the probability (0 to 1) that it will perform correctly for a specified period of time. A PLC rack, for example, may have a 0.98 probability of running two years without failure.
Reliability measurements are based on a large number of items. If N items are run in a test period, and at the end of the test Nf have failed, and Nr are still working, the reliability R is defined as
and the unreliability, Q , is defined as
Obviously Q + R = 1.
Reliability is expressed over a period of time (1000 hours, 1 year, 10 years or whatever). An alternative measure is to give an estimate of the expected life expectancy. This is given by the mean time to failure (MTTF) for non-repairable (replaceable) items like lamp bulbs, and mean time between failures (MTBF) for repairable items (or complete systems). Both of these are again the statistical result obtained from tests on a large number of items.
When equipment fails, it is important that it is returned to a working state as soon as possible. The term ‘maintainability’ describes the ease with which a faulty item of plant can be repaired, and is defined as the probability (0 to 1) that the plant can be returned to an operational state within a specified time.
Mean time to repair (MTTR) is another measure of maintainability, and is defined as the mean time to return a failed piece of equipment to a working state. Like MTTF and MTBF it is a statistical figure based on a large number of observations.
Maintainability is determined both by the designer and the user.
Important factors are as follows:
1 The designer should ensure that faults are immediately apparent, and can be quickly localized to a readily changeable item. This requires good documentation, sensible test points and modular construction. We will return to these points later.
2 Vulnerable components should be readily accessible. It is not good for maintainability if the maintenance electrician has to climb a 10-m ladder and remove a cover held in place with 16 screws to reset a tripped breaker.
3 The maintenance staff should be competent, well trained and equipped with suitable tools and test equipment. MTTR is obviously related to how long they take to respond to a fault.
4 Adequate spares should be quickly available. MTTR will be increased by laborious stores withdrawal procedures. MTTR is usually reduced if a policy of unit replacement rather than unit repair is adopted.
Of these, the designer has responsibility for points (1) and (2) with the user being responsible for points (3) and (4).
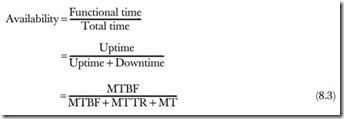
Plant availability is the percentage of the time that equipment is func- tional, i.e.
where MT is scheduled maintenance time.
If N components are in operation, and if Nf components fail over time
t, the failure rate l (also called the hazard rate) is defined as
(Strictly, Nf and T should be defined as incremental failures DNf over time DT as DT tends towards zero.)
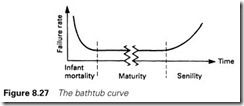
The failure rate for most systems follows the ‘bathtub curve’ of Figure 8.27. This has three distinct regions. The first, called ‘Burn in’ or ‘Infant mortality’, lasts a short time (usually weeks), and has a high failure rate as faulty components, bad soldering, loose connections, etc. become apparent. At the systems level the designer’s mistakes and software bugs will also be revealed.
During the centre ‘Maturity’ region a very low constant failure rate will be observed. In a well-designed system maturity normally lasts for years. The final period, called ‘Senility’, has a rising failure rate caused by structural old age; oxidizing connectors, electrolytic capacitors drying out, plugs losing the spring in their contacts, breaks in printed circuit board tracks caused by temperature cycling and so on. At this point replacement is normally advisable.
In the ‘Maturity’ stage, it can be shown that
depending on whether the item is repairable or replaceable, and the probability that an item will run without failure for time t (i.e. its reliability for time t) is:
If, for example, a system has a MTBF of 17 500 hours (about two years), the probability that it will run for 8750 hours (about one year) is
Maintenance philosophies
Even with the best-planned preventative maintenance procedures, faults will inevitably occur. There is a fundamental difference between a prob- lem on a complex PLC system and, say, a mechanical fault. In the latter case the fault is usually obvious, even to non-technical people, and the cause can be quickly identified. Usually mechanical problems take a long time to repair.
PLC-related problems tend to be more subtle, as far more components are involved. If some actuator does not move, it could be a bug in the PLC program, the PLC itself, an output card fault, the output supply, the actuator or some related part of the sequencing; a limit switch per- mitting movement having failed, for example. Diagnosis can thus take some time, and whilst it is possible to find a fault eventually by random component changing, a logical fault-finding procedure will shorten the time taken to locate the fault. Once the cause is found, the repair is usu- ally quick and straightforward. Admittedly this broad view is difficult to maintain at 3 a.m. with the shift manager asking the three inevitable questions ‘Do you know what’s wrong?’, ‘Do you think you can fix it?’ and ‘How much longer is it going to take?’
The reliability of modern equipment creates problems for the main- tenance staff. With MTBFs measured in years it is likely that a technician will only encounter a piece of equipment for the first time when the first fault occurs (and the maintenance manuals and drawings have been lost or are gathering dust in the chief engineer’s bookcase). More reliable equipment also means that a technician can cover, and hence needs to know about, a much larger area of plant. Training is therefore essential, and we will shortly return to this subject.
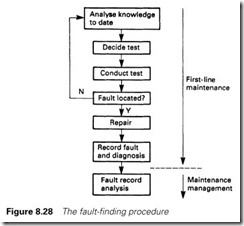
Fault finding can be split into first-line maintenance (repairs carried out on site, usually module or unit replacement) and second-line maintenance (repairs carried out to component level in a workshop). In either case it is a logical process which homes in on the fault as shown in Figure 8.28. Symptoms are studied and from these possible causes are identified. Tests are conducted to confirm or discount the possible causes. These tests give more information which allows the possible causes to be narrowed down until the fault is found.
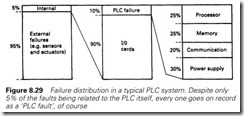
One of the arts of fault finding is balancing the probabilities of the various possible causes of a fault against the time, effort and equip- ment needed to perform the tests required to confirm or refute them. Figure 8.29 shows the probability of failure of the different parts of a typical PLC system, which, not surprisingly, shows that 95% of ‘PLC’ faults actually occur on the plant items such as actuators and limit switches. Good equipment design should provide diagnostic aids so that the most probable causes of faults can be checked out quickly without the
need of specialized test equipment.
The final stages of Figure 8.28 are concerned with maintenance management, and serve to analyse plant behaviour. Any shift-based technician will only see a quarter of the faults, but a common fault- recording system should reveal recurring failures or a need for training in specific areas.
Designing for faults
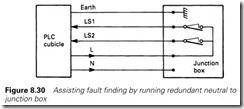
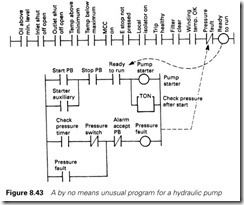
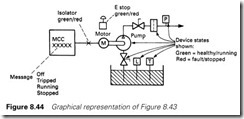
All equipment will fail, and the designer of a PLC system should build in methods to allow common faults to be diagnosed quickly. Simple ideas like running the neutral out to a junction box for test purposes as in Figure 8.30 can save precious minutes of time at the first fault. Other simple and cheap ideas are the use of isolating terminals (such as the Klippon SAKR shown earlier in Figure 8.25) and the provision of monitoring lamps on critical signals (particularly local to hydraulic and pneumatic solenoids).
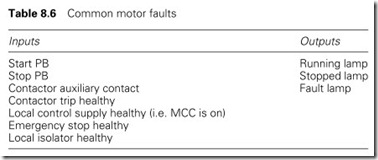
Consider a simple motor starter; at the simplest level this requires two inputs (start and stop buttons) and one output (the contactor) but in the event of a fault shift electricians will have to rely on their own judgement and ideas. With five additional inputs, and three outputs for lamps, much more information can be given and the MTTR reduced. Table 8.6 will cover all common motor faults.
To this should be added an ammeter to allow the motor current to be monitored (and compared against the normal current which all careful
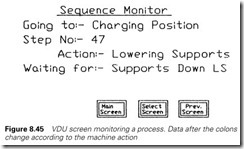
engineers record before the first fault). With the above list, the PLC can localize the fault and identify the possible cause through the program- ming terminal. With VDU screens, full operator messages can be given (‘Pump 1 cannot start because the local isolator is open’ or ‘Conveyor 1 stopped, PLC is energizing the contactor but the auxiliary contact has not made’).
Great judgement is needed with alarms, and an alarm should always mean something. Care should be taken with ideas like that in Figure 8.31 which are often used to check actions, typically an alarm condition being ‘If extend is called and LS2 does not make within 2.5 s signal Extend Fault’. These ideas can be very useful, but the alarm detection devices (LS1 and LS2 in Figure 8.31) need to be significantly more reliable than the device they are monitoring. If not, false alarms will result and the user’s confidence will be lost. There is little worse in maintenance than seeing a plant running with half a dozen alarm messages on the screen and the operator saying ‘Oh, ignore them, they’re always coming up’. If they are ignored, make them reliable or take them out.
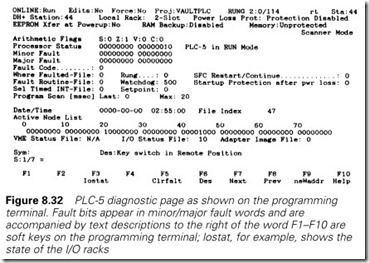
The PLCs themselves provide useful diagnostics of their own, and the plant’s performance. Figure 8.32 shows the processor diagnostic page for a PLC-5.
Documentation
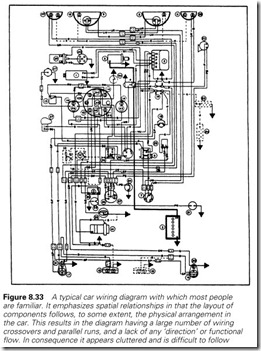
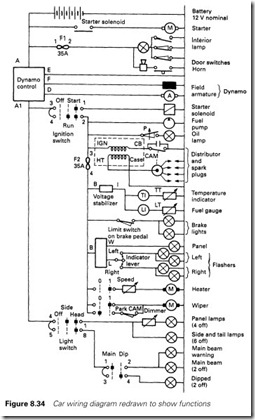
PLC systems tend to be both complex and reliable, two features that work against the maintenance staff, who do not have the chance to build up experience of common faults. The maintenance technicians will therefore have to rely on the documentation to help locate the fault. Figure 8.33 is a common drawing, familiar to most engineers, of a car wiring diagram. The drawing has been produced for constructional purposes and is of little use for fault finding. Redrawing it as Figure 8.34, with the drawing laid out by function not location, and a logical flow of signals from left to right, produces documentation which can be used for fault finding.
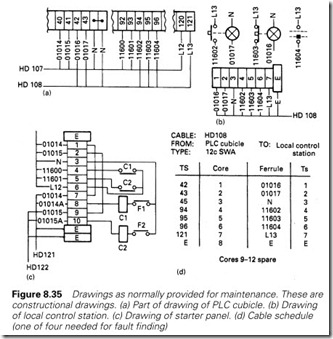
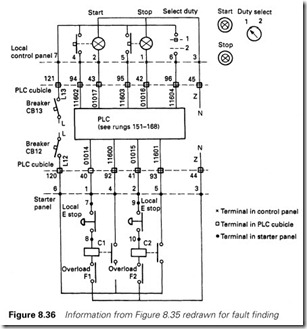
Figures 8.33 and 8.34 illustrate a common failing. There are two dis- tinct types of drawing. The first is produced by the designer to construct and interconnect the plant. These drawings are essential for the initial construction, but are of little subsequent use unless there is a major disas- ter (like a fire). These drawings tend to be of a locational nature or panel orientated as in Figure 8.35, which is an extract from the drawings of a typical PLC system. Often such drawings are all that is available, making fault finding a difficult task.
Fault finding requires drawings which group information by a function whilst retaining enough locational information to allow signals to be traced. Figure 8.36 shows the information in Figure 8.35 redrawn to assist fault finding.
Unfortunately designers and manufacturers often only provide con- structional and locational drawings, making the task of maintenance personnel more difficult than it need be. Ideally both types of drawing are needed.
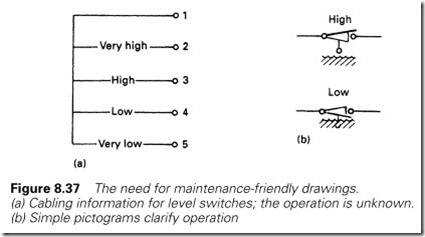
Drawings should also indicate the sense of signals. Given Figure 8.37(a) (which is based on a real manufacturer’s drawing of a hydraulic tank)
what would you expect to see for normal level (and in the absence of a neutral or DC – in the junction box, how would you check it)? Simple pictograms such as Figure 8.37(b) or pure text like ‘Contacts all made in normal operating condition. High level opens for rising level, low level opens for falling level’ can save precious minutes of time at the first fault.
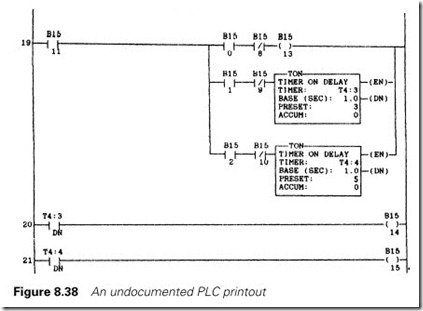
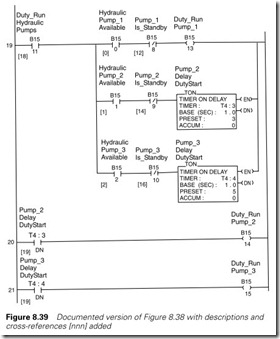
PLC programs can normally be documented, with descriptions attached to instructions and rungs/logic blocks. These are vital for easy fault finding. Figures 8.38 and 8.39 are the same part of a program in raw and documented form. The difference for ease of fault finding is obvious.
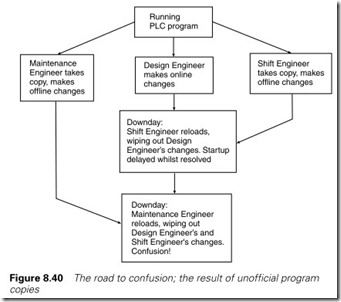
Most engineering organizations are fairly meticulous about keeping records of drawing revisions and dates of changes (e.g. drawing 702-146 is on issue E revision date 25/2/98). PLC programs are easy to change
on site, and most companies are very lax about keeping similar control of PLC programs. Figure 8.40 illustrates a common sequence of events. Such clashes can be difficult to resolve, particularly if the Maintenance, Shift and Design Engineers have used the same addresses for different functions.
Figure 8.40 arises out of ‘bottom drawer’ copies of PLC programs. These should be avoided at all costs. There should be a central store and records plus one (or one plus backup) for reload on site. There should be a recognized procedure for making changes, and a copy of the program taken before the changes are made so that there is a way of undoing the changes if there are unforeseen side effects. PLC programs should be treated as plant drawings and subject to the same type of drawing office control.
Training
Knowledge of a system is obviously required for fault finding. With any complex control system, this knowledge falls into two parts. First is familiarity with the equipment, the PLC, the thyristor drives, the sensors and actuators on the plant. Without this basic knowledge there is little hope of locating a fault. Most plants acknowledge the need for this type of training.
The second part is usually overlooked. It is necessary to appreciate how these various building blocks link together to produce a complete system. Too often the first-line maintenance engineer gets sent on a PLC course, a thyristor drive course and a hydraulics course, and is told ‘OK, you’re trained, now look after the Widget Firkilizing Plant’.
Such an approach has real dangers. When a fault occurs, maintenance technicians usually approach it in two stages. Initially, when first called, they are keen and eager to find the fault. If they do not succeed in a short time, they slip into the second stage where they are more concerned about
self-image and not looking a fool than in really finding the fault (and will stay in this mode of operation until the reinforcements arrive). It takes courage to say: ‘Sorry I’ve not got the vaguest idea, send for help’. If technicians working in this mode have just come back from a course on servicing the instrument air compressor they will automatically head for the nearest air compressor and service it.
Consider the following true story. Somewhat simplified in Figure 8.41, an item of plant has X and Y movements of an arm under control of a PLC. The vertical, Y, movement is driven by an electric motor with a non-reversible gearbox, and the horizontal movement by a hydraulic cylinder controlled by proportional valves. The X and Y movements (of around 750 mm) are measured by linear potentiometers. In the night, with the plant not in production, the night shift changed one of the vertical chains but did not check the action of the ultimate limits (linked to strikers on the chain wheels which rotate through about 300 degrees).
As part of its sequence, the PLC drives the arm to a fixed Y position then fully extends the cylinder. At the start of the next day’s production, the carriage moved in the Y axis until the (incorrectly aligned) ultimate
limit operated, then the system froze. The PLC had not achieved the Y position, so it did not operate the X cross-travel.
The operators summoned the maintenance crew, informing them that the X motion was not working (a misleading statement which was taken at face value). Fresh from a course on proportional valves, the crew started stripping down the X motion hydraulics.
The people concerned had been trained in the basics, and were not stupid or bloody minded. The incident raises several important points. When the fault occurred, there had been no training in the machine’s operation, so the steps of the sequence were not clear to the maintenance staff. Proportional hydraulic valves had been hammered into them, and this training had produced an attitude of ‘With all faults, it must be the proportional valves’. It is, perhaps, significant that at no stage did anyone use the programming terminal to look at what the PLC was trying to do, or even try operating the machine in manual. A related, but separate, issue was the fact that the fitter who changed the chain in the night did not realize that this action could affect the setting of the ultimate limits.
To some extent, this incident arose from job demarcation. The author’s plant is pioneering an electro mechanical production (EMP) worker who will cover all aspects of a job and avoid informational difficulties similar to that described above. This requires extensive training and involvement from all employees at all levels.
Other issues that the reader might like to consider are how the system designer can help avoid informational lapses like this. Note that there are space and financial limitations on how far you can go.
The important lesson, though, is that maintenance staff must know the plant, know its operation and be familiar with the documentation. With PLC-based systems, a talk through the PLC program is essential, drawing attention to what is needed for certain actions to take place. Knowledge of the plant is probably more important than knowledge of the internals of the PLC itself, as over 95% of the faults will occur outside the PLC cubicle (see earlier Figure 8.29).
Too often, the first time a maintenance crew sees a new plant properly is on the first fault (when the design team are off on the next job). The time to learn about a plant is when it is being built and when it is being tested and commissioned. All the problems, wrinkles and fixes will be learned then, and the location of all components fixed in the mind. It is an invaluable experience which cannot be repeated.
Fault-finding aids, EDDI and FlMs
The difficulty in the previous section could have been prevented by the addition of two indicator lamps driven by the program as shown in Figure 8.42. This raises the obvious question of how much diagnostic aid the PLC itself can give.
Certainly the PLC is capable of signalling any conditions of which it is aware (and the PLC of Figure 8.41 certainly knew what was going on). The difficulty comes with examples like Figure 8.43 which is a by no means exaggerated example for one hydraulic pump which has 12 conditions that can prevent it from starting. To cover these would require 12 lamps driven by 12 outputs and fed down 12 cores of expensive cable (and 12 indicator rungs compared to two actual plant rungs), all for one pump.
At the design stage there is a fine balance between annunciating every possible alarm, and annunciating none, with the split being made based on experience of likely faults. One could treat Figure 8.43 with two lamps saying ‘Available’ and ‘Start Inhibited’, leaving the faultfinding crew to find the detailed reason for ‘Start Inhibited’ either by the PLC programming terminal (which shows directly the cause) or via a check list (provided as part of the plant documentation) which can be followed on the indicators on the PLC input cards. For example:
If Pump start is inhibited, check the following inputs are healthy:
Tank Oil Low Level A3.2
Inlet Valve Open A3.3
Outlet Valve Open A5.1
etc.
There are more solutions when graphics-based workstations are used, and a graphic representation as in Figure 8.44 can be used to show the state of every signal the PLC uses in a relevant place. Significantly such displays take little or no PLC program with, say, the level indicator linked to the state of the level switch and displayed in green or red.
The graphical displays do, however, take time to build (the most valuable commodity of all).
Most PLCs allow the user to ‘force’ input and output signals to a required state with a programming terminal. A faulty limit switch, for example, can be forced on to allow a movement, or a motor started by forcing its output on despite the absence of permit signals.
This can be a very powerful aid in commissioning and testing, but can easily become a standard way of working. A plant running with forced PLC signals can behave in a mystifying way if the initiator is not fully aware of what is being done and the possible consequences. It is very easy to trigger some unexpected sequence of events by forcing a limit switch or output signal to overcome some minor fault. Care and thought are needed if forces are to be used safely and sensibly, and forces should only be left for a short period of time.
A plant should not rely on forces for normal working (if it does, the plant is being operated in a risky state, or the original signals were not needed and should be removed).
Sequences (state diagrams, see Section 2.9.2) can cause major fault- finding problems. With workstations, again, very useful displays such as Figure 8.45 can be provided, showing what the machine is doing and what transitional signals it is waiting for.
The Ford Motor Company (a prolific user of PLCs) has defined a standard way of programming sequences. It is known as Error Detection and Diagnostic Indication (EDDI), and is a concept that covers not just maintenance fault-finding display, but the whole way in which the program is laid out, written and documented. It aims to have the same maintenance team interface regardless of which type of PLC is used.
In its simplest form, an EDDI system is built around a state-diagram- based sequence (see Section 2.9.2) with a maintenance display similar to Figure 8.46. The sequence is built up as matrix with the matrix row
being the step number, and the matrix column the conditions that have to be met to form a transition to the next step. The seven-segment display shows the current step number (or row) and the indicators the conditions which are yet unfulfilled. If the system freezes due to a faulty input the displays allow the fault to be quickly diagnosed.
There is much more to the EDDI philosophy, though. The standard- ization of how this is achieved, how the program is laid out and written, what documentation is needed and how this is provided means that staff can readily move between plants with little retraining. Standardization of methods is important for easy fault finding.
In the late 1960s the Royal Navy was concerned about the increasingly complex nature of ship-borne equipment and the related maintenance problems. A team at HMS Collingwood devised an approach called FIMS for Functionally Identified Maintenance System. This is diagnostic docu- mentation supplemented to the main constructional or functional drawings. It is based on functional modules or blocks whose inputs and outputs can be tested. These blocks are arranged in a hierarchy as summarized in Figure 8.47. Each block represents one drawing on which the location and state of test points can be found. Figure 8.48 shows part of a FIMs scheme for a thyristor drive. The technician follows the hierarchy of
Figure 8.47 down until a replaceable module or card is reached (denoted by a black marker in the corner of the block) or a simple circuit. A complex system is thus broken down into blocks on which fault finding can be carried out without prior experience of the plant.
FIMs is not cheap, but in the author’s experience it works well on complex plant. Its very nature imposes modular design at the early stages (always a good idea) and ensures that maintenance is thought out at the early stages. It can be difficult to apply to an already-built non-modular plant.
The HMS Collingwood team also devised the idea of the dependency chart, shown in Figure 8.49. This shows the relationship between actions, functions and event. The charts are used for fault finding by tracing
a signal back through the chart. Action d, for example, requires function Z, which in turn needs signals e, f and g.
A common fault finding aid is the flow chart of which Figure 8.50 is a common example. These are also known as symptom analysis charts, or algorithmically based diagnostic charts. Their deficiency is that they tend to only cover the simple obvious faults (that would have been found anyway) and ignore the troublesome subtle faults.
Electromagnetic compatibility (EMC) and CE marking
Electronic equipment is vulnerable to electrical interference. A badly sup- pressed motor car or poorly installed amateur radio transmitter, for example, will have noticeable effects on a domestic television receiver. Similar effects occur in industry, with power electronics systems or radio communi- cation systems affecting low power or digital electronic circuits. The results can be catastrophic; particularly with computer-based control systems.
As part of the drive towards harmonization of European standards to encourage trade across European frontiers, Directive 89/336/EEC (amended by 92/31/EEG) provides standards designed to ensure that equipment from different manufacturers may be used together without problems from electrical interference between them. To achieve this, the two aspects of Figure 8.51 must be defined.
All electrical equipment causes emissions (often called ‘noise’). These emissions can be high frequency (RFI, for radio frequency interference) or at harmonics of mains supply frequency. The latter usually occurs from power electronic systems such as thyristor drives. The noise can radiate through the air, or be conveyed along power or earth cables. Cable-borne noise can cause problems at several kilometres from the source. Equipment meeting the directive must keep its emissions below a defined level.
Immunity defines how susceptible equipment is to external noise from other equipment and the environment. Table 8.7 summarizes the possible effects. Both radiated and line-borne noise must be considered. Problems occur when one plant item’s emission level exceeds a local plant item’s immunity level. In the domestic case of an amateur radio transmitter causing television interference, the problem can be solved by reducing the emissions from the transmitter, or increasing the immunity of the television. The practical difficulty in industry is deciding which
route to take, and who is responsible.
The directive aims to solve this problem by defining acceptable emis- sion and immunity levels. With the defined emissions level below the defined immunity level of Figure 8.51 a safety margin is formed which ensures that problems should not arise. If there are noise effects the offending items should be easily identifiable.
There are three further immunity aspects. In dry weather, we often experience a short sharp electric shock on leaving a motor car. This is caused by the discharge of very high (several kV) electrostatic voltages attained by the car body, and insulated from earth by the rubber tyres. Similar effects can occur from clothing and carpets. The discharge to earth (called ESD for electrostatic discharge) can severely damage electronic equipment, particularly integrated circuits based on CMOS technology. When an electrical current passing through an inductive load is inter- rupted, the inductance (which tries to maintain the current) causes a large transient voltage to be produced. It is this effect which is largely responsible for the clicks and pops heard on telephone lines. In industry this noise is often caused by direct on line (DOL) starting and stopping of motors or the operation of hydraulic and pneumatic solenoids. The effects can be reduced to some extent by suppression of loads (a typical
method being shown in Figure 1.19) but it can never be totally eliminated.
Finally there are large voltage spikes conveyed along power or earth lines. These can result from lightning strikes onto power lines or from tap changers, switching of power factor correction equipment or just general load disturbances on the supply network. Direct on line (DOL) starting of large induction motors is a common source of voltage dips.
In each of the above cases the directive defines required levels of immunity.
The regulations concerning EMC are often confused with the related, but broader, topic of CE marking. One of the major barriers to trade is the different standards applied in different countries. This causes great difficulties for manufacturers who have to conform with many different standards making it impossible to make a standardized product. Many European standards (BSI, DIN, VDE, etc.) are being harmonized into a common European set of standards. (XX-ENnnnnn where XX is the national prefix, e.g. BS in the UK. The first one or two digits give an indication of its origin, e.g. 2 is based on ISO, 40 on CENELEC, 50 on CISPR, and 60 on IEC Provisional standards, out for comment, start prEN, and agreed, but not yet adopted, standards start ENV.)
Any product sold within the European Union must conform with any relevant standards. The CE mark is a manufacturer’s declaration that the product meets all the requirements of the relevant standards and directives. It is not a quality mark.
Although there are a range of standards and directives (CE marking is found on children’s toys, for example), industrial equipment will norm- ally require compliance with at least one of the following directives:
· LV Directive 73/23/EEC This states that electrical equipment shall not endanger the safety of persons, domestic animals or damage property.
· EMC Directive 89/336/EEC This is discussed above.
· Machinery Directive 89/392/EEC A machine (an assembly of linked parts or components joined together for a specific application) must satisfy the relevant essential health and safety requirements.
There are many people and organizations involved in the manufacture and use of an industrial machine or complete plant; equipment manu- facturers of components such as drives, PLCs or motors, panel builders, machine manufacturers, the installer and the end-users themselves. Each must take responsibility for their actions. For example, the manufacturer of a VF drive unit must provide CE marking for the LV directive, but not for the EMC directive as this is the responsibility of the panel builder or machine manufacturer who must follow correct installation methods for the drive, cabling and motor. Although it is possible, in theory, for a test house to perform relevant tests, it is usual for those responsible to self- certify and apply the CE mark. A technical construction file should be kept to justify the certification. Because it is a self-certification scheme it is likely that enforcement will be complaint driven.
Other programmable devices
Most modern devices such as control systems, sensors, drives and actu- ators are programmable. There are many advantages to this approach. For example where maybe ten different pressure transducers previously had to be held on stores stock, only one now needs to be held which can be set for the correct range at the time of installation.
Similarly a motor drive (AC VF or DC) which used to have maybe half a dozen trim potentiometers for acceleration, deceleration, maximum speed and current limit can now have several hundred user adjustable parameters including factors such as skip frequencies (to avoid resonant speeds) and various voltage to speed curves for fans, pumps, loads with high starting torque, etc.
Programmable devices bring many benefits but can also bring many problems if care is not taken with the documentation and support. If a flow transducer had to be changed twenty years ago the correct spare would be taken from the stores, the isolation valves closed and the transducer changed, a simple matter of two pipes and two terminals for the electrical signal.
With a programmable device there will be many additional steps. The range (engineering units, maximum and minimum) must be set along with output signal format (voltage, current, serial) filtering, linearization, highway address plus many more parameters. When using programmable devices, therefore the following points should always be considered.
Some method of setting or loading the many device parameters will be needed, either via dedicated front panel controls or via an external
programming terminal (often a portable computer). If this terminal has been lost, stolen (take particular care of notebook PCs), damaged or has a flat battery the repair staff have very real problems. Ensure that programming terminals are secure, well cared for and in good working order ready for use at all times. If possible have a spare programming terminal so you are not reliant on one device. Make sure that people know where the programming terminal is, and don’t leave it locked in a cupboard where only one person has the key.
The operation of the terminal may be obvious when it has been used several times during commissioning, but three years down the line when experience has vanished and the manual cannot be found it may take many hours to perform a simple device set-up. Try to produce an easily accessible ‘Idiots Guide’. The more powerful the programmable device, the more of a problem this can become.
If an external programming terminal is required, there will be a lead to link the terminal to the device. This will usually use some form of serial communication, often with simple D type connectors. If, however, the lead cannot be found at 3:00 a.m. and the manual showing the connections has been lost, the programming terminal and the program- mable device are worse than useless. Therefore:
Keep leads where they can be easily found. Have a home for each lead to which it can be returned after use.
Attach identifying labels so the correct lead can be found. Don’t purely go on simple descriptions such as ‘9 pin female to 25 pin male’, there is usually a lot more detail required. For example many simple 9 pin D type to 9 pin D type leads have pins 2 and 3 crossed, many don’t. Some link CTS/RTS, others use full hardwire handshaking. Leads may look identical to the eye but may not be interchangeable.
Ensure that drawings of the leads are available so that a new lead can be made if the original is lost or damaged. This problem is much more acute if the plugs on the lead are non-standard. As mentioned above common problems are the connections of pins 2 and 3 in a D type connec- tor and what internal links (e.g. CTS–RTS) are required inside the plugs at each end.
Take particular care of fibre optic leads; replacement is near impossible if these are lost or damaged in the middle of the night or at weekends.
Consider having at least two sets of leads. One for everyday use and one stored as a secure backup if the original has been damaged or cannot be found.
Produce documentation showing the parameters which differ from the default. These, in conjunction with the ‘Idiot’s Guide’, should be written to allow anyone with reasonable knowledge to bring the system back to working order.
Most companies are meticulous about keeping track of drawing mod- ifications (e.g. drawing 702-456 is on revision E dated 23rd November 2001). It is very easy to change the operation of a programmable device and there is usually no record kept of these changes. The earlier Figure 8.40 shows a typical sequence of events leading to a state of confusion in the early hours of the morning. Ensure all modifications are recorded in a log book and ensure some form of version control is enforced to ensure that up to date software and parameters are reloaded into a device if it has to be changed. Don’t keep these masters in the bottom drawer of someone’s desk, use a secure location (such as a fire safe) and keep adequate back-ups.
Think of the worst situation. The author has had the experience of having all the PCs on a SCADA network stolen (from locked control rooms) during a Christmas shutdown. Nominally each PC held the backups for the others, but with all PCs gone the first line back-ups had also gone! Fortunately this situation was saved by CDROMs in a fire safe. Have a plan as to how you can recover from your worst nightmare.
