Sample ladder logic
Introduction
This chapter contains ladder logic demonstrating real life applications and showing how common problems can be solved.
It would be confusing to jump around different PLCs in this chapter so all the examples have been written for the PLC5. They should, though, be easily adaptable to all PLCs with minimal change.
The PLC5 data table areas used in these examples are:
I:rs/bb Real input from bit bb on card in slot s of rack r (e.g. I:35/07) O:rs/bb Real output to bit bb on card in slot s of rack r (e.g. O:41/12)
Inputs and outputs can also be used as a 16 bit word in the form I:rs which is the 16 bit word from slot s in rack r (e.g. I:26) This is useful for obtaining data from decade switches for example.
Bf/b Bit storage. Bit b in Bit file f (e.g. B13/21)
Nf:n Integer word n in Integer file f (e.g. N27:5) An integer word can hold a number in the range -32,768 to 32,767
Ff:n Floating point number n in Float file f (e.g. F8:23). A floating point number has approximately seven significant figures and can be in the range 1.1754933E-38 to 3.4028237E + 38 (IEEE single pre- cision 32 bit numbers)
The PLC5 supports other data table types (e.g. ASCII text) but these are not used in these example.
The PLC5 uses the common ladder logic symbols:
–] [– is true when the signal is present
–]\[– is true when the signal is absent
–( )– is an output
–(L)– is a latched output, once set it remains made and can only be cleared by
–(U)– which unlatches (clears) the address
These can be used with real inputs and outputs or storage bits.
Timers have the form Tf:n where f is the file and n the timer number (e.g. T4:7). All the timers in these examples use a 0.01 s timebase, so a preset of 125 is 1.25 s. Timers can be a delay on (TON) or a delay off (TOF).
A MOV (for Move) instruction moves data from one location to another. In these examples it is usually used to turn a floating point number into an integer number before sending to an analog output card.
Basic arithmetic instructions are ADD, SUB, MUL, DIV. The numbers in the instruction can be any mix of floats and integers. Constants (fixed numbers) can also be used. If a MUL is used with two integer numbers to give an integer result, care must be taken to ensure an overspill does not occur. The DIV (divide) rounds to the nearest number if an integer result is used (e.g. 46 DIV 10 gives the result 5, 44 DIV 10 gives 4). This is discussed further in Section 9.12.
The PLC5 also has a Compute CPT instruction which allows a mathematical equation to be evaluated. This has been used in a few places to stop the ladder code becoming excessively long to the point of disguising the points being made. Any CPT instruction can be expanded into several individual ADD, SUB, MUL or DIV instructions.
Comparison instructions used are:
GRT Greater than
GEQ Greater than or equal to EQU Equal to
LEQ Less than or equal to LES Less than
The code used in the examples is deliberately ‘verbose’ so the steps can be clearly seen. This is not necessarily bad practice as good code should be easy to understand. Experienced PLC5 programmers will also note that I have constructed functions which are built into the PLC5 instruc- tion set (e.g. the –[ONS]– oneshot) but the aim is to show how functions can be achieved on less powerful PLCs.
One Shot
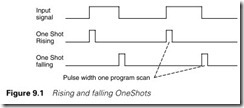
A One Shot generates a single scan pulse on a rising or falling edge as shown on Figure 9.1. Some PLCs, such as the PLC5, have this function as part of their basic instruction set. For those that don’t, however, a single scan pulse is easy to generate with just two rungs.
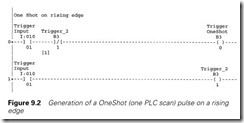
The rungs in Figure 9.2 show the basic idea. Trigger is the input signal. Trigger_2 in rung 1 is a copy of Trigger but this does not become true until rung 0 has been obeyed. Trigger OneShot is therefore true for the first scan after Trigger becomes true but is false thereafter.
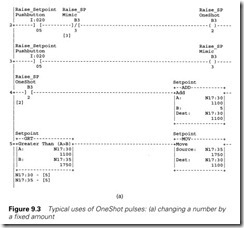
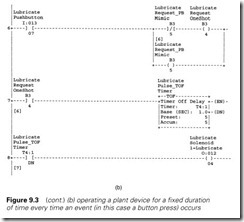
The rungs in Figure 9.3 show typical examples of the use of a one shot. In Figure 9.3(a) the Raise PB adds five to the setpoint each time it is pressed. In Figure 9.3(b) output Lubrication Solenoid is operated for exactly four seconds each time the Lubricate push-button is pressed. In both cases holding the button down has no further effect.
In Figure 9.3(b) a branch has been used to generate the one shot with just one rung.
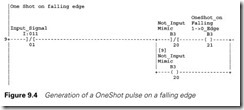
Changing the normally open contacts of Trigger to normally closed contacts as rungs 2 and 3 produces a one scan pulse on the falling edge of Trigger as shown on Figure 9.4.
Toggle action
A toggle action is used on many ball-point pens, the first press of the button extends the head, the next push retracts it. A single button can be used to start and stop a motor, press once to start, press again to stop, sometimes called ‘Push On/Push Off’. The action can be summarized by Figure 9.5.
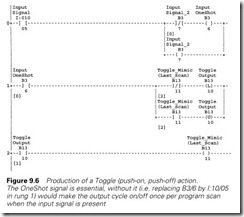
The toggle action is achieved with the three rungs in Figure 9.6. The first rung simply produces a One Shot on the rising edge of the input signal as described in Section 9.2. This rung can be omitted if a One Shot function is available.
The toggle itself is generated in rungs 1 and 2. There is a Toggle bit B13/10 and a Toggle Mimic B13/11. Note that, because the program scan goes from top to bottom, Toggle Mimic is updated after Toggle. Toggle Mimic therefore shows the state of Toggle on the previous scan.
If Toggle Mimic is false, i.e. Toggle was false last scan, the upper branch makes Toggle true. Similarly if Toggle Mimic is true, the lower branch makes
Toggle false. Toggle (and Toggle Mimic) thus change state for each rising edge of the Input signal.
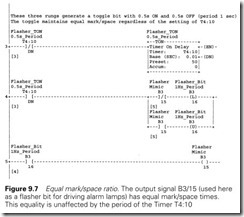
The toggle circuit can also be used to divide an input frequency by two as shown on Figure 9.7. The output pulse train will have an equal mark/space ratio.
Alarm annunciator
Most control systems will have an alarm annunciator of some type via which problems on the plant can be drawn to the operator’s attention. The general principles of alarm annunciators are discussed in Section 6.4, this section turns those ideas into PLC ladder logic.
The basic idea can be summarized on Figure 9.8. When an alarm occurs an indicator on a panel (or a screen) will flash showing a new alarm has occurred and requires acceptance. When the operator accepts the alarm, the indicator goes solid (if the alarm still exists) or goes out (if the alarm condition was transitory).
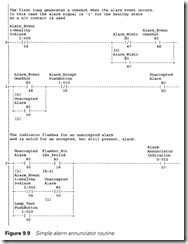
The ladder logic uses three rungs per alarm as shown on Figure 9.9. The alarm signal arrives via 1:00/14. Like most alarm signals this is
arranged fail-safe, i.e. it is ‘1’ for a healthy condition and ‘0’ for an alarm. The first rung generates a oneshot when the alarm occurs as described in Section 9.2.
Rung 1 uses the Alarm oneshot to generate the Unacknowledged alarm bit B3/50 which holds itself in until the alarm accept button I:00/00 is pressed. Unacknowledged Alarm bits from all the alarms on an annunciator can be ‘ORd’ together to sound an audible alarm or flash a beacon when an alarm occurs.
The final rung drives the alarm lamp or indication on a screen. If the unacknowledged alarm bit B3/50 is set the lamp will flash (the flasher bit B3/16 is generated in Figure 9.7). If the alarm is still present and the alarm has been accepted the second rung of the branch keeps the alarm lamp solidly lit. Note the bottom branch is a lamp test button I:10/02 to allow the annnunciator indication to be checked. Often the Alarm Accept PB and the Lamp Test button have the same address to force a lamp test each time an alarm occurs.
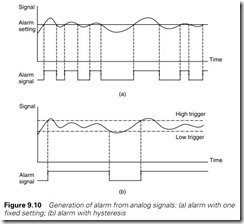
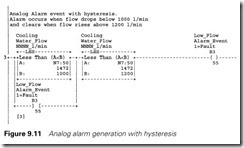
Alarms are often based on analog values, e.g. ‘Temperature in vessel 4 has risen too high’ or ‘Cooling water flow is low’. The alarm event bits are invariably generated by comparison rungs, but if a simple Pass/Fail test is used nuisance alarms will be generated as the signal wanders in and out of the alarm state as shown on Figure 9.10(a). A better solution is to have a hysteresis as shown on Figure 9.10(b) Here the signal has to go some distance from the alarm condition before the alarm bit resets. Figure 9.11 shows a single rung way of generating an alarm bit with hysteresis. N7:50 is the plant signal showing cooling water flow from an analog input card. The alarm bit is set if N7:50 goes below 1000 litres/min but will not clear until the value rises above 1200 litres/min.
First order filter
Analog signals invariably have noise superimposed on them, either from interference from other sources or because the signal itself is inherently noisy. Level signals, for example, are prone to noise from waves on the surface.
The simplest way to reduce the effects of noise is a simple first order filter. This can be represented as a mathematical equation:
This would be difficult to implement directly in a PLC, but a simpler version uses a sampled signal as shown in Figure 9.12. The (noisy) input signal is sampled at regular intervals Dt (typically 0.1 to 5 s
dependant on the application). The filtered signal is evaluated at each sample by the equation
Filtered_value = Filtered_value + Gain ´ (Raw_value – Filtered_value) (9.2)
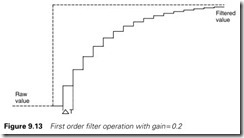
This gives a response as Figure 9.13 which approximates to a simple first order filter. As a rough approximation, the time constant is approx- imately Dt/Gain (e.g. for a step change in the raw input signal, a filter with a sample time of 0.5 s and a gain of 0.1 takes ten samples to achieve 66% of the final value, giving a time constant of approximately 5 s). Care must be taken with the choice of DT and Gain. Samples should be taken sufficiently often to keep up with changes in the input signal (typically Dt will be 0.1 to 5 s) and Gain chosen in the range
0.01 to 0.1. Having Dt too small will increase the computational loading on the PLC. Having a small value of Gain means the sample rate is too fast.
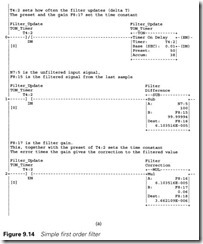
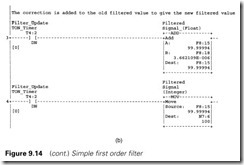
Equation (9.2) can be programmed by the five rungs of Figure 9.14. The raw signal from an analog input card appears in N7:5 and the filtered signal is given in N7:6.
Rung 0 is a free running timer used to obey the subsequent rungs for one scan every Preset seconds. It has been set to trigger every 0.5 s. In a real application one timer would probably feed several filters. Rung 1 calculates the difference between the raw and filtered value. Rung 2 multiplies the difference by the Gain to calculate what must be added to, or subtracted from, the filtered value. The correction is applied in Rung 3 and Rung 4 simply converts from floating point to integer representation. Note that rungs 2 and 3 must be performed in floating point numbers as the change in the filtered value may be very small.
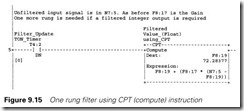
If a compute (CPT) instruction is available Rungs 1 to 3 inclusive can be performed with the single rung of Figure 9.15.
Double application of Figure 9.14 (or Figure 9.15) acts as an over- damped second order filter and can be used to apply a more severe filter.
Level control
The level of liquid in a tank must often be controlled. This is usually achieved by varying the speed of a pump by a variable speed drive, or opening/closing an inlet or drain valve. Usually the tank acts as a surge tank, and accurate control of level is not required. In reality all that is needed is some control to ensure the tank does not overflow or run dry. To maintain strict level control a PID controller must be used, but tuning an absolute level control can be difficult. Level is the integral of flow and the two integral terms (one from the PID controller and one from the flow to level) makes the loop inherently oscillatory. In addition,
all liquid surfaces have waves which make the level signal noisy.
A much simpler system directly relates the speed of the pump to the height of the liquid in the tank, the higher the level the faster the pump will run. At the maximum allowable height the pump will be going at full speed and provided the pump has been correctly sized there is no danger of overflowing or the pump running dry.
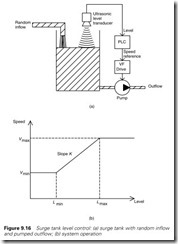
Figure 9.16(a) shows a typical example where a variable speed pump drains liquid from a sump. The liquid level is measured with an ultra- sonic transducer. Let Lmax be the highest level we can accept. At this level the pump must be going at full speed Vmax of, say 50.0 Hz. Let Lmin be the lowest level we can accept. At this level the pump must be going at near zero speed, say Vmin. In practice, the pump efficiency falls off as the square of the speed, so a typical value for Vmin would be 20.0 Hz.
We thus have a level range RL = (Lmax – Lmin)
and a speed range RV = (Vmax – Vmin)
giving a slope relating them K = RV/RL
These are shown on Figure 9.16(b).
At any level L, the speed V is then given by
V = K (L – Lmin) + Vmin (9.3)
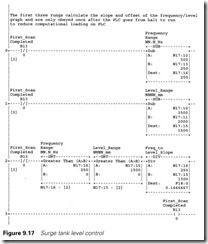
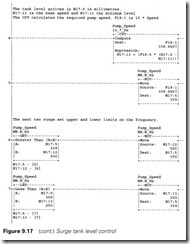
The ladder logic in Figure 9.17 achieves this. The level, from an analog input card, is given in engineering units in N17:0. The set-up constants for level Lmax (3500 mm), Lmin (2000 mm), and speed Vmax (500 = 50.0 Hz) and Vmin (250 = 25.0 Hz) are defined in N17:10 to N17:13.
The first three rungs evaluate RL, RV and the slope K. Note that a sensibility check is performed in rung 2. This checks that the ranges are
sensible and non-zero. The latter check is important to avoid a divide by zero error in the DIV instruction at the end of rung 2. The data used in these first three rungs will rarely, if ever, change. Mathematical instruc- tions are computationally time consuming, so B13/0 is used to ensure
rungs 0 to 2 are only obeyed once when the PLC goes from Halt to Run. B13/0 will not be energized on the first program scan so rungs 0 to 2 will be obeyed. B13/0 then becomes true and on subsequent scans rungs 0 to 2 will be skipped.
The compute CPT instruction in rung 4 evaluates equation (9.3). Without a CPT a subtraction (L – Lmin) a multiplication by K and an addition of Vmin would be required. Note that a floating point number must be used for intermediate results and the final result of the CPT.
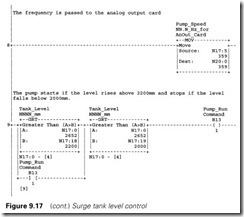
The resulting floating point number F18:1 (in the range 200 to 500 for 20 to 50 Hz) is converted to an integer number N17:5. This is lim- ited to the range Vmin to Vmax by rungs 6 and 7. Rung 8 moves the motor speed to N10:0 for the analog output to the VF drive.
Rung 9 generates the run command for the motor. N17:12 is Lstart, the level at which the pumping will commence. This is set higher than Lmin, at 2200 mm giving 200 mm of hysteresis and protection against rapid start/stops on waves. The pump will start once the level rises above 2200 mm and continue until the level falls to Lmin when it will
stop. At very low input flows the level will cycle between Lmin and Lstart with the pump starting and stopping. At normal flow rates the pump will run at a speed which makes the pump flow exactly match the input flow.
Linearization
Analog signals are often non-linear and have to be linearized before they can be used. Typical examples are thermocouples and resistance tempera- ture detectors which have a non-linear response. The linearization is best done with a straight line approximation which can give surprisingly accurate results. The GEM-80 deserves particular praise for its LINCON function which provides a built in straight line (Ax + B) linearization function with limiting.
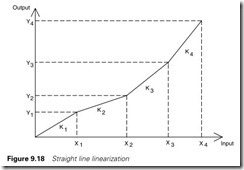
Figure 9.18 is a typical example of a non-linear relationship between an input x and an output y. The input x could be the millivolts from a thermocouple and y the temperature for example. Four known input points X1 to X4 (and their corresponding outputs Y1 to Y4) are chosen. Between each of these the response is assumed to follow a straight line.
We start by defining four slopes:
K1 = Y1/X1
K2 = (Y2 – Y1)/(X2 – X1)
K3 = (Y3 – Y2)/(X3 – X2)
K4 = (Y4 – Y3)/(X4 – X3)
The input signal x is then tested to see which range it lies in, then the output y calculated as below:
if (x > 0) and (x < X1) then y = K1x
if (x > = X1) and (x < X2) then y = K2.(x – X1) + Y1
if (x > = X2) and (x < X3) then y = K3.(x – X2) + Y2
if (x > = X3) and (x < X4) then y = K4.(x – X3) + Y3
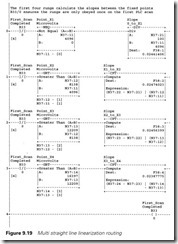
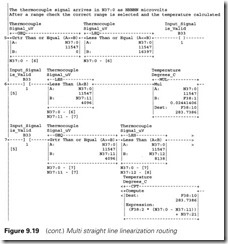
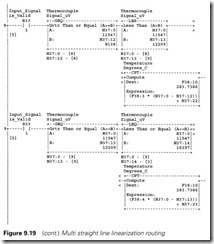
As an example the rungs in Figure 9.19 convert microvolts to tempera- ture for a type K thermocouple over the range 20 to 400 °C. The signal, in microvolts, from a type K thermocouple over this range is:
The thermocouple signal comes from the analog input card in N37:0 scaled in microvolts. Cold junction compensation has been applied before N37:0. A temperature of 200 °C would thus give 8138 in N37:0. The four reference microvolts are stored in N37:11 to N37:14 (X1 to X4) and the four reference temperatures are stored in N37:21 to N37:24 (Y1 to Y4).
The first four rungs calculate the slopes K1 to K4 which are stored in
F38:1 to F38:4. B33/0 is de-energized for the first scan after the PLC goes from halt to run, so these rungs are only obeyed once and do not load the PLC thereafter. Rung 4 energizes B33/0.
Rung 5 is a validity check on the thermocouple signal. Thermocouples are prone to failing open circuit (which gives a very high temperature reading) or short circuit (which gives zero reading). The output from this rung, B33/1, is used to enable the following rungs and could also be used to trigger an alarm in the event of a bad signal.
Rungs 6 to 9 calculate the temperature for each of the four ranges. Only one of these is active at any one time, the correct rung being selected by the comparison instructions at the beginning of each rung. In each rung the calculated temperature is placed in the floating point number F38:10.
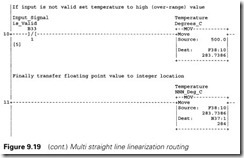
Rung 10 moves a default value into F38:10 if rung 5 determined the input signal was not valid. With temperature measurement the default value is usually high for safety reasons, here a temperature of 500 °C has been used.
Finally rung 11 moves the temperature into the integer location N37:1. A floating point number is used for the calculations in rungs 6 to 9 rather than an integer number to avoid rounding errors. The output temperature is given in steps of one degree centigrade and the lineariza- tion is accurate to better than one degree.
The program as written could be shortened by doing some off-line work. Rungs 0 to 4 are not strictly necessary as K1 to K4 will never change and can be found with a calculator. K2, for example, is (200 – 100)/ (8138 – 4096) = 0.024 74 02 which can be entered directly into the pro- gram. The CPT instruction in rung 7, for example, could have F38:32 replaced by 0.024 74 02 saving storage space and making the program
run faster.
9.7 Flow totalization
Flow measurement is very common, and often calculation of the total volume passed in some time is required. This may be for accounting purposes (the total gas used this shift was 40.57 m3) or production purposes (add 25 litres of product A then 50 litres of product B).
If we have a measured flow rate of F l/min, then F /60 litres will pass each second. In general for a flow rate F l/min sampled every Dt seconds,
Dt * F/60 litres will pass in each sample period. We can therefore calculate the total volume with the following pseudo code:
Repeat
read new flow {from analog input card} wait Dt seconds.
volume over dt = Dt – newflow/60 {assuming new flow is measured
in l/min} total volume = total volume + volume over dt
Until hell freezes over
If the flow is measured in litres per hour line 4 becomes
volume over dt = Dt – new flow/3600
as there are 3600 seconds in an hour.
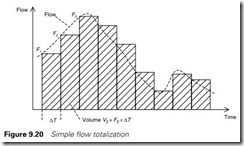
Figure 9.20 shows the procedure. Effectively we are sampling the flow at fixed time intervals and calculating the total volume in each time interval.
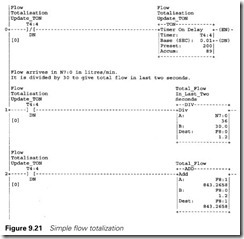
The three rungs in Figure 9.21 achieve this. Rung 0 is a free running timer producing a single scan pulse every Dt seconds. Rungs 1 and 2 are thus obeyed every Dt seconds. In the example the preset, and hence Dt is two seconds.
The instantaneous measured flow (in engineering units (litres, gallons, m3 or whatever) per minute) arrives in N7:0. Rung 1 divides this flow by 30 to give the total volume in the last two seconds in F8:0. The division by 30 is used because the flow rate is in units per minute and we are sampling every two seconds.
Rung 2 adds the volume in the last sample (F8:0) to the overall total volume in F8:1 to give an updated total volume.
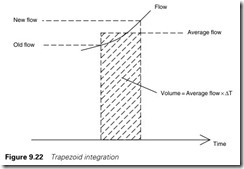
This flow totalization is very simple but examination of Figure 9.20 shows we are underestimating the total volume for increasing flow and overestimating the volume for decreasing flow. Over time these errors will more or less cancel, but a more accurate method will use the average flow over the sample time as shown on Figure 9.22. Note that no more samples have to be made as each measurement is both the last reading in the last sample and the first reading in the next sample.
The procedure can be summarized in the pseudo code:
old flow = 0
{done once just to initialize the variable}
repeat
wait Dt seconds
read new flow {from analog input card}
average flow = (new flow + old flow)/2
volume over dt = Dt – average flow/60
total volume = total volume + volume over dt
old flow = new flow {ready for next loop}
until hell freezes over
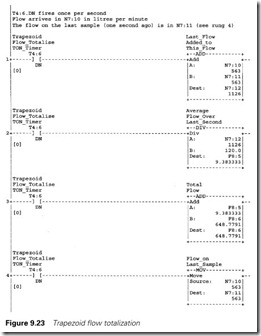
This is known as trapezoid integration and Figure 9.23 shows how this can be achieved in ladder logic. As before a free running timer is used to generate a single scan pulse every Preset seconds. In this example this has been set at one second. The four rungs are only obeyed for one scan every second.
Rung 1 adds the current flow (in N7:10 from an analog input card) and the flow last scan (in N7:11) ready for the average flow calculation. Rung 2 divides the summed flows by 120; this is a divide by 60 to get from litres per min to litres passed in a second and a divide by 2 to give the average flow. The result, in F8:5, is the total volume in the last second.
Rung 3 adds the volume in the last second to the total volume in F8:6.
The final rung moves the current flow (N7:10) to the last flow (in N7:11) ready for the next sample time.
Both these approaches work well, but care is needed in the implemen- tation. The first consideration is the sample rate. The accuracy of the
timers in Figures 9.20 and 9.22 are generally very good, but are influ- enced by the scan time of the PLC. If the scan time is a typical 20 ms, a nominal one second sample time will vary randomly between 1.00 and 1.02 seconds. This effect can be reduced by having a long sample time. Increasing the sample time, however, makes the system slow to respond to changes in flow. Depending on the physical size of the pipes on the plant, sample times of one to thirty seconds will normally be used.
Some PLCs have system bits which are driven by the PLC, S:23/0 in the PLC5 for example, is a toggling bit with a period of two seconds. These system bits are unaffected by the PLC scan time and their use in place of the free running timers will significantly improve the accuracy.
PLCs which support subroutines often allow program files to be triggered at fixed time intervals. In a PLC5, for example, these are called STI (for Selectable Timed Interrupt) files. These are ideal for flow totalization as the trigger rate is very accurate (repeatability typically better than 1 ms) and is unaffected by the program scan. With a time triggered program file the free running timers and their contacts are not required.
The second consideration is the resolution of floating point numbers. In rung 2 of the first example and rung 3 of the second example we add a small number (the volume passed in the last sample time) to a large number (the total volume since totalization started). A floating point number typically has a resolution of seven digits, so 87 583.52 and 7.405716 are both valid floating point numbers. If they are added, however, eleven digits would be required for the result. This cannot be handled so the result is truncated to 87 590.92. The error here is small but cumulative. Eventually the state is reached where the addition of the small sum cannot be made at all, for example:
12 345 670 + 6.789 gives 12 345 670
and the totalization has totally stopped working.
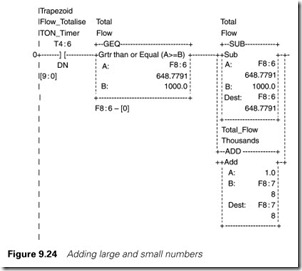
Let us assume our flow measurement is accurate to about 1%. There is no point in representing it to better than 4 digits. This leaves 3 digits (of the seven) for the total volume if we are not to lose accuracy as the lower digits are dropped. Let us assume a typical volume in the sample period will be N.NNN. The maximum value we can allow the total volume to rise to is NNNN.NNN before we lose digits. This can be achieved by the rung in Figure 9.24 which is again triggered once per sample time.
If the total volume (in F8:6) goes above (or equal to) 1000 (four digits), 1000 is subtracted from F8:6 and one added to F8:7 which holds the total volume divided by 1000. Note that there is no error in this operation. F8:7 holds the flow in thousands of units and F8:6 the balance volume 0 to 999.999. For example
Technically the conversion from flow rate to total volume is integration. Identical methods can be used to calculate distance from speed, and speed from acceleration. Double integration can go from acceleration to velocity to distance; a technique used to track rockets.
Scaling
This example shows how to convert an input analog signal into engineer- ing units for use in the PLC program. Suppose we have a 4–20 mA signal from a temperature transducer with a range 800 to 1500 °C. This is connected by a 250 ohm burden resistor into an analog input card with a 0–10 V range. The analog card gives a 12 bit reading from 0 to 4095. We can thus represent the system by Figure 9.25(a).
The analog temperature signal at the card terminals will go from 1 to 5 V giving a signal range of 410 to 2048 for the program. We wish this to be in engineering units to aid fault finding. To do this we need to fol- low the graph on Figure 9.25(b).
The range in engineering units, Espan is (1500 – 800) = 700. The range from the card Ispan is (2048 – 410) = 1638.
If the input signal from the card is Iin then the signal in engineering units is given by
Eout = Emin + (Iin – Imin)* Espan/Ispan
where Imin is the minimum card signal (410) and Emin is the minimum input signal in engineering units (800).
The slope Espan/Ispan could be calculated by the PLC on the first scan (as done for the linearization routine in Section 9.7) but here we will calculate it off line and enter it as a constant with value 700/1638 = 0.427
35. Similarly Imin and Emin are entered into the rungs as constants (410 and 800 respectively).
The routine is shown on Figure 9.26. Rung 0 checks the input signal is within the expected range. If not, rung 3 assigns a default value of 1600.
If the value is good, rung 1 calculates (Iin – Imin) * Espan/Ispan and rung 2 adds Emin to give the result.
The basic four rungs can be used for any linear conversion between
two variables of the general form Ax + B. The example converts an analog input. Another common application is for analog outputs where
an output 0–1000 (for, say 0–100.0%) is converted to a range of 410 to 4095 to give 4–20 mA on a 0–20 mA analog output card.
Gray code conversion
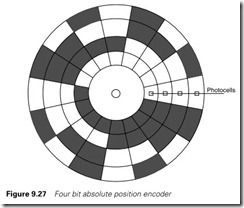
The absolute position of a device is often required in sequencing applications, and this is usually provided by an optical encoder. These consist of an optical grating moving in front of photocells. Figure 9.27 shows a very simple example encoded in binary with four bits giving sixteen possible positions.
Binary encoding, though, has a potential problem. As the encoder goes from position 7 to position 8 the binary count changes from 0111 to 1000. It is very unlikely that all bits will change simultaneously, and PLC input cards inherently turn On and Off with different time delays. Transiently, therefore, we could see 0111 > 1111 > 1000 or 0111 > 0000 > 1000 or any other combination of four bits. Similar prob- lems can occur on any change.
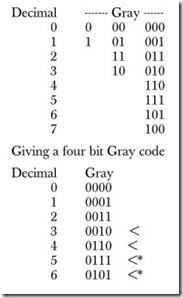
This problem can be overcome by using a coding where only one bit changes on each transition from one number to the next. Such codes are known as Unit Distance Codes. By far the commonest unit distance code is
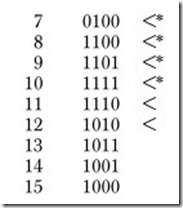
the Gray code which is built up by reflecting the bit pattern and changing the top bit as below:
The principle can be extended to any number of bits. There are two things to note about the code. First it is symmetrical about the 7/8 transi- tion. The second is that codes can be built for any even number either side of the centre. A ten position Gray code is marked by < and a six position Gray code by *. Note that each of these spills over (from 12 to 3 for example for the ten position code) with only a single bit change. Any even number sequence can be turned into a Gray code.
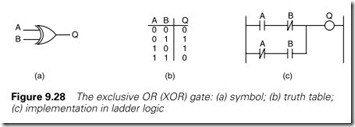
Before a Gray code can be used it must be turned into a normal binary number. This is based on the Exclusive OR (XOR) gate of Figure 9.28(a) which has the truth table of Figure 9.28(b). In ladder logic and XOR gate is built as Figure 9.28(c).
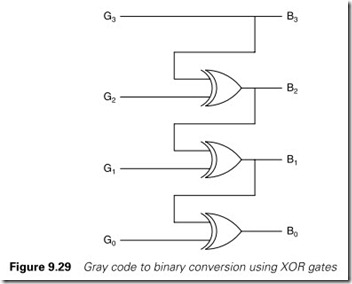
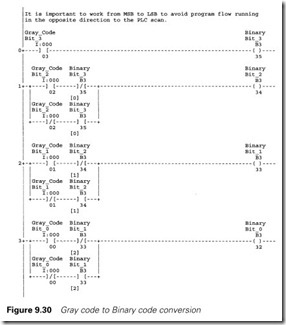
The conversion of a four bit Gray code to Binary is shown on Figure 9.29. This converts directly to the four rungs of Figure 9.30. The principle can be extended to any number of bits. The most significant Gray code bit is copied to the most significant binary bit. Each subse- quent binary bit BN is the XOR of Gray code bit GN and BN + 1.
The conversion will give the full range of the bits; for four bits the result will be 0 to 15 inclusive. If a restricted range is used an offset must be subtracted. With ten positions and four bits the count will go from 3 to 12 then overspill back to three. Here three must be subtracted from the binary number to give ten positions from 0 to 9.
A common Gray encoder gives 360 positions (0 to 359) per revolution and consequently an output in degrees. This requires nine bits, so the full range is 0 to 511. The 360 positions are centred on the 255/256 tran
sition and go from 76 (which is zero) to 435 (which is 359). Here the nine bit Gray code must be converted to binary as described above then 76 subtracted from the result to give a position which goes from 0 to 359. In general for an even number of positions N and G the maximum number of positions of the Gray code (which will always be a multiple of two: 4, 8, 16, 32, 64, 128, 256, 512, 1024, etc.) the offset which must
be subtracted is given by:
Offset = (G – N)/2
For our 360 degree encoder Offset = (512 – 360)/2 = 76.
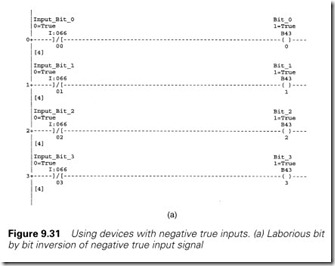
There are a few general facts which should be established before using any encoder; Gray, binary or incremental. The vast majority of PLC input cards sink current. Some encoders have an NPN output which also sinks current. If an NPN encoder is connected to a standard input card the signals cannot be read. Pull up resistors, one per bit, may be used, or an input card which sources current.
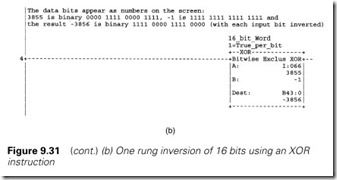
In these circumstances the polarity of the signal as seen by the PLC must be determined with some care. Some sourcing input cards denote a low voltage (i.e. current being drawn) as a ‘1’ state. These work well with NPN output encoders which often have the low state as the ‘1’. Some cards don’t, however, and these will invert the signal as seen by the PLC. Before the signal is used it must be inverted again by software. This can be done laboriously bit by bit with a n/c contact linked to a coil
for each bit as Figure 9.31(a) or, if an XOR function is available, by a single XOR which operates on the entire word from the encoder. In the XOR mask each bit used by the encoder must be set to a ‘1’ as shown on Figure 9.31(b) for a sixteen bit encoder.
BCD to Binary conversion
Numeric data is often entered by rotary or thumb-wheel switches with a 0–9 range. Each switch gives four binary bits. When these are arranged as hundreds, tens and units the result is a BCD coded number. Most PLCs work in two’s complement binary, so conversion from BCD to
Binary is often required. Some PLCs (notably the PLC5 and SLC500 families) have a BCD to Binary function (FRD, FRom Decimal, for the PLC5). For those PLCs without this function, the conversion can be performed as below.
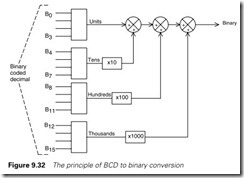
The principle is shown on Figure 9.32. The input signal (range 0–999) occurs on 12 bits from input card 6 in slot 2, i.e. addresses I:26/00, I:26/01, etc. Each group of four bits is converted to a binary number with range 0 to 9 (binary 0000 to 1001). The number for the hundreds (in N17:42) is multiplied by 100, the number for the tens (in N17:41) is multiplied by 10 and both then added to the number for the units in N17:40 to give the binary result in N17:46.
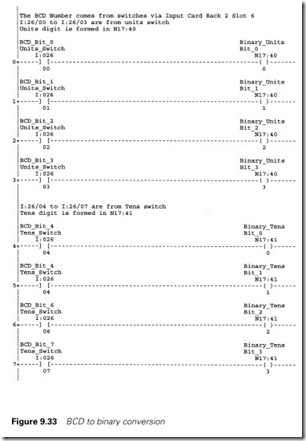
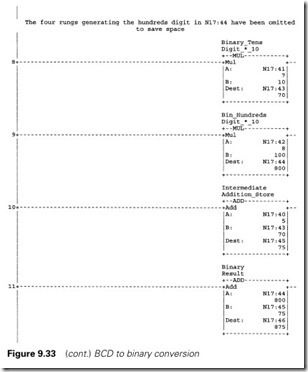
The rungs to achieve this are shown on Figure 9.33. There are 12 rungs which build the numbers in N7:40, 41 and 42. To save space only eight of these are shown. Note that individual bits in an integer number can be accessed; N17:40/0 is the (least significant) bit in the 16 bit inte- ger word N17:40. Store location N17:45 is used as an intermediate store for the part result (N17:40 + N17:43). With a CPT instruction all four arithmetic rungs could be done in one rung but the twelve bit rungs are still required.
If a PLC supports subroutines with parameter passing, a BCD to Binary conversion only has to be written once then called when required.
Binary to BCD conversion
Data is often displayed on seven segment displays using four bits per digit. This requires a binary to BCD conversion routine in the PLC program. Some PLCs (such as the PLC5 family) include this as stand- ard (TOD for TO Decimal). The routine described below can be used where there is no binary to BCD function.
The principle is, in principle, simple. The number is divided by 10 repeatedly with no rounding and the remainder noted each time. The remainders are then the digits for the BCD output. For example:
BCD digits are hundreds 4, tens 5 and units 9.
The difficulties come because of the way PLCs handle integer division. Some round down on integer division, e.g. 459/10 gives the result 45. This makes this conversion easy to perform. Some PLCs (of which the Rockwell family is one) round to the nearest number. The sum 459/10 thus gives the result 46 and the sum 454/10 gives the result 45. Both methods have advantages in different applications, but rounding to the nearest number makes Binary to BCD conversion more difficult.
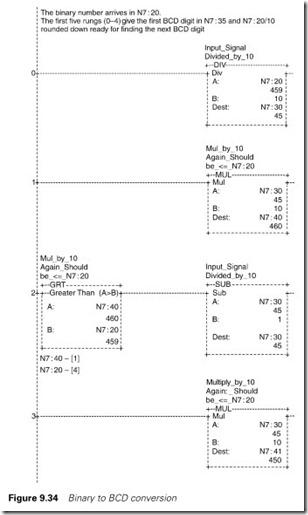
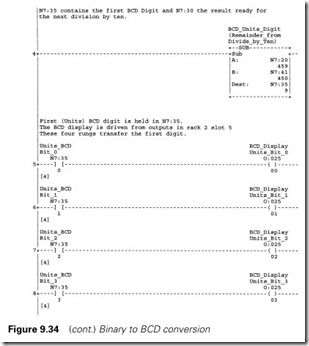
The four rungs in Figure 9.34 extract the first (units) digit for a binary to BCD number for a PLC with rounding to the nearest number integer division. Rung 0 divides the input signal N7:20 by ten giving a result in N7:30. This result is multiplied by ten giving the result in N7:40. If rounding up has occurred, N7:40 will be greater than the input value in N7:20. This is checked in rung 2, and if it has occurred one is subtracted from N7:30. This now contains N7:20 divided by 10 and definitely rounded down. It is multiplied by 10 again giving a result in N7:41. Note that N7:41 and N7:40 are not the same. Subtracting N7:41 from N7:20 gives the first BCD digit in N7:35 which can be transferred bit by bit to the display output in Rack 2 slot 5.
The principle of the first four rungs can be used anywhere where a true modulo/remainder division is required.
The printout in Figure 9.34 is from a running PLC and, at first sight, shows an apparent error at rung 1. At the time that rung 1 has just been obeyed N7:30 will contain 46 (because of the rounding) and hence N7:40 contains 460. After rung 2 the decrement has been performed leaving 45. Because N7:30 contains 46 for just two rungs, and 45 for the (much longer) rest of the program and the program terminal takes ‘snapshots’ at regular time intervals it is much more likely to see 45 than
46. By eye, the value in N7:30 will flicker between 45 and 46, showing 45 for the majority of the time. Be aware of oddities like this, they can be very confusing when first encountered.
A hydraulic system
The final example is a real example controlling two hydraulic pumps. The (not very well) defined specification for this would run something along the lines of:
‘The Widget machine has two hydraulic pumps. Only one of these is required for normal operation. The operator should be able to select which is the duty pump. If the duty pump fails for any reason the standby pump should start. In addition to Duty/Standby operation maintenance staff should be able to check a pump is functional without interrupting normal operation’.
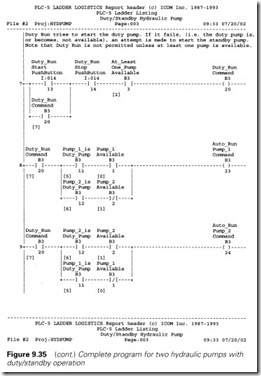
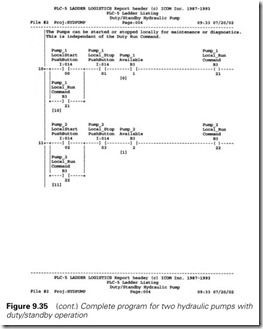
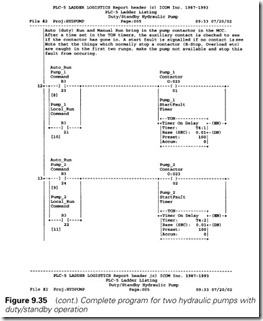
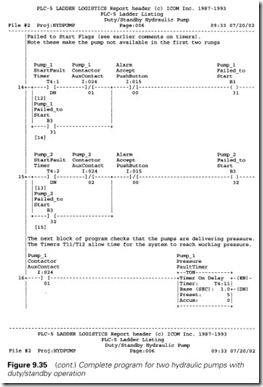
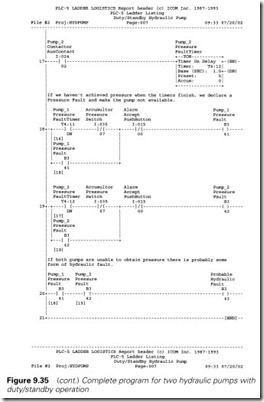
The final program, some 22 rungs long, is shown on Figure 9.35.
Remember a PLC program should:
Function correctly Be understandable Be easy to modify
Note the documentation tags in the program. Every address is tagged and comments are applied to most rungs. Good documentation is essen- tial to understanding a program. Also note the cross reference tags [N] below contacts. These show where the signal related to the contact orig- inates. For example in rung 12 the contact ‘Auto_Run Pump_1 Command’ (B3/23) originates at rung 8 allowing quick backward chasing of signals
when a fault occurs. All modern programming software has similar facilities.
Rungs 0 and 1 check if a pump is available to run. There are six real plant inputs per pump (MCC On to Filter Healthy) and two inputs common to both pumps (Low Oil Level and Return Filter). For each pump there are two alarm signals (Failed to Start and Pressure Fault).
These two rungs are very important and have been deliberately put at the beginning of the program so a technician investigating a fault at 3:00
a.m. only has to look at these two rungs to have a very good idea of what is going on.
Rungs 2 and 3 generate status signals about the availability of the pumps. Only one of these (B3/3) is actually used but B3/4 was added because it was thought to be a signal which might be useful for future development; alarm generation on a SCADA system for example.
Rungs 4, 5 and 6 select which pump is the duty pump. Latches –(L)– and –(U)– are used here so the duty pump selection is maintained through supply interruptions. Note that the logic ensures pump 1 or pump 2 is the duty pump; if it is not one it is the other. It is not possible to select no pump as duty. Small points like this are often forgotten!
Rung 7 generates the ‘Duty Run’ command. There are two points to note here. The Stop Button follows good practice by using a normally closed (fail safe) contact so it appears as a normally open contact
–] [– in the program. We must also have at least one pump available (B3/3 from rung 2).
Rungs 8 and 9 generate the auto run signals for each pump. Note the branches in each rung. If the duty pump is available the duty pump is asked to run. If the duty pump is not available when an auto run is required, the standby pump will run.
Rungs 10 and 11 are the manual (maintenance) run commands. These do not consider which is the duty or standby pumps, and there is no duty/standby changeover.
The auto and manual run commands are brought together at rungs 12 and 13. Note that the auto and manual run commands are separate and there is no interaction between them. The program for manual or auto operation can be changed without any side effects on the other. Many people would try to compact rungs 7 to 13 inclusive into just two rungs, eminently feasible but not easy to understand or modify. Keep rungs simple, logical and easy to change.
The two timers (T4:1 and T4:2) are part of the first part of the fault checking. The two pump contactors have auxiliary contacts which should make shortly after the contactor is energized. The two timers will time out (i.e. energize the done (DN) bit) one second after the coil is energized. This is more than ample time for the contacts to make.
Rungs 14 and 15 check that the auxiliary contact on the starter has made. If the auxiliary contact has not made when the corresponding timer times out, the fault bits B3/31 or B3/32 will energize and latch in. These in turn will make the corresponding pump not available at rung 0 or 1 and cause a changeover to the standby pump at rung 8 or 9. The fault bits are cleared by the Alarm Accept pushbutton.
The two pumps feed a common line and the hydraulic pressure is checked by a pressure switch I:35/07. This should make (meaning good pressure) within two seconds of a pump starting and stay made there- after. Timers T4:11 and T4:12 in rungs 16 and 17 check the state of the pressure switch five seconds after a pump starts (and continually there- after) in rungs 18 and 19. If, say, there is a coupling failure between motor and pump the pressure will fall, the pressure fault bit will be set making the pump not available at rungs 0 or 1, and a changeover to the standby pump will occur.
If both pumps generate a pressure fault there could be a common hydraulic fault such as a serious leak. This is detected at rung 20. A hydraulic fault makes both pumps not available at rungs 0 and 1.
