Chapter 7: Input/Output and Storage Systems
7.1 Introduction
“Who is General Failure and why is he reading my disk?”
—Anonymous
A computer is of no use without some means of getting data into it and information out of it. Having a computer that does not do this effectively or efficiently is little better than having no computer at all. When processing time exceeds user “think time,” users will complain that the computer is “slow.” Sometimes this slowness can have a substantial productivity impact, measured in hard currency. More often than not, the root cause of the problem is not in the processor or the memory but in how the system processes its input and output (I/O).
I/O is more than just file storage and retrieval. A poorly functioning I/O system can have a ripple effect, dragging down the entire computer system. In the preceding chapter, we described virtual memory, that is, how systems page blocks of memory to disk to make room for more user processes in main memory. If the disk system is sluggish, process execution slows down, causing backlogs in CPU as well as disk queues. The easy solution to the problem is to simply throw more resources at the system. Buy more main storage. Buy a faster processor. If we’re in a particularly Draconian frame of mind, we could simply limit the number of concurrent processes!
Such measures are wasteful, if not plain irresponsible. If we really understand what’s happening in a computer system we can make the best use of the resources available, adding costly resources only when absolutely necessary. The goal of this chapter is to present you with a survey of ways in which I/O and storage capacities can be optimized, allowing you to make informed storage choices. Our highest hope is that you might be able to use this information as a springboard for further study—and perhaps, even innovation.
7.2 Amdahl’s Law
Each time a (particular) microprocessor company announces its latest and greatest CPU, headlines sprout across the globe heralding this latest leap forward in technology. Cyberphiles the world over would agree that such advances are laudable and deserving of fanfare. However, when similar advances are made in I/O technology, the story is apt to appear on page 67 of some obscure trade magazine. Under the blare of media hype, it is easy to lose sight of the integrated nature of computer systems. A 40% speedup for one component certainly will not make the entire system 40% faster, despite media implications to the contrary.
In 1967, George Amdahl recognized the interrelationship of all components with the overall efficiency of a computer system. He quantified his observations in a formula, which is now known as Amdahl’s Law. In essence, Amdahl’s Law states that the overall speedup of a computer system depends on both the speedup in a particular component and how much that component is used by the system. In symbols:
where
S is the speedup;
f is the fraction of work performed by the faster component; and
k is the speedup of a new component.
Let’s say that most of your daytime processes spend 70% of their time running in the CPU and 30% waiting for service from the disk. Suppose also that someone is trying to sell you a processor array upgrade that is 50% faster than what you have and costs $10,000. The day before, someone had called you on the phone offering you a set of disk drives for $7,000. These new disks promise two and a half times the throughput of your existing disks. You know that the system performance is starting to degrade, so you need to do something. Which would you choose to yield the best performance improvement for the least amount of money?
For the processor option we have:
We therefore appreciate a total speedup of 130% with the new processor for $10,000.
For the disk option we have:
The disk upgrade gives us a speedup of 122% for $7,000.
All things being equal, it is a close decision. Each 1% of performance improvement resulting from the processor upgrade costs about $333. Each 1% with the disk upgrade costs about $318. This makes the disk upgrade a slightly better choice, based solely upon dollars spent per performance improvement percentage point. Certainly, other factors would influence your decision. For example, if your disks are nearing the end of their expected life, or if you’re running out of disk space, you might consider the disk upgrade even if it were to cost more than the processor upgrade.
Before you make that disk decision, however, you need to know your options. The sections that follow will help you to gain an understanding of general I/O architecture, with special emphasis on disk I/O. Disk I/O follows closely behind the CPU and memory in determining the overall effectiveness of a computer system.
7.3 I/O Architectures
We will define input/output as a subsystem of components that moves coded data between external devices and a host system, consisting of a CPU and main memory. I/O subsystems include, but are not limited to:
-
Blocks of main memory that are devoted to I/O functions
-
Buses that provide the means of moving data into and out of the system
-
Control modules in the host and in peripheral devices
-
Interfaces to external components such as keyboards and disks
-
Cabling or communications links between the host system and its peripherals
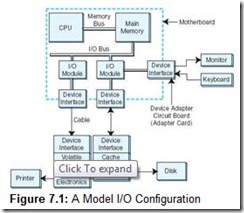
Figure 7.1 shows how all of these components can fit together to form an integrated I/O subsystem. The I/O modules take care of moving data between main memory and a particular device interface. Interfaces are designed specifically to communicate with certain types of devices, such as keyboards, disks, or printers. Interfaces handle the details of making sure that devices are ready for the next batch of data, or that the host is ready to receive the next batch of data coming in from the peripheral device.
The exact form and meaning of the signals exchanged between a sender and a receiver is called a protocol. Protocols comprise command signals, such as “Printer reset”; status signals, such as “Tape ready”; or data-passing signals, such as “Here are the bytes you requested.” In most data-exchanging protocols, the receiver must acknowledge the commands and data sent to it or indicate that it is ready to receive data. This type of protocol exchange is called a handshake.
External devices that handle large blocks of data (such as printers, and disk and tape drives) are often equipped with buffer memory. Buffers allow the host system to send large quantities of data to peripheral devices in the fastest manner possible, without having to wait until slow mechanical devices have actually written the data. Dedicated memory on disk drives is usually of the fast cache variety, whereas printers are usually provided with slower RAM.
Device control circuits take data to or from on-board buffers and assure that it gets where it’s going. In the case of writing to disks, this involves making certain that the disk is positioned properly so that the data is written to a particular location. For printers, these circuits move the print head or laser beam to the next character position, fire the head, eject the paper, and so forth.
Disk and tape are forms of durable storage, so-called because data recorded on them lasts longer than it would in volatile main memory. However, no storage method is permanent. The expected life of data on these media is approximately five years for magnetic media and as much as 100 years for optical media.
7.3.1 I/O Control Methods
Computer systems employ any of four general I/O control methods. These methods are programmed I/O, interrupt-driven I/O, direct memory access, and channel-attached I/O. Although one method isn’t necessarily better than another, the manner in which a computer controls its I/O greatly influences overall system design and performance. The objective is to know when the I/O method employed by a particular computer architecture is appropriate to how the system will be used.
Programmed I/O
Systems using programmed I/O devote at least one register for the exclusive use of each I/O device. The CPU continually monitors each register, waiting for data to arrive. This is called polling. Thus, programmed I/O is sometimes referred to as polled I/O. Once the CPU detects a “data ready” condition, it acts according to instructions programmed for that particular register.
The benefit of using this approach is that we have programmatic control over the behavior of each device. Program changes can make adjustments to the number and types of devices in the system as well as their polling priorities and intervals. Constant register polling, however, is a problem. The CPU is in a continual “busy wait” loop until it starts servicing an I/O request. It doesn’t do any useful work until there is I/O to process. Owing to these limitations, programmed I/O is best suited for special-purpose systems such as automated teller machines and systems that control or monitor environmental events.
Interrupt-Driven I/O
Interrupt-driven I/O can be thought of as the converse of programmed I/O. Instead of the CPU continually asking its attached devices whether they have any input, the devices tell the CPU when they have data to send. The CPU proceeds with other tasks until a device requesting service interrupts it. Interrupts are usually signaled with a bit in the CPU flags register called an interrupt flag.
Once the interrupt flag is set, the operating system interrupts whatever program is currently executing, saving that program’s state and variable information. The system then fetches the address vector that points to the address of the I/O service routine. After the CPU has completed servicing the I/O, it restores the information it saved from the program that was running when the interrupt occurred, and the program execution resumes.
Interrupt-driven I/O is similar to programmed I/O in that the service routines can be modified to accommodate hardware changes. Because vectors for the various types of hardware are usually kept in the same locations in systems running the same type and level of operating system, these vectors are easily changed to point to vendor-specific code. For example, if someone comes up with a new type of disk drive that is not yet supported by a popular operating system, the manufacturer of that disk drive may update the disk I/O vector to point to code particular to that disk drive. Unfortunately, some of the early DOS-based virus writers also used this idea. They would replace the DOS I/O vectors with pointers to their own nefarious code, eradicating many systems in the process. Many of today’s popular operating systems employ interrupt-driven I/O. Fortunately, these operating systems have mechanisms in place to safeguard against this kind of vector manipulation.
Direct Memory Access
With both programmed I/O and interrupt-driven I/O, the CPU moves data to and from the I/O device. During I/O, the CPU runs instructions similar to the following pseudocode:
       ADD 1 TO Byte-count
       IF Byte-count > Total-bytes-to-be-transferred THEN
         EXIT
       ENDIF
       Place byte in destination buffer
       Raise byte-ready signal
       Initialize timer
       REPEAT
         WAIT
       UNTIL Byte-acknowledged, Timeout, OR Error
ENDWHILE
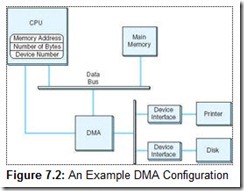
Clearly, these instructions are simple enough to be programmed in a dedicated chip. This is the idea behind direct memory access (DMA). When a system uses DMA, the CPU offloads execution of tedious I/O instructions. To effect the transfer, the CPU provides the DMA controller with the location of the bytes to be transferred, the number of bytes to be transferred, and the destination device or memory address. This communication usually takes place through special I/O registers on the CPU. A sample DMA configuration is shown in Figure 7.2.
Once the proper values are placed in memory, the CPU signals the DMA subsystem and proceeds with its next task, while the DMA takes care of the details of the I/O. After the I/O is complete (or ends in error), the DMA subsystem signals the CPU by sending it another interrupt.
As you can see by Figure 7.2, the DMA controller and the CPU share the memory bus. Only one of them at a time can have control of the bus, that is, be the bus master. Generally, I/O takes priority over CPU memory fetches for program instructions and data because many I/O devices operate within tight timing parameters. If they detect no activity within a specified period, they timeout and abort the I/O process. To avoid device timeouts, the DMA uses memory cycles that would otherwise be used by the CPU. This is called cycle stealing. Fortunately, I/O tends to create bursty traffic on the bus: data is sent in blocks, or clusters. The CPU should be granted access to the bus between bursts, though this access may not be of long enough duration to spare the system from accusations of “crawling during I/O.”
Channel I/O
Programmed I/O transfers data one byte at a time. Interrupt-driven I/O can handle data one byte at a time or in small blocks, depending on the type of device participating in the I/O. Slower devices such as keyboards generate more interrupts per number of bytes transferred than disks or printers. DMA methods are all block-oriented, interrupting the CPU only after completion (or failure) of transferring a group of bytes. After the DMA signals the I/O completion, the CPU may give it the address of the next block of memory to be read from or written to. In the event of failure, the CPU is solely responsible for taking appropriate action. Thus, DMA I/O requires only a little less CPU participation than does interrupt-driven I/O. Such overhead is fine for small, single-user systems; however, it does not scale well to large, multi-user systems such as mainframe computers. Most mainframes use an intelligent type of DMA interface known as an I/O channel.
With channel I/O, one or more I/O processors control various I/O pathways called channel paths. Channel paths for “slow” devices such as terminals and printers can be combined (multiplexed), allowing management of several of these devices through only one controller. On IBM mainframes, a multiplexed channel path is called a multiplexor channel. Channels for disk drives and other “fast” devices are called selector channels.
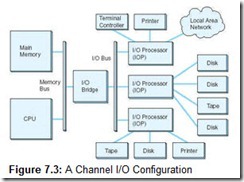
I/O channels are driven by small CPUs called I/O processors (IOPs), which are optimized for I/O. Unlike DMA circuits, IOPs have the ability to execute programs that include arithmetic-logic and branching instructions. Figure 7.3 shows a simplified channel I/O configuration.
IOPs execute programs that are placed in main system memory by the host processor. These programs, consisting of a series of channel command words (CCWs), include not only the actual transfer instructions, but also commands that control the I/O devices. These commands include such things as various kinds of device initializations, printer page ejects, and tape rewind commands, to name a few. Once the I/O program has been placed in memory, the host issues a start subchannel command (SSCH), informing the IOP of the location in memory where the program can be found. After the IOP has completed its work, it places completion information in memory and sends an interrupt to the CPU. The CPU then obtains the completion information and takes action appropriate to the return codes.
The principal distinction between standalone DMA and channel I/O lies in the intelligence of the IOP. The IOP negotiates protocols, issues device commands, translates storage coding to memory coding, and can transfer entire files or groups of files independent of the host CPU. The host has only to create the program instructions for the I/O operation and tell the IOP where to find them.
Like standalone DMA, an IOP must steal memory cycles from the CPU. Unlike standalone DMA, channel I/O systems are equipped with separate I/O buses, which help to isolate the host from the I/O operation. When copying a file from disk to tape, for example, the IOP uses the system memory bus only to fetch its instructions from main memory. The remainder of the transfer is effected using only the I/O bus. Owing to its intelligence and bus isolation, channel I/O is used in high-throughput transaction processing environments, where its cost and complexity can be justified.
7.3.2 I/O Bus Operation
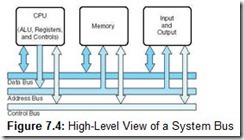
In Chapter 1, we introduced you to computer bus architecture using the schematic shown in Figure 7.4. The important ideas conveyed by this diagram are:
-
A system bus is a resource shared among many components of a computer system.
-
Access to this shared resource must be controlled. This is why a control bus is required.
From our discussions in the preceding sections, it is evident that the memory bus and the I/O bus can be separate entities. In fact, it is often a good idea to separate them. One good reason for having memory on its own bus is that memory transfers can be synchronous, using some multiple of the CPU’s clock cycles to retrieve data from main memory. In a properly functioning system, there is never an issue of the memory being offline or sustaining the same types of errors that afflict peripheral equipment, such as a printer running out of paper.
I/O buses, on the other hand, cannot operate synchronously. They must take into account the fact that I/O devices cannot always be ready to process an I/O transfer. I/O control circuits placed on the I/O bus and within the I/O devices negotiate with each other to determine the moment when each device may use the bus. Because these handshakes take place every time the bus is accessed, I/O buses are called asynchronous. We often distinguish synchronous from asynchronous transfers by saying that a synchronous transfer requires both the sender and the receiver to share a common clock for timing. But asynchronous bus protocols also require a clock for bit timing and to delineate signal transitions. This idea will become clear after we look at an example.
Consider, once again, the configuration shown in Figure 7.2. For the sake of clarity, we did not separate the data, address, and control lines. The connection between the DMA circuit and the device interface circuits is more accurately represented by Figure 7.5, which shows the individual component buses.
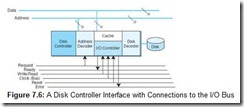
Figure 7.6 gives the details of how the disk interface connects to all three buses. The address and data buses consist of a number of individual conductors, each of which carries one bit of information. The number of data lines determines the width of the bus. A data bus having eight data lines carries one byte at a time. The address bus has a sufficient number of conductors to uniquely identify each device on the bus.
The group of control lines shown in Figure 7.6 is the minimum that we need for our illustrative purpose. Real I/O buses typically have more than a dozen control lines. (The original IBM PC had over 20!) Control lines coordinate the activities of the bus and its attached devices. To write data to the disk drive our example bus executes the following sequence of operations:
-
The DMA circuit places the address of the disk controller on the address lines, and raises (asserts) the Request and Write signals.
-
With the Request signal asserted, decoder circuits in the controller interrogate the address lines.
-
Upon sensing its own address, the decoder enables the disk control circuits. If the disk is available for writing data, the controller asserts a signal on the Ready line. At this point, the handshake between the DMA and the controller is complete. With the Ready signal raised, no other devices may use the bus.
-
The DMA circuits then place the data on the lines and lower the Request signal.
-
When the disk controller sees the Request signal drop, it transfers the byte from the data lines to the disk buffer, and then lowers its Ready signal.
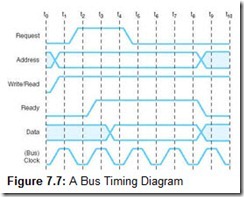
To make this picture clearer and more precise, engineers describe bus operation through timing diagrams. The timing diagram for our disk write operation is shown in Figure 7.7. The vertical lines, marked t0 through t10, specify the duration of the various signals. In a real timing diagram, an exact duration would be assigned to the timing intervals, usually in the neighborhood of 50 nanoseconds. Signals on the bus can change only during a clock cycle transition. Notice that the signals shown in the diagram do not rise and fall instantaneously. This reflects the physical reality of the bus. A small amount of time must be allowed for the signal level to stabilize, or “settle down.” This settle time, although small, contributes to a large delay over long I/O transfers.
Many real I/O buses, unlike our example, do not have separate address and data lines. Owing to the asynchronous nature of an I/O bus, the data lines can be used to hold the device address. All that we need to do is add another control line that indicates whether the signals on the data lines represent an address or data. This approach contrasts to a memory bus where the address and data must be simultaneously available.
7.3.3 Another Look at Interrupt-Driven I/O
Up to this point, we have assumed that peripheral equipment idles along the bus until a command to do otherwise comes down the line. In small computer systems, this “speak only when spoken to” approach is not very useful. It implies that all system activity originates in the CPU, when in fact, activity originates with the user. In order to communicate with the CPU, the user has to have a way to get its attention. To this end, small systems employ interrupt-driven I/O.
![]()
Bytes, Data, and Information . . . for the Record
Digerati need not be illiterati.
— Bill Walsh Lapsing into a Comma Contemporary Books, 2000
Far too many people use the word information as a synonym for data, and data as a synonym for bytes. In fact, we have often used data as a synonym for bytes in this text for readability, hoping that the context makes the meaning clear. We are compelled, however, to point out that there is indeed a world of difference in the meanings of these words.
In its most literal sense, the word data is plural. It comes from the Latin singular datum. Hence, to refer to more than one datum, one properly uses the word data. It is in fact easy on our ears when someone says, “The recent mortality data indicate that people are now living longer than they did a century ago.” But, we are at a loss to explain why we wince when someone says something like “A page fault occurs when data are swapped from memory to disk.” When we are using data to refer to something stored in a computer system, we really are conceptualizing data as an “indistinguishable mass” in the same sense as we think of air and water. Air and water consist of various discrete elements called molecules. Accordingly, a mass of data consists of discrete elements called data. No educated person who is fluent in English would say that she breathes airs or takes a bath in waters. So it seems reasonable to say, “. . . data is swapped from memory to disk.” Most scholarly sources (including the American Heritage Dictionary) now recognize data as a singular collective noun when used in this manner.
Strictly speaking, computer storage media don’t store data. They store bit patterns called bytes. For example, if you were to use a binary sector editor to examine the contents of a disk, you might see the pattern 01000100. So what knowledge have you gained upon seeing it? For all you know, this bit pattern could be the binary code of a program, part of an operating system structure, a photograph, or even someone’s bank balance. If you know for a fact that the bits represent some numeric quantity (as opposed to program code or an image file, for example) and that it is stored in two’s complement binary, you can safely say that it is the decimal number 68. But you still don’t have a datum. Before you can have a datum, someone must ascribe some context to this number. Is it a person’s age or height? Is it the model number of a can opener? If you learn that 01000100 comes from a file that contains the temperature output from an automated weather station, then you have yourself a datum. The file on the disk can then be correctly called a data file.
By now, you’ve probably surmised that the weather data is expressed in degrees Fahrenheit, because no place on earth has ever reached 68° Celsius. But you still don’t have information. The datum is meaningless: Is it the current temperature in Amsterdam? Is it the temperature that was recorded at 2:00 am three years ago in Miami? The datum 68 becomes information only when it has meaning to a human being.
Another plural Latin noun that has recently become recognized in singular usage is the word media. Formerly, educated people used this word only when they wished to refer to more than one medium. Newspapers are one kind of communication medium. Television is another. Collectively, they are media. But now some editors accept the singular usage as in, “At this moment, the news media is gathering at the Capitol.”
Inasmuch as artists can paint using a watercolor medium or an oil paint medium, computer data recording equipment can write to an electronic medium such as tape or disk. Collectively, these are electronic media. But rarely will you find a practitioner who intentionally uses the term properly. It is much more common to encounter statements like, “Volume 2 ejected. Please place new media into the tape drive.” In this context, it’s debatable whether most people would even understand the directive “. . . place a new medium into the tape drive.”
Semantic arguments such as these are symptomatic of the kinds of problems computer professionals face when they try to express human ideas in digital form, and vice versa. There is bound to be something lost in the translation, and we learn to accept that. There are, however, limits beyond which some of us are unwilling to go. Those limits are sometimes called “quality.”
![]()
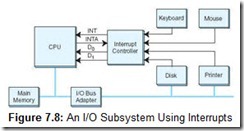
Figure 7.8 shows how a system could implement interrupt-driven I/O. Everything is the same as in our prior example, except that the peripherals are now provided with a way to communicate with the CPU. Every peripheral device in the system has access to an interrupt request line. The interrupt control chip has an input for each interrupt line. Whenever an interrupt line is asserted, the controller decodes the interrupt and raises the Interrupt (INT) input on the CPU. When the CPU is ready to process the interrupt, it asserts the Interrupt Acknowledge (INTA) signal. Once the interrupt controller gets this acknowledgement, it can lower its INT signal.
System designers must, of course, decide which devices should take precedence over the others when more than one device raises interrupts simultaneously. This design decision is hard-wired into the controller. Each system using the same operating system and interrupt controller will connect high-priority devices (such as a keyboard) to the same interrupt request line. The number of interrupt request lines is limited on every system, and in some cases, the interrupt can be shared. Shared interrupts cause no problems when it is clear that no two devices will need the same interrupt at the same time. For example, a scanner and a printer usually can coexist peacefully using the same interrupt. This is not always the case with serial mice and modems, where unbeknownst to the installer, they may use the same interrupt, thus causing bizarre behavior in both.
7.4 Magnetic Disk Technology
Before the advent of disk drive technology, sequential media such as punched cards and magnetic or paper tape were the only kinds of durable storage available. If the data that someone needed were written at the trailing end of a tape reel, the entire volume had to be read-one record at a time. Sluggish readers and small system memories made this an excruciatingly slow process. Tape and cards were not only slow, but they also degraded rather quickly due to the physical and environmental stresses to which they were exposed. Paper tape often stretched and broke. Open reel magnetic tape not only stretched, but also was subject to mishandling by operators. Cards could tear, get lost, and warp.
In this technological context, it is easy to see how IBM fundamentally changed the computer world in 1956 when it deployed the first commercial disk-based computer called the Random Access Method of Accounting and Control computer, or RAMAC, for short. By today’s standards, the disk in this early machine was incomprehensibly huge and slow. Each disk platter was 24 inches in diameter, containing only 50,000 7-bit characters of data on each surface. Fifty two-sided platters were mounted on a spindle that was housed in a flashy glass enclosure about the size of a small garden shed. The total storage capacity per spindle was a mere 5 million characters and it took one full second, on average, to access data on the disk. The drive weighed more than a ton and cost millions of dollars to lease. (One could not buy equipment from IBM in those days.)
By contrast, in early 2000, IBM began marketing a high-capacity disk drive for use in palmtop computers and digital cameras. These disks are 1 inch in diameter, hold 1 gigabyte (GB) of data, and provide an average access time of 15 milliseconds. The drive weighs less than an ounce and retails for less than $300!
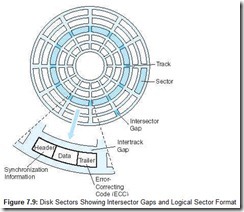
Disk drives are called random (sometimes direct) access devices because each unit of storage, the sector, has a unique address that can be accessed independently of the sectors around it. As shown in Figure 7.9, sectors are divisions of concentric circles called tracks. On most systems, every track contains exactly the same number of sectors. Each sector contains the same number of bytes. Hence, the data is written more “densely” at the center of the disk than at the outer edge. Some manufacturers pack more bytes onto their disks by making all sectors approximately the same size, placing more sectors on the outer tracks than on the inner tracks. This is called zoned-bit recording. Zoned-bit recording is rarely used because it requires more sophisticated drive control electronics than traditional systems.
Disk tracks are consecutively numbered starting with track 0 at the outermost edge of the disk. Sectors, however, may not be in consecutive order around the perimeter of a track. They sometimes “skip around” to allow time for the drive circuitry to process the contents of a sector prior to reading the next sector. This is called interleaving. Interleaving varies according to the speed of rotation of the disk as well as the speed of the disk circuitry and its buffers. Most of today’s fixed disk drives read disks a track at a time, not a sector at a time, so interleaving is now becoming less common.
7.4.1 Rigid Disk Drives
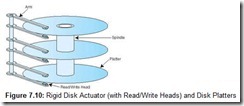
Rigid (“hard” or fixed) disks contain control circuitry and one or more metal or glass disks called platters to which a thin film of magnetizable material is bonded. Disk platters are stacked on a spindle, which is turned by a motor located within the drive housing. Disks can rotate as fast as 15,000 revolutions per minute (rpm), the most common speeds being 5400 rpm and 7200 rpm. Read/write heads are typically mounted on a rotating actuator arm that is positioned in its proper place by magnetic fields induced in coils surrounding the axis of the actuator arm (see Figure 7.10). When the actuator is energized, the entire comb of read-write heads moves toward or away from the center of the disk.
Despite continual improvements in magnetic disk technology, it is still impossible to mass-produce a completely error-free medium. Although the probability of error is small, errors must, nevertheless, be expected. Two mechanisms are used to reduce errors on the surface of the disk: special coding of the data itself and error-correcting algorithms. (This special coding and some error-correcting codes were discussed in Chapter 2.) These tasks are handled by circuits built into the disk controller hardware. Other circuits in the disk controller take care of head positioning and disk timing.
In a stack of disk platters, all of the tracks directly above and below each other form a cylinder. A comb of read-write heads accesses one cylinder at a time. Cylinders describe circular areas on each disk.
Typically, there is one read-write head per usable surface of the disk. (Older disks-particularly removable disks-did not use the top surface of the top platter or the bottom surface of the bottom platter.) Fixed disk heads never touch the surface of the disk. Instead, they float above the disk surface on a cushion of air only a few microns thick. When the disk is powered down, the heads retreat to a safe place. This is called parking the heads. If a read-write head were to touch the surface of the disk, the disk would become unusable. This condition is known as a head crash.
Head crashes were common during the early years of disk storage. First-generation disk drive mechanical and electronic components were costly with respect to the price of disk platters. To provide the most storage for the least money, computer manufacturers made disk drives with removable disks called disk packs. When the drive housing was opened, airborne impurities, such as dust and water vapor, would enter the drive housing. Consequently, large head-to-disk clearances were required to prevent these impurities from causing head crashes. (Despite these large head-to-disk clearances, frequent crashes persisted, with some companies experiencing as much downtime as uptime.) The price paid for the large head-to-disk clearance was substantially lower data density. The greater the distance between the head and the disk, the stronger the charge in the flux coating of the disk must be for the data to be readable. Stronger magnetic charges require more particles to participate in a flux transition, resulting in lower data density for the drive.
Eventually, cost reductions in controller circuitry and mechanical components permitted widespread use of sealed disk units. IBM invented this technology, which was developed under the code name “Winchester.” Winchester soon became a generic term for any sealed disk unit. Today, with removable-pack drives no longer being manufactured, we have little need to make the distinction. Sealed drives permit closer head-to-disk clearances, increased data densities, and faster rotational speeds. These factors constitute the performance characteristics of a rigid disk drive.
Seek time is the time it takes for a disk arm to position itself over the required track. Seek time does not include the time that it takes for the head to read the disk directory. The disk directory maps logical file information, for example, my_story.doc, to a physical sector address, such as cylinder 7, surface 3, sector 72. Some high-performance disk drives practically eliminate seek time by providing a read/write head for each track of each usable surface of the disk. With no movable arms in the system, the only delays in accessing data are caused by rotational delay.
Rotational delay is the time that it takes for the required sector to position itself under a read/write head. The sum of the rotational delay and seek time is known as the access time. If we add to the access time the time that it takes to actually read the data from the disk, we get a quantity known as transfer time, which, of course, varies depending on how much data is read. Latency is a direct function of rotational speed. It is a measure of the amount of time it takes for the desired sector to move beneath the read/write head after the disk arm has positioned itself over the desired track. Usually cited as an average, it is calculated as:
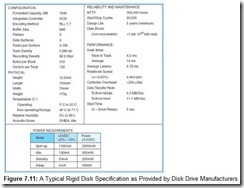
To help you appreciate how all of this terminology fits together, we have provided a typical disk specification as Figure 7.11.
Because the disk directory must be read prior to every data read or write operation, the location of the directory can have a significant impact on the overall performance of the disk drive. Outermost tracks have the lowest bit density per areal measure, hence, they are less prone to bit errors than the innermost tracks. To ensure the best reliability, disk directories can be placed at the outermost track, track 0. This means for every access, the arm has to swing out to track 0 and then back to the required data track. Performance therefore suffers from the wide arc made by the access arms.
Improvements in recording technology and error-correction algorithms permit the directory to be placed in the location that gives the best performance: at the middlemost track. This substantially reduces arm movement, giving the best possible throughput. Some, but not all, modern systems take advantage of center track directory placement.
Directory placement is one of the elements of the logical organization of a disk. A disk’s logical organization is a function of the operating system that uses it. A major component of this logical organization is the way in which sectors are mapped. Fixed disks contain so many sectors that keeping tabs on each one is infeasible. Consider the disk described in our data sheet. Each track contains 132 sectors. There are 3196 tracks per surface and 5 surfaces on the disk. This means that there are a total of 2,109,360 sectors on the disk. An allocation table listing the status of each sector (the status being recorded in 1 byte) would therefore consume over 2 megabytes of disk space. Not only is this a lot of disk space spent for overhead, but reading this data structure would consume an inordinate amount of time whenever we need to check the status of a sector. (This is a frequently executed task.) For this reason, operating systems address sectors in groups, called blocks or clusters, to make file management simpler. The number of sectors per block determines the size of the allocation table. The smaller the size of the allocation block, the less wasted space there is when a file doesn’t fill the entire block; however, smaller block sizes make the allocation tables larger and slower. We will look deeper into the relationship between directories and file allocation structures in our discussion of floppy disks in the next section.
One final comment about the disk specification shown in Figure 7.11: You can see that it also includes estimates of disk reliability under the heading of “Reliability and Maintenance.” According to the manufacturer, this particular disk drive is designed to operate for five years and tolerate being stopped and started 50,000 times. Under the same heading, a mean time to failure (MTTF) figure is given as 300,000 hours. Surely this figure cannot be taken to mean that the expected value of the disk life is 300,000 hours-this is just over 34 years if the disk runs continuously. The specification states that the drive is designed to last only five years. This apparent anomaly owes its existence to statistical quality control methods commonly used in the manufacturing industry. Unless the disk is manufactured under a government contract, the exact method used for calculating the MTTF is at the discretion of the manufacturer. Usually the process involves taking random samples from production lines and running the disks under less than ideal conditions for a certain number of hours, typically more than 100. The number of failures are then plotted against probability curves to obtain the resulting MTTF figure. In short, the “Design Life” number is much more credible and understandable.
7.4.2 Flexible (Floppy) Disks
Flexible disks are organized in much the same way as hard disks, with addressable tracks and sectors. They are often called floppy disks because the magnetic coating of the disk resides on a flexible Mylar substrate. The data densities and rotational speeds (300 or 360 RPM) of floppy disks are limited by the fact that floppies cannot be sealed in the same manner as rigid disks. Furthermore, floppy disk read/write heads must touch the magnetic surface of the disk. Friction from the read/write heads causes abrasion of the magnetic coating, with some particles adhering to the read/write heads. Periodically, the heads must be cleaned to remove the particles resulting from this abrasion.
If you have ever closely examined a 3.5″ diskette, you have seen the rectangular hole in the metal hub at the center of the diskette. The electromechanics of the disk drive use this hole to determine the location of the first sector, which is on the outermost edge of the disk.
Floppy disks are more uniform than fixed disks in their organization and operation. Consider, for example, the 3.5″ 1.44MB DOS/Windows diskette. Each sector of the floppy contains 512 data bytes. There are 18 sectors per track, and 80 tracks per side. Sector 0 is the boot sector of the disk. If the disk is bootable, this sector contains information that enables the system to start from the floppy disk instead of its fixed disk.
Immediately following the boot sector are two identical copies of the file allocation table (FAT). On standard 1.44MB disks, each FAT is nine sectors long. On 1.44MB floppies, a cluster (the addressable unit) consists of one sector, so there is one entry in the FAT for each data sector on the disk.
The disk root directory occupies 14 sectors starting at sector 19. Each root directory entry occupies 32 bytes, within which it stores a file name, the file attributes (archive, hidden, system, and so on), the file’s timestamp, the file size, and its starting cluster (sector) number. The starting cluster number points to an entry in the FAT that allows us to follow the chain of sectors spanned by the data file if it occupies more than one cluster.
A FAT is a simple table structure that keeps track of each cluster on the disk with bit patterns indicating whether the cluster is free, reserved, occupied by data, or bad. Because a 1.44MB disk contains 18 x 80 x 2 = 2880 sectors, each FAT entry needs 14 bits, just to point to a cluster. In fact, each FAT entry on a floppy disk is 16 bits wide, so the organization is known as FAT16. If a disk file spans more than one cluster, the first FAT entry for that file also contains a pointer to the next FAT entry for the file. If the FAT entry is the last sector for the file, the “next FAT entry” pointer contains an end of file marker. FAT’s linked list organization permits files to be stored on any set of free sectors, regardless of whether they are contiguous.
To make this idea clearer, consider the FAT entries given in Figure 7.12. As stated above, the FAT contains one entry for each cluster on the disk. Let’s say that our file occupies four sectors starting with sector 121. When we read this file, the following happens:
-
The disk directory is read to find the starting cluster (121). The first cluster is read to retrieve the first part of the file.
-
To find the rest of the file, the FAT entry in location 121 is read, giving the next data cluster of the file and FAT entry (124).
-
Cluster 124 and the FAT entry for cluster 124 are read. The FAT entry points to the next data at sector 126.
-
The data sector 126 and FAT entry 126 are read. The FAT entry points to the next data at sector 122.
-
The data sector 122 and FAT entry 122 are read. Upon seeing the <EOF> marker for the next data sector, the system knows it has obtained the last sector of the file.
It doesn’t take much thought to see the opportunities for performance improvement in the organization of FAT disks. This is why FAT is not used on high-performance, large-scale systems. FAT is still very useful for floppy disks for two reasons. First, performance isn’t a big concern for floppies. Second, floppies have standard capacities, unlike fixed disks for which capacity increases are practically a daily event. Thus, the simple FAT structures aren’t likely to cause the kinds of problems encountered with FAT16 as disk capacities started commonly exceeding 32 megabytes. Using 16-bit cluster pointers, a 33MB disk must have a cluster size of at least 1KB. As the drive capacity increases, FAT16 sectors get larger, wasting a large amount of disk space when small files do not occupy full clusters. Drives over 2GB require cluster sizes of 64KB!
Various vendors use a number of proprietary schemes to pack higher data densities onto floppy disks. The most popular among these technologies are Zip drives, pioneered by the Iomega Corporation, and several magneto-optical designs that combine the rewritable properties of magnetic storage with the precise read/write head positioning afforded by laser technology. For purposes of high-volume long-term data storage, however, floppy disks are quickly becoming outmoded by the arrival of inexpensive optical storage methods.
7.5 Optical Disks
Optical storage systems offer (practically) unlimited data storage at a cost that is competitive with tape. Optical disks come in a number of formats, the most popular format being the ubiquitous CD-ROM (compact disk-read only memory), which can hold over 0.5GB of data. CD-ROMs are a read-only medium, making them ideal for software and data distribution. CD-R (CD-recordable), CD-RW (CD-rewritable), and WORM (write once read many) disks are optical storage devices often used for long-term data archiving and high-volume data output. CD-R and WORM offer unlimited quantities of tamper-resistant storage for documents and data. For long-term archival storage of data, some computer systems send output directly to optical storage rather than paper or microfiche. This is called computer output laser disk (COLD). Robotic storage libraries called optical jukeboxes provide direct access to myriad optical disks. Jukeboxes can store dozens to hundreds of disks, for total capacities of 50GB to 1200GB and beyond. Proponents of optical storage claim that optical disks, unlike magnetic media, can be stored for 100 years without noticeable degradation. (Who could possibly challenge this claim?)
7.5.1 CD-ROM
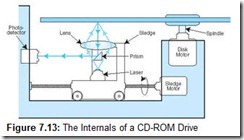
CD-ROMs are polycarbonate (plastic) disks 120 millimeters (4.8 inches) in diameter to which a reflective aluminum film is applied. The aluminum film is sealed with a protective acrylic coating to prevent abrasion and corrosion. The aluminum layer reflects light that emits from a green laser diode situated beneath the disk. The reflected light passes through a prism, which diverts the light into a photodetector. The photodetector converts pulses of light into electrical signals, which it sends to decoder electronics in the drive (see Figure 7.13).
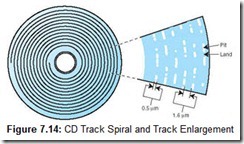
Compact disks are written from the center to the outside edge using a single spiraling track of bumps in the polycarbonate substrate. These bumps are called pits because they look like pits when viewed from the top surface of the CD. Lineal spaces between the pits are called lands. Pits measure 0.5 microns wide and are between 0.83 and 3.56 microns long. (The edges of the pits correspond to binary 1s.) The bump formed by the underside of a pit is as high as one-quarter of the wavelength of the light produced by the green laser diode. This means that the bump interferes with the reflection of the laser beam in such a way that the light bouncing off of the bump exactly cancels out light incident from the laser. This results in pulses of light and dark, which are interpreted by drive circuitry as binary digits.
The distance between adjacent turns of the spiral track, the track pitch, must be at least 1.6 microns (see Figure 7.14). If you could “unravel” a CD-ROM or audio CD track and lay it on the ground, the string of pits and lands would extend nearly 5 miles (8 km). (Being only 0.5 microns wide—less than half the thickness of a human hair—it would be barely visible with the unaided eye.)
Although a CD has only one track, a string of pits and lands spanning 360° of the disk is referred to as a track in most optical disk literature. Unlike magnetic storage, tracks at the center of the disk have the same bit density as tracks at the outer edge of the disk.
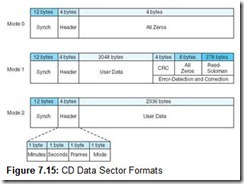
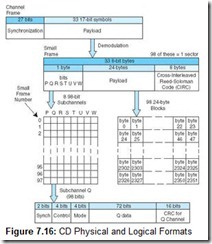
CD-ROMs were designed for storing music and other sequential audio signals. Data storage applications were an afterthought, as you can see by the data sector format in Figure 7.15. Data is stored in 2352-byte chunks called sectors that lie along the length of the track. Sectors are made up of 98 588-bit primitive units called channel frames. As shown in Figure 7.16, channel frames consist of synchronizing information, a header, and 33 17-bit symbols for a payload. The 17-bit symbols are encoded using an RLL(2, 10) code called EFM (eight-to-fourteen modulation). The disk drive electronics read and interpret (demodulate) channel frames to create yet another data structure called a small frame. Small frames are 33 bytes wide, 32 bytes of which are occupied by user data. The remaining byte is used for subchannel information. There are eight subchannels, named P, Q, R, S, T, U, V, and W. All except P (which denotes starting and stopping times) and Q (which contains control information) have meaning only for audio applications.
Most compact disks operate at constant linear velocity (CLV), which means that the rate at which sectors pass over the laser remains constant regardless of whether those sectors are at the beginning or the end of the disk. The constant velocity is achieved by spinning the disk faster when accessing the outermost tracks than the innermost. A sector number is addressable by the number of minutes and seconds of track that lie between it and the beginning (the center) of the disk. These “minutes and seconds” are calibrated under the assumption that the CD player processes 75 sectors per second. Computer CD-ROM drives are much faster than that with speeds up to 44 times (44X) the speed of audio CDs (with faster speeds sure to follow). To locate a particular sector, the sledge moves perpendicular to the disk track, taking its best guess as to where a particular sector may be. After an arbitrary sector is read, the head follows the track to the desired sector.
Sectors can have one of three different formats, depending on which mode is used to record the data. There are three different modes. Modes 0 and 2, intended for music recording, have no error correction capabilities. Mode 1, intended for data recording, sports two levels of error detection and correction. These formats are shown in Figure 7.15. The total capacity of a CD recorded in Mode 1 is 650MB. Modes 0 and 2 can hold 742MB, but cannot be used reliably for data recording.
The track pitch of a CD can be more than 1.6 microns when multiple sessions are used. Audio CDs have songs recorded in sessions, which, when viewed from below, give the appearance of broad concentric rings. When CDs began to be used for data storage, the idea of a music “recording session” was extended (without modification) to include data recording sessions. There can be as many as 99 sessions on CDs. Sessions are delimited by a 4500-sector (1 minute) lead-in that contains the table of contents for the data contained in the session and by a 6750 or 2250-sector lead-out (or runout) at the end. (The first session on the disk has 6750 sectors of lead-out. Subsequent sessions have the shorter lead-out.) On CD-ROMs, lead-outs are used to store directory information pertaining to the data contained within the session.
7.5.2 DVD
Digital versatile disks, or DVDs (formerly called digital video disks), can be thought of as quad-density CDs. DVDs rotate at about three times the speed of CDs. DVD pits are approximately half the size of CD pits (0.4 to 2.13 microns) and the track pitch is 0.74 microns. Like CDs, they come in recordable and nonrecordable varieties. Unlike CDs, DVDs can be single-sided or double-sided, called single layer or double layer. Single-layer and double-layer 120-millimeter DVDs can accommodate 4.7GB and 8.54GB of data, respectively. The 2048-byte DVD sector supports the same three data modes as CDs. With its greater data density and improved access time, one can expect that DVDs will eventually replace CDs for long-term data storage and distribution.
7.5.3 Optical Disk Recording Methods
Various technologies are used to enable recording on CDs and DVDs. The most inexpensive—and most pervasive—method uses heat-sensitive dye. The dye is sandwiched between the polycarbonate substrate and reflective coating on the CD. When struck by light emitting from the laser, this dye creates a pit in the polycarbonate substrate. This pit affects the optical properties of the reflective layer.
Rewritable optical media, such as CD-RW, replace the dye and reflective coating layers of a CD-R disk with a metallic alloy that includes such exotic elements as indium, tellurium, antimony, and silver. In its unaltered state, this metallic coating is reflective to the laser light. When heated by a laser to about 500°C, it undergoes a molecular change making it less reflective. (Chemists and physicists call this a phase change.) The coating reverts to its original reflective state when heated to only 200°C, thus allowing the data to be changed any number of times. (Industry experts have cautioned that phase-change CD recording may work for “only” 1000 cycles.)
WORM drives, commonly found on large systems, employ higher-powered lasers than can be reasonably attached to systems intended for individual use. Lower-powered lasers are subsequently used to read the data. The higher-powered lasers permit different—and more durable—recording methods. Three of these methods are:
-
Ablative: A high-powered laser melts a pit in a reflective metal coating sandwiched between the protective layers of the disk.
-
Bimetallic Alloy: Two metallic layers are encased between protective coatings on the surfaces of the disk. Laser light fuses the two metallic layers together, causing a reflectance change in the lower metallic layer. Bimetallic Alloy WORM disk manufacturers claim that this medium will maintain its integrity for 100 years.
-
Bubble-Forming: A single layer of thermally sensitive material is pressed between two plastic layers. When hit by high-powered laser light, bubbles form in the material, causing a reflectance change.
Despite their ability to use the same frame formats as CD-ROM, CD-R and CD-RW disks may not be readable in some CD-ROM drives. The incompatibility arises from the notion that CD-ROMs would be recorded (or pressed) in a single session. CD-Rs and CD-RWs, on the other hand, are most useful when they can be written incrementally like floppy disks. The first CD-ROM specification, ISO 9660, assumed single-session recording and has no provisions for allowing more than 99 sessions on the disk. Cognizant that the restrictions of ISO 9660 were inhibiting wider use of their products, a group of leading CD-R/CD-RW manufacturers formed a consortium to address the problem. The result of their efforts is the Universal Disk Format Specification (UDF), which allows an unlimited number of recording sessions for each disk. Key to this new format is the idea of replacing the table of contents associated with each session by a floating table of contents. This floating table of contents, called a virtual allocation table (VAT), is written to the lead-out following the last sector of user data written on the disk. As data is appended to what had been recorded in a previous session, the VAT is rewritten at the end of the new data. This process continues until the VAT reaches the last usable sectors on the disk.
7.6 Magnetic Tape
Magnetic tape is the oldest and most cost-effective of all mass-storage devices. First-generation magnetic tapes were made of the same material used by analog tape recorders. A cellulose-acetate film one-half inch wide (1.25 cm) was coated on one side with a magnetic oxide. Twelve hundred feet of this material was wound onto a reel, which then could be hand-threaded on a tape drive. These tape drives were approximately the size of a small refrigerator. Early tapes had capacities under 11MB, and required nearly a half hour to read or write the entire reel.
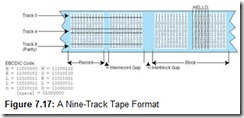
Data was written across the tape one byte at a time, creating one track for each bit. An additional track was added for parity, making the tape nine tracks wide, as shown in Figure 7.17. Nine-track tape used phase modulation coding with odd parity. The parity was odd to ensure that at least one “opposite” flux transition took place during long runs of zeros (nulls), characteristic of database records.
The evolution of tape technology over the years has been remarkable, with manufacturers constantly packing more bytes onto each linear inch of tape. Higher density tapes are not only more economical to purchase and store, but they also allow backups to be made more quickly. This means that if a system must be taken offline while its files are being copied, downtime is reduced. Further economies can be realized when data is compressed before being written to the tape. (See Section 7.8.)
The price paid for all of these innovative tape technologies is that a plethora of standards and proprietary techniques have emerged. Cartridges of various sizes and capacities have replaced nine-track open-reel tapes. Thin film coatings similar to those found on digital recording tape have replaced oxide coatings. Tapes support various track densities and employ serpentine or helical scan recording methods.
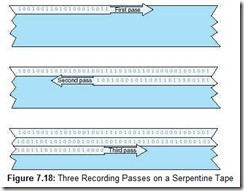
Serpentine recording methods place bits on the tape in series. Instead of the bytes being perpendicular to the edges of the tape, as in the nine-track format, they are written “lengthwise,” with each byte aligning in parallel with the edge of the tape. A stream of data is written along the length of the tape until the end is reached, then the tape reverses and the next track is written beneath the first one (see Figure 7.18). This process continues until the track capacity of the tape has been reached. Digital linear tape (DLT) and Quarter Inch Cartridge (QIC) systems use serpentine recording with 50 or more tracks per tape.
Digital audio tape (DAT) and 8mm tape systems use helical scan recording. In other recording systems, the tape passes straight across a fixed magnetic head in a manner similar to a tape recorder. DAT systems pass tape over a tilted rotating drum (capstan), which has two read heads and two write heads, as shown in Figure 7.19. (During write operations, the read heads verify the integrity of the data just after it has been written.) The capstan spins at 2,000 RPM in the direction opposite of the motion of the tape. (This configuration is similar to the mechanism used by VCRs.) The two read/write head assemblies write data at 40-degree angles to one another. Data written by the two heads overlaps, thus increasing the recording density. Helical scan systems tend to be slower, and the tapes are subject to more wear than serpentine systems with their simpler tape paths.
Tape storage has been a staple of mainframe environments from the beginning. Tapes appear to offer “infinite” storage at bargain prices. They continue to be the primary medium for making file and system backups on large systems. Although the medium itself is inexpensive, cataloging and handling costs can be substantial, especially when the tape library consists of thousands of tape volumes. Recognizing this problem, several vendors have produced a variety of robotic devices that can catalog, fetch, and load tapes in seconds. Robotic tape libraries, also known as tape silos, can be found in many large data centers. The largest robotic tape library systems have capacities in the hundreds of terabytes and can load a cartridge at user request in less than half a minute.
7.7 RAID
In the 30 years following the introduction of IBM’s RAMAC computer, only the largest computers were equipped with disk storage systems. Early disk drives were enormously costly and occupied a large amount of floor space in proportion to their storage capacity. They also required a strictly controlled environment: Too much heat would damage control circuitry, and low humidity caused static buildup that could scramble the magnetic flux polarizations on disk surfaces. Head crashes, or other irrecoverable failures, took an incalculable toll on business, scientific, and academic productivity. A head crash toward the end of the business day meant that all data input had to be redone to the point of the last backup, usually the night before.
Clearly, this situation was unacceptable and promised to grow even worse as everyone became increasingly reliant upon electronic data storage. A permanent remedy was a long time coming. After all, weren’t disks as reliable as we could make them? It turns out that making disks more reliable was only part of the solution.
In their 1988 paper “A Case for Redundant Arrays of Inexpensive Disks,” David Patterson, Garth Gibson, and Randy Katz of the University of California at Berkeley coined the word RAID. They showed how mainframe disk systems could realize both reliability and performance improvements if they would employ some number of “inexpensive” small disks (such as those used by microcomputers) instead of the single large expensive disks (SLEDs) typical of large systems. Because the term inexpensive is relative and can be misleading, the proper meaning of the acronym is now generally accepted as Redundant Array of Independent Disks.
In their paper, Patterson, Gibson, and Katz defined five types (called levels) of RAID, each having different performance and reliability characteristics. These original levels were numbered 1 through 5. Definitions for RAID levels 0 and 6 were later recognized. Various vendors have invented other levels, which may in the future become standards also. These are usually combinations of the generally accepted RAID levels. In this section, we briefly examine each of the seven RAID levels as well as a couple of hybrid systems that combine different RAID levels to meet particular performance or reliability objectives.
7.7.1 RAID Level 0
RAID Level 0, or RAID-0, places data blocks in stripes across several disk surfaces so that one record occupies sectors on several disk surfaces, as shown in Figure 7.20. This method is also called drive spanning, block interleave data striping, or disk striping. (Striping is simply the segmentation of logically sequential data so that segments are written across multiple physical devices. These segments can be as small as a single bit, as in RAID-0, or blocks of a specific size.)
Because it offers no redundancy, of all RAID configurations, RAID-0 offers the best performance, particularly if separate controllers and caches are used for each disk. RAID-0 is also very inexpensive. The problem with RAID-0 lies in the fact that the overall reliability of the system is only a fraction of what would be expected with a single disk. Specifically, if the array consists of five disks, each with a design life of 50,000 hours (about six years), the entire system has an expected design life of 50,000 / 5 = 10,000 hours (about 14 months). As the number of disks increases, the probability of failure increases to the point where it approaches certainty. RAID-0 offers no-fault tolerance as there is no redundancy. Therefore, the only advantage offered by RAID-0 is in performance. Its lack of reliability is downright scary. RAID-0 is recommended for non-critical data (or data that changes infrequently and is backed up regularly) that requires high-speed reads and writes, and low cost, and is used in applications such as video or image editing.
7.7.2 RAID Level 1
RAID Level 1, or RAID-1 (also known as disk mirroring), gives the best failure protection of all RAID schemes. Each time data is written it is duplicated onto a second set of drives called a mirror set, or shadow set (as shown in Figure 7.21). This arrangement offers acceptable performance, particularly when the mirror drives are synchronized 180° out of rotation with the primary drives. Although performance on writes is slower than that of RAID-0 (because the data has to be written twice), reads are much faster, because the system can read from the disk arm that happens to be closer to the target sector. This cuts rotational latency in half on reads. RAID-1 is best suited for transaction-oriented, high-availability environments, and other applications requiring high-fault tolerance, such as accounting or payroll.
7.7.3 RAID Level 2
The main problem with RAID-1 is that it is costly: You need twice as many disks to store a given amount of data. A better way might be to devote one or more disks to storing information about the data on the other disks. RAID-2 defines one of these methods.
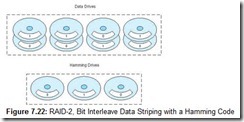
RAID-2 takes the idea of data striping to the extreme. Instead of writing data in blocks of arbitrary size, RAID-2 writes one bit per strip (as shown in Figure 7.22). This requires a minimum of eight surfaces just to accommodate the data. Additional drives are used for error-correction information generated using a Hamming code. The number of Hamming code drives needed to correct single-bit errors is proportionate to the log of the number of data drives to be protected. If any one of the drives in the array fails, the Hamming code words can be used to reconstruct the failed drive. (Obviously, the Hamming drive can be reconstructed using the data drives.)
Because one bit is written per drive, the entire RAID-2 disk set acts as though it were one large data disk. The total amount of available storage is the sum of the storage capacities of the data drives. All of the drives—including the Hamming drives—must be synchronized exactly, otherwise the data becomes scrambled and the Hamming drives do no good. Hamming code generation is time-consuming; thus RAID-2 is too slow for most commercial implementations. In fact, most hard drives today have built-in CRC error correction. RAID-2, however, forms the theoretical bridge between RAID-1 and RAID-3, both of which are used in the real world.
7.7.4 RAID Level 3
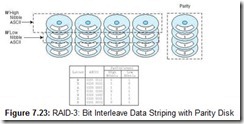
Like RAID-2, RAID-3 stripes (interleaves) data one bit at a time across all of the data drives. Unlike RAID-2, however, RAID-3 uses only one drive to hold a simple parity bit, as shown in Figure 7.23. The parity calculation can be done quickly in hardware using an exclusive OR (XOR) operation on each data bit (shown as bn) as follows (for even parity):
Parity = b0 XOR b1 XOR b2 XOR b3 XOR b4 XOR b5 XOR b6 XOR b7
Equivalently,
A failed drive can be reconstructed using the same calculation. For example, assume that drive number 6 fails and is replaced. The data on the other seven data drives and the parity drive are used as follows:
b6 = b0 XOR b1 XOR b2 XOR b3 XOR b4 XOR b5 XOR Parity XOR b7
RAID-3 requires the same duplication and synchronization as RAID-2, but is more economical than either RAID-1 or RAID-2 because it uses only one drive for data protection. RAID-3 has been used in some commercial systems over the years, but it is not well suited for transaction-oriented applications. RAID-3 is most useful for environments where large blocks of data would be read or written, such as with image or video processing.
7.7.5 RAID Level 4
RAID-4 is another “theoretical” RAID level (like RAID-2). RAID-4 would offer poor performance if it were implemented as Patterson et al. describe. A RAID-4 array, like RAID-3, consists of a group of data disks and a parity disk. Instead of writing data one bit at a time across all of the drives, RAID-4 writes data in strips of uniform size, creating a stripe across all of the drives, as described in RAID-0. Bits in the data strip are XORed with each other to create the parity strip.
You could think of RAID-4 as being RAID-0 with parity. However, adding parity results in a substantial performance penalty owing to contention with the parity disk. For example, suppose we want to write to Strip 3 of a stripe spanning five drives (four data, one parity), as shown in Figure 7.24. First we must read the data currently occupying Strip 3 as well as the parity strip. The old data is XORed with the new data to give the new parity. The data strip is then written along with the updated parity.
Imagine what happens if there are write requests waiting while we are twiddling the bits in the parity block, say one write request for Strip 1 and one for Strip 4. If we were using RAID-0 or RAID-1, both of these pending requests could have been serviced concurrently with the write to Strip 3. Thus, the parity drive becomes a bottleneck, robbing the system of all potential performance gains offered by multiple disk systems.
Some writers have suggested that the performance of RAID-4 can be improved if the size of the stripe is optimized with the record size of the data being written. Again, this might be fine for applications (such as voice or video processing) where the data occupy records of uniform size. However, most database applications involve records of widely varying size, making it impossible to find an “optimum” size for any substantial number of records in the database. Because of its expected poor performance, there are no commercial implementations of RAID-4.
7.7.6 RAID Level 5
Most people agree that RAID-4 would offer adequate protection against single-disk failure. The bottleneck caused by the parity drives, however, makes RAID-4 unsuitable for use in environments that require high transaction throughput. Certainly, throughput would be better if we could effect some sort of load balancing, writing parity to several disks instead of just one. This is what RAID-5 is all about. RAID-5 is RAID-4 with the parity disks spread throughout the entire array, as shown in Figure 7.25.
Because some requests can be serviced concurrently, RAID-5 provides the best read throughput of all of the parity models and gives acceptable throughput on write operations. For example, in Figure 7.25, the array could service a write to drive 4 Strip 6 concurrently with a write to drive 1 Strip 7 because these requests involve different sets of disk arms for both parity and data. However, RAID-5 requires the most complex disk controller of all levels.
Compared with other RAID systems, RAID-5 offers the best protection for the least cost. As such, it has been a commercial success, having the largest installed base of any of the RAID systems. Recommended applications include file and application servers, email and news servers, database servers, and Web servers.
7.7.7 RAID Level 6
Most of the RAID systems just discussed can tolerate at most one disk failure at a time. The trouble is that disk drive failures in large systems tend to come in clusters. There are two reasons for this. First, disk drives manufactured at approximately the same time reach the end of their expected useful life at approximately the same time. So if you are told that your new disk drives have a useful life of about six years, you can expect problems in year six, possibly concurrent failures.
Second, disk drive failures are often caused by a catastrophic event such as a power surge. A power surge hits all the drives at the same instant, the weakest ones failing first, followed closely by the next weakest, and so on. Sequential disk failures like these can extend over days or weeks. If they happen to occur within the Mean Time To Repair (MTTR), including call time and travel time, a second disk could fail before the first one is replaced, thereby rendering the whole array unserviceable and useless.
Systems that require high availability must be able to tolerate more than one concurrent drive failure, particularly if the MTTR is a large number. If an array can be designed to survive the concurrent failure of two drives, we effectively double the MTTR. RAID-1 offers this kind of survivability; in fact, as long as a disk and its mirror aren’t both wiped out, a RAID-1 array could survive the loss of half of its disks.
RAID-6 provides an economical answer to the problem of multiple disk failures. It does this by using two sets of error-correction strips for every rank (or horizontal row) of drives. A second level of protection is added with the use of Reed-Soloman error-correcting codes in addition to parity. Having two error-detecting strips per stripe does increase storage costs. If unprotected data could be stored on N drives, adding the protection of RAID-6 requires N + 2 drives. Because of the two-dimensional parity, RAID-6 offers very poor write performance. A RAID-6 configuration is shown in Figure 7.26.
Until recently, there were no commercial deployments of RAID-6. There are two reasons for this. First, there is a sizeable overhead penalty involved in generating the Reed-Soloman code. Second, twice as many read/write operations are required to update the error-correcting codes resident on the disk. IBM was first (and only, as of now) to bring RAID-6 to the marketplace with their RAMAC RVA 2 Turbo disk array. The RVA 2 Turbo array eliminates the write penalty of RAID-6 by keeping running “logs” of disk strips within cache memory on the disk controller. The log data permits the array to handle data one stripe at a time, calculating all parity and error codes for the entire stripe before it is written to the disk. Data is never rewritten to the same stripe that it occupied prior to the update. Instead, the formerly occupied stripe is marked as free space, once the updated stripe has been written elsewhere.
7.7.8 Hybrid RAID Systems
Many large systems are not limited to using only one type of RAID. In some cases, it makes sense to balance high-availability with economy. For example, we might want to use RAID-1 to protect the drives that contain our operating system files, whereas RAID-5 is sufficient for data files. RAID-0 would be good enough for “scratch” files used only temporarily during long processing runs and could potentially reduce the execution time of those runs owing to the faster disk access.
Sometimes RAID schemes can be combined to form a “new” kind of RAID. RAID-10 is one such system. It combines the striping of RAID-0 with the mirroring of RAID-1. Although enormously expensive, RAID-10 gives the best possible read performance while providing the best possible availability. Despite their cost, a few RAID-10 systems have been brought to market with some success.
After reading the foregoing sections, it should be clear to you that higher-numbered RAID levels are not necessarily “better” RAID systems. Nevertheless, many people have a natural tendency to think that a higher number of something always indicates something better than a lower number of something. For this reason, an industry association called the RAID Advisory Board (RAB) has recently reorganized and renamed the RAID systems that we have just presented. We have chosen to retain the “Berkeley” nomenclature in this book because it is more widely recognized.
7.8 Data Compression
No matter how cheap storage gets, no matter how much of it we buy, we never seem to be able to get enough of it. New huge disks fill rapidly with all the things we wish we could have put on the old disks. Before long, we are in the market for another set of new disks. Few people or corporations have access to unlimited resources, so we must make optimal use of what we have. One way to do this is to make our data more compact, compressing it before writing it to disk. (In fact, we could even use some kind of compression to make room for a parity or mirror set, adding RAID to our system for “free”!)
Data compression can do more than just save space. It can also save time and help to optimize resources. For example, if compression and decompression are done in the I/O processor, less time is required to move the data to and from the storage subsystem, freeing the I/O bus for other work.
The advantages offered by data compression in sending information over communication lines are obvious: less time to transmit and less storage on the host. Although a detailed study is beyond the scope of this book (see the references section for some resources), you should understand a few basic data compression concepts to complete your understanding of I/O and data storage.
When we evaluate various compression algorithms and compression hardware, we are often most concerned with how fast a compression algorithm executes and how much smaller a file becomes after the compression algorithm is applied. The compression factor (sometimes called compression ratio) is a statistic that can be calculated quickly and is understandable by virtually anyone who would care. There are a number of different methods used to compute a compression factor. We will use the following:
For example, suppose we start with a 100KB file and apply some kind of compression to it. After the algorithm terminates, the file is 40KB in size. We can say that the algorithm achieved a compression factor of: ![]()
for this particular file. An exhaustive statistical study should be undertaken before inferring that the algorithm would always produce 60% file compression. We can, however, determine an expected compression ratio for particular messages or message types once we have a little theoretical background.
The study of data compression techniques is a branch of a larger field of study called information theory. Information theory concerns itself with the way in which information is stored and coded. It was born in the late 1940s through the work of Claude Shannon, a scientist at Bell Laboratories. Shannon established a number of information metrics, the most fundamental of which is entropy. Entropy is the measure of information content in a message. Messages with higher entropy carry more information than messages with lower entropy. This definition implies that a message with lower information content would compress to a smaller size than a message with a higher information content.
Determining the entropy of a message requires that we first determine the frequency of each symbol within the message. It is easiest to think of the symbol frequencies in terms of probability. For example, in the famous program output statement:
HELLO WORLD!
the probability of the letter L appearing is ![]() or
or ![]() . In symbols, we have P(L) = 0.25. To map this probability to bits in a code word, we use the base-2 log of this probability. Specifically, the minimum number of bits required to encode the letter L is: log2 P(L) or 2. The entropy of the message is the weighted average of the number of bits required to encode each of the symbols in the message. If the probability of a symbol x appearing in a message is P(x), then the entropy, H, of the symbol x is:
. In symbols, we have P(L) = 0.25. To map this probability to bits in a code word, we use the base-2 log of this probability. Specifically, the minimum number of bits required to encode the letter L is: log2 P(L) or 2. The entropy of the message is the weighted average of the number of bits required to encode each of the symbols in the message. If the probability of a symbol x appearing in a message is P(x), then the entropy, H, of the symbol x is:
H = P(x) log2 P(x)
The average entropy over the entire message is the sum of the weighted probabilities of all n symbols of the message:
Entropy establishes a lower bound on the number of bits required to encode a message. Specifically, if we multiply the number of characters in the entire message by the weighted entropy, we get the theoretical minimum of the number of bits that are required to encode the message without loss of information. Bits in addition to this lower bound do not add information. They are therefore redundant. The objective of data compression is to remove redundancy while preserving information content. We can quantify the average redundancy for each character contained in a coded message of length n containing code words of length l by the formula:
This formula is most useful when we are comparing the effectiveness of one coding scheme over another for a given message. The code producing the message with the least amount of redundancy is the better code in terms of data compression. (Of course, we must also consider such things as speed and computational complexity as well as the specifics of the application before we can say that one method is better than another.)
Finding the entropy and redundancy for a text message is a straightforward application of the formula above. With a fixed-length code, such as ASCII or EBCDIC, the left-hand sum above is exactly the length of the code, usually 8 bits. In our HELLO WORLD! example (using the right-hand sum) we find the average symbol entropy is about 3.022. This means that if we reached the theoretical maximum entropy, we would need only 3.022 bits per character x 12 characters = 36.26 or 37 bits to encode the entire message. The 8-bit ASCII version of the message, therefore, carries 96 – 37 or 59 redundant bits.
7.8.1 Statistical Coding
The entropy metric just described can be used as a basis for devising codes that minimize redundancy in the compressed message. Generally, any application of statistical compression is a relatively slow and I/O-intensive process, requiring two passes to read the file before it is compressed and written.
Two passes over the file are needed because the first pass is used for tallying the number of occurrences of each symbol. These tallies are used to calculate probabilities for each different symbol in the source message. Values are assigned to each symbol in the source message according to the calculated probabilities. The newly assigned values are subsequently written to a file along with the information required to decode the file. If the encoded file—along with the table of values needed to decode the file—are smaller than the original file, we say that data compression has occurred.
Huffman and arithmetic coding are two fundamental statistical data compression methods. Variants of these methods can be found in a large number of popular data compression programs. We examine each of these in the next sections, starting with Huffman coding.
Huffman Coding
Suppose that after we determine probabilities for each of the symbols in the source message, we create a variable-length code that assigns the most frequently used symbols to the shortest code words. If the code words are shorter than the information words, it stands to reason that the resulting compressed message will be shorter as well. David A. Huffman formalized this idea in a paper published in 1952. Interestingly, one form of Huffman coding, Morse code, has been around since the early 1800s.
Morse code was designed using typical letter frequencies found in English writing. As you can see in Figure 7.27, the shorter codes represent the more frequently used letters in the English language. These frequencies clearly cannot apply to every single message. A notable exception would be a telegram from Uncle Zachary vacationing in Zanzibar, requesting a few quid so he can quaff a quart of quinine! Thus, the most accurate statistical model would be individualized for each message. To accurately assign code words, the Huffman algorithm builds a binary tree using symbol probabilities found in the source message. A traversal of the tree gives the bit pattern assignments for each symbol in the message. We illustrate this process using a simple nursery rhyme. For clarity, we render the rhyme in all uppercase with no punctuation as follows:
HIGGLETY PIGGLETY POP
THE DOG HAS EATEN THE MOP
THE PIGS IN A HURRY THE CATS IN A FLURRY
HIGGLETY PIGGLETY POP
We start by tabulating all occurrences of each letter in the rhyme. We will use the abbreviation <ws> (white space) for the space characters between each word as well as the newline characters (see Table 7.1).
These letter frequencies are associated with each letter using two nodes of a tree. The collection of these trees (a forest) is placed in a line ordered by the letter frequencies like this:
We begin building the binary tree by joining the nodes with the two smallest frequencies. Because we have a four-way tie for the smallest, we arbitrarily select the leftmost two nodes. The sum of the combined frequencies of these two nodes is two. We create a parent node labeled with this sum and place it back into the forest in the location determined by the label on the parent node, as shown:
We repeat the process for the nodes now having the lowest frequencies:
The two smallest nodes are the parents of F, M, C, and D. Taken together, they sum to a frequency of 4, which belongs in the fourth position from the left:
The leftmost pair combine to create a parent node with a frequency of 8. It is placed back in the forest as shown:
After several more iterations, the completed tree looks like this:
This tree establishes the framework for assigning a Huffman value to each symbol in the message. We start by labeling every right branch with a binary 1, then each left branch with a binary 0. The result of this step is shown below. (The frequency nodes have been removed for clarity.)
All that we need to do now is traverse the tree from its root to each leaf node, keeping track of the binary digits encountered along the way. The completed coding scheme is shown in Table 7.2.
As you can see, the symbols with the highest frequencies end up having the fewest bits in their code. The entropy of this message is approximately 3.82 bits per symbol. The theoretical lower bound compression for this message is therefore 110 symbols x 3.82 bits = 421 bits. This Huffman code renders the message in 426 bits, or about 1% more than is theoretically necessary.
Arithmetic Coding
Huffman coding cannot always achieve theoretically optimal compression because it is restricted to using an integral number of bits in the resulting code. In the nursery rhyme in the previous section, the entropy of the symbol S is approximately 1.58. An optimal code would use 1.58 bits to encode each occurrence of S. With Huffman coding, we are restricted to using at least 2 bits for this purpose. This lack of precision cost us a total of 5 redundant bits in the end. Not too bad, but it seems we could do better.
Huffman coding falls short of optimality because it is trying to map probabilities—which are elements of the set of real numbers—to elements of a small subset of the set of integers. We are bound to have problems! So why not devise some sort of real-to-real mapping to achieve data compression? In 1963, Norman Abramson conceived of such a mapping, which was subsequently published by Peter Elias. This real-to-real data compression method is called arithmetic coding.
Conceptually, arithmetic coding partitions the real number line in the interval between 0 and 1 using the probabilities in the symbol set of the message. More frequently used symbols get a larger chunk of the interval.
Returning to our favorite program output, HELLO WORLD!, we see that there are 12 characters in this imperative statement. The lowest probability among the symbols is ![]() . All other probabilities are a multiple of
. All other probabilities are a multiple of ![]() . Thus, we divide the 0 – 1 interval into 12 parts. Each of the symbols except L and O are assigned
. Thus, we divide the 0 – 1 interval into 12 parts. Each of the symbols except L and O are assigned ![]() of the interval. L and O get
of the interval. L and O get ![]() and
and ![]() , respectively. Our probability-to-interval mapping is shown in Table 7.3.
, respectively. Our probability-to-interval mapping is shown in Table 7.3.
We encode a message by successively dividing a range of values (starting with 0.0 through 1.0) proportionate to the interval assigned to the symbol. For example, if the “current interval” is ![]() and the letter L gets
and the letter L gets ![]() of the current interval, as shown above, then to encode the L, we multiply
of the current interval, as shown above, then to encode the L, we multiply ![]() by
by ![]() , giving
, giving ![]() as the new current interval. If the next character is another L,
as the new current interval. If the next character is another L, ![]() is multiplied
is multiplied ![]() by yielding
by yielding ![]() for the current interval. We proceed in this vein until the entire message is encoded. This process becomes clear after studying the pseudocode below. A trace of the pseudocode for HELLO WORLD! is given in Figure 7.28.
for the current interval. We proceed in this vein until the entire message is encoded. This process becomes clear after studying the pseudocode below. A trace of the pseudocode for HELLO WORLD! is given in Figure 7.28.
ALGORITHM Arith_Code (Message)
  HiVal ¬ 1.0         /* Upper limit of interval. */
  LoVal ¬ 0.0        /* Lower limit of interval. */
  WHILE (more characters to process)
       Char ¬ Next message character
       Interval ¬ HiVal – LoVal
       CharHiVal ¬ Upper interval limit for Char
       CharLoVal ¬ Lower interval limit for Char
       HiVal ¬ LoVal +  Interval * CharHiVal
       LoVal ¬ LoVal +  Interval * CharLoVal
  ENDWHILE
  OUTPUT (LoVal)
END Arith_Code
The message is decoded using the same process in reverse, as shown by the pseudocode that follows. A trace of the pseudocode is given in Figure 7.29.
ALGORITHM Arith_Decode (CodedMsg)
    Finished ¬ FALSE
    WHILE NOT Finished
       FoundChar ¬ FALSE    /*  We could do this search much more    */
       WHILE NOT FoundChar      /* efficiently in a real implementation. */
          PossibleChar ¬ next symbol from the code table
          CharHiVal ¬ Upper interval limit for PossibleChar
          CharLoVal ¬ Lower interval limit for PossibleChar
          IF CodedMsg < CharHiVal AND CodedMsg > CharLoVal THEN
             FoundChar ¬ TRUE
          ENDIF    / * We now have a character whose interval  */
       ENDWHILE    /* surrounds the current message value.     */
       OUTPUT(Matching Char)
       Interval ¬ CharHiVal – CharLoVal
    CodedMsgInterval ¬ CodedMsg - CharLoVal
    CodedMsg ¬ CodedMsgInterval / Interval
    IF CodedMsg = 0.0 THEN
       Finished ¬ TRUE
    ENDIF
END WHILE
END Arith_Decode
You may have noticed that neither of the arithmetic coding/decoding algorithms contains any error checking. We have done this for the sake of clarity. Real implementations must guard against floating point underflow in addition to making sure that the number of bits in the result are sufficient for the entropy of the information.
Differences in floating point representations can also cause the algorithm to miss the zero condition when the message is being decoded. In fact, an end-of-message character is usually inserted at the end of the message during the coding process to prevent such problems during decoding.
7.8.2 Ziv-Lempel (LZ) Dictionary Systems
Although arithmetic coding can produce nearly optimal compression, it is even slower than Huffman coding because of the floating-point operations that must be performed during both the encoding and decoding processes. If speed is our first concern, we might wish to consider other compression methods, even if it means that we can’t achieve a perfect code. Surely, we would gain considerable speed if we could avoid scanning the input message twice. This is what dictionary methods are all about.
Jacob Ziv and Abraham Lempel pioneered the idea of building a dictionary during the process of reading information and writing encoded bytes. The output of dictionary-based algorithms contains either literals or pointers to information that has previously been placed in the dictionary. Where there is substantial “local” redundancy in the data, such as long strings of spaces or zeros, dictionary-based techniques work exceptionally well. Although referred to as LZ dictionary systems, the name “Ziv-Lempel” is preferred to “Lempel-Ziv” when using the authors’ full names.
Ziv and Lempel published their first algorithm in 1977. This algorithm, known as the LZ77 compression algorithm, uses a text window in conjunction with a look-ahead buffer. The look ahead buffer contains the information to be encoded. The text window serves as the dictionary. If any characters inside the look-ahead buffer can be found in the dictionary, the location and length of the text in the window is written to the output. If the text cannot be found, the unencoded symbol is written with a flag indicating that the symbol should be used as a literal.
There are many variants of LZ77, all of which build on one basic idea. We will explain this basic version through an example, using another nursery rhyme. We have replaced all spaces by underscores for clarity:
STAR_LIGHT_STAR_BRIGHT_
FIRST_STAR_I_SEE_TONIGHT_
I_WISH_I_MAY_I_WISH_I_MIGHT_
GET_THE_WISH_I_WISH_TONIGHT
For illustrative purposes, we will use a 32-byte text window and a 16-byte look-ahead buffer. (In practice, these two areas usually span several kilobytes.) The text is first read into the look-ahead buffer. Having nothing in the text window yet, the S is placed in the text window and a triplet composed of:
-
The offset to the text in the text window
-
The length of the string that has been matched
-
The first symbol in the look-ahead buffer that follows the phrase
In the example above, there is no match in the text, so the offset and string length are both zeros. The next character in the look-ahead buffer also has no match, so it is also written as a literal with index and length both zero.
We continue writing literals until a T appears as the first character of the lookahead buffer. This matches the T that is in position 1 of the text window. The character following the T in the look-ahead buffer is an underscore, which is the third item in the triplet that is written to the output.
The look-ahead buffer now shifts by two characters. STAR_ is now at the beginning of the look-ahead buffer. It has a match at the first character position (position 0) of the text window. We write 0, 5, B because B is the character following STAR_ in the buffer.
We shift the look-ahead buffer by six characters, and look for a match on the R. We find one at position 3 of the text, writing 3, 1, I.
GHT is now at the beginning of the buffer. It matches four characters in the text starting at position 7. We write, 7, 4, F.
After a few more iterations, the text window is nearly full:
After we match STAR_ with the characters at position 0 of the text, the six characters, STAR_I, shift out of the buffer and into the text window. In order to accommodate all six characters, the text window must shift to the right by three characters after we process STAR_.
After writing the code for STAR_I and shifting the windows, _S is at the beginning of the buffer. These characters match with the text at position 7.
Continuing in this manner, we ultimately come to the end of the text. The last characters to be processed are IGHT. These match the text at position 4. Because there are no characters after IGHT in the buffer, the last triple written is tagged with an end of file character, <EOF>.
A total of 36 triples are written to the output in this example. Using a text window of 32 bytes, the index needs only 5 bits to point to any text character. Because the look-ahead buffer is 16 bytes wide, the longest string that we can match is 16 bytes, so we require a maximum of 4 bits to store the length. Using 5 bits for the index, 4 bits for the string length, and 7 bits for each ASCII character, each triple requires 16 bits, or 2 bytes. The rhyme contains 103 characters, which would have been stored in 103 uncompressed bytes on disk. The compressed message requires only 72 bytes, giving us a compression factor of ![]() .
.
It stands to reason that if we make the text window larger, we increase the likelihood of finding matches with the characters in the look-ahead buffer. For example, the string _TONIGHT occurs at the forty-first position of the rhyme and again at position 96. Because there are 48 characters between the two occurrences of _TONIGHT, the first occurrence cannot possibly be used as a dictionary entry for the second occurrence if we use a 32-character text window. Enlarging the text window to 64 bytes allows the first _TONIGHT to be used to encode the second one, and it would add only one bit to each coded triple. In this example, however, an expanded 64-byte text window decreases the output by only two triples: from 36 to 34. Because the text window requires 7 bits for the index, each triple would consist of 17 bits. The compressed message then occupies a total of 17 x 34 = 578 bits or about 73 bytes. Therefore, the larger text window actually costs us a few bits in this example.
A degenerate condition occurs when there are no matches whatsoever between the text and the buffer during the compression process. For instance, if we would have used a 36-character string consisting of all the letters of the alphabet and the digits 0 through 9, ABC . . . XYZ012 . . . 9, we would have had no matches in our example. The output of the algorithm would have been 36 triples of the form, 0,0,?. We would have ended up with an output triple the size of the original string, or an expansion of 200%.
Fortunately, exceptional cases like the one just cited happen rarely in practice. Variants of LZ77 can be found in a number of popular compression utilities, including the ubiquitous PKZIP. IBM’s RAMAC RVA 2 Turbo disk array implements LZ77 directly in the disk control circuitry. This compression takes place at hardware speeds, making it completely transparent to users.
Dictionary-based compression has been an active area of research since Ziv and Lempel published their algorithm in 1977. One year later, Ziv and Lempel improved on their own work when they published their second dictionary-based algorithm, now known as LZ78. LZ78 differs from LZ77 in that it removes the limitation of the fixed-size text window. Instead, it creates a special tree data structure called a trie, which is populated by tokens as they are read from the input. (Each interior node of the tree can have as many children as it needs.) Instead of writing characters to the disk as in LZ77, LZ78 writes pointers to the tokens in the trie. The entire trie is written to disk following the encoded message, and read first before decoding the message. (See Appendix A for more information regarding tries.)
7.8.3 GIF Compression
Efficient management of the trie of tokens is the greatest challenge for LZ78 implementations. If the dictionary gets too large, the pointers can become larger than the original data. A number of solutions to this problem have been found, one of which has been the source of acrimonious debate and legal action.
In 1984, Terry Welsh, an employee of the Sperry Computer Corporation (now Unisys), published a paper describing an effective algorithm for managing an LZ78-style dictionary. His solution, which involves controlling the sizes of the tokens used in the trie, is called LZW data compression, for Lempel-Ziv-Welsh. LZW compression is the fundamental algorithm behind the graphics interchange format, GIF (pronounced “jiff”), developed by CompuServe engineers and popularized by the World Wide Web. Because Welsh devised his algorithm as part of his official duties at Sperry, Unisys exercised its right to place a patent on it. It has subsequently requested small royalties each time a GIF is used by service providers or high-volume users. LZW is not specific to GIF. It is also used in the TIFF image format, other compression programs (including Unix Compress), various software applications (such as Postscript and PDF), and hardware devices (most notably modems). Not surprisingly, the royalty request of Unisys has not been well received within the Web community, some sites blazing with vows to boycott GIFs in perpetuity. Cooler heads have simply circumvented the issue by producing better (or at least different) algorithms, one of which is PNG, Portable Network Graphics.
Royalty disputes alone did not “cause” PNG (pronounced “ping”) to come into being, but they undoubtedly hastened its development. In a matter of months in 1995, PNG went from a draft to an accepted international standard. Amazingly, the PNG specification has had only two minor revisions as of 2002.
PNG offers many improvements over GIF including:
-
User-selectable compression modes: “Faster” or “better” on a scale of 0 to 3, respectively
-
Improved compression ratios over GIF, typically 5% to 25% better
-
Error detection provided by a 32-bit CRC (ISO 3309/ITU-142)
-
Faster initial presentation in progressive display mode
-
An open international standard, freely available and sanctioned by the World Wide Web Consortium (W3C) as well as many other organizations and businesses
PNG uses two levels of compression: First, information is reduced using Huffman coding. The Huffman code is then followed by LZ77 compression using a 32KB text window.
GIF can do one thing that PNG cannot: Support multiple images in the same file, giving the illusion of animation (albeit stiffly). To correct this limitation, the Internet community produced the Multiple-image Network Graphics algorithm (or MNG, pronounced “ming”). MNG is an extension of PNG that allows multiple images to be compressed into one file. These files can be of any type, such as gray scale, true color, or even JPEGs (see the next section). Version 1.0 of MNG was released in January 2001, with refinements and enhancements sure to follow. PNG and MNG both being freely available (with source code!) over the Internet, one is inclined to think it is only a matter of time before the GIF issue becomes passé.
7.8.4 JPEG Compression
When we see a graphic image such as a photograph on a printed page or computer screen, what we are really looking at is a collection of small dots called pixels or picture elements. Pixels are particularly noticeable in low-image-quality media like newspapers and comic books. When pixels are small and packed closely together, our eyes perceive a “good quality” image. “Good quality,” being a subjective measure, starts at about 300 pixels per inch (120 pixels/cm). On the high end, most people would agree that an image of 1600 pixels per inch (640 pixels/cm) is “good,” if not excellent.
Pixels contain the binary coding for the image in a form that can be interpreted by display and printer hardware. Pixels can be coded using any number of bits. If, for example, we are producing a black and white line drawing, we can do so using one bit per pixel. The bit is either black (pixel = 0) or white (pixel = 1). If we decide that we’d rather have a grayscale image, we need to think about how many shades of gray will suffice. If we want to have eight shades of gray, we need three bits per pixel. Black would be 000, white 111. Anything in between would be some shade of gray.
Color pixels are produced using a combination of red, green, and blue components. If we want to render an image using eight different shades each of red, green, and blue, we must use three bits for each color component. Hence, we need nine bits per pixel, giving 29 – 1 different colors. Black would still be all zeros: R = 000, G = 000, B = 000; white would still be all ones: R = 111, G = 111, B = 111. “Pure” green would be R = 000, G = 111, B = 000. R = 011, G = 000, B = 101 would give us some shade of purple. Yellow would be produced by R = 111, G = 111, B = 000. The more bits that we use to represent each color, the closer we get to the “true color” that we see around us. Many computer systems approximate true color using eight bits per color—rendering 256 different shades of each. These 24-bit pixels can display about 16 million different colors.
Let’s say that we wish to store a 4 inch x 6 inch (10cm x 15cm) photographic image in such a way as to give us “reasonably” good quality when it is viewed or printed. Using 24 bits (3 bytes) per pixel at 300 pixels per inch, we need 300 x 300 x 6 x 4 x 3 = 6.48MB to store the image. If this 4 inch x 6 inch photo is part of a sales brochure posted on the Web, we would risk losing customers with dial-up modems once they realize that 20 minutes have passed and they still have not completed downloading the brochure. At 1600 pixels per inch, storage balloons to just under 1.5GB, which is practically impossible to download and store.
JPEG is a compression algorithm designed specifically to address this problem. Fortunately, photographic images contain a considerable amount of redundant information. Furthermore, some of the information having high theoretical entropy is often of no consequence to the integrity of the image. With these ideas in mind, the ISO and ITU together commissioned a group to formulate an international image compression standard. This group is called the Joint Photographic Experts Group, or JPEG, pronounced “jay-peg.” The first JPEG standard, 10928-1, was finalized in 1992. Major revisions and enhancements to this standard were begun in 1997. The new standard is called JPEG2000 and was finalized in December 2000.
JPEG is a collection of algorithms that provides excellent compression at the expense of some image information loss. Up to this point, we have been describing lossless data compression: The data restored from the compressed sequence is precisely the same as it was before compression, barring any computational or media errors. Sometimes we can achieve much better compression if a little information loss can be tolerated. Photographic images lend themselves particularly well to lossy data compression because of the human eye’s ability to compensate for minor imperfections in graphical images. Of course, some images carry real information, and should be subjected to lossy compression only after “quality” has been carefully defined. Medical diagnostic images such as x-rays and electrocardiograms fall into this class. Family album and sales brochure photographs, however, are the kinds of images that can lose considerable “information,” while retaining their illusion of visual “quality.”
One of the salient features of JPEG is that the user can control the amount of information loss by supplying parameters prior to compressing the image. Even at 100% fidelity, JPEG produces remarkable compression. At 75% the “lost” information is barely noticeable and the image file is a small fraction of its original size. Figure 7.30 shows a gray-scale image compressed using different quality parameters. (The original 7.14KB bitmap was used as input with the stated quality parameters.)
As you can see, the lossiness of JPEG becomes problematic only when using the lowest quality factors. You’ll also notice how the image takes on the appearance of a crossword puzzle when it is at its highest compression. The reason for this becomes clear once you understand how JPEG works.
When compressing color images, the first thing that JPEG does is to convert the RGB components to the domain of luminance and chrominance, where luminance is the brightness of the color and chrominance is the color itself. The human eye is less sensitive to chrominance than luminance, so the resulting code is constructed so that the luminance component is least likely to be lost during the subsequent compression steps. Grayscale images do not require this step.
Next, the image is divided into square blocks of eight pixels on each side. These 64-pixel blocks are converted from the spatial domain (x, y) to a frequency domain (i, j) using a discrete cosine transform (DCT) as follows:
The output of this transform is an 8×8 matrix of integers ranging from –1024 to 1023. The pixel at i = 0, j = 0 is called the DC coefficient and it contains a weighted average of the values of the 64 pixels in the original block. The other 63 values are called AC coefficients. Owing to the behavior of the cosine function (cos 0 = 1), the resulting frequency matrix, the (i, j) matrix, has a concentration of low numbers and zeros in the lower right-hand corner. Larger numbers collect toward the upper left-hand corner of the matrix. This pattern lends itself well to many different compression methods, but we’re not quite ready for that step.
Before the frequency matrix is compressed, each value in the matrix is divided by its corresponding element in a quantization matrix. The purpose of the quantization step is to reduce the 11-bit output of the DCT to an 8-bit value. This is the lossy step in JPEG, the degree of which is selectable by the user. The JPEG specification gives several quantization matrices, any of which may be used at the discretion of the implementer. All of these standard matrices assure that the frequency matrix elements containing the most information (those toward the upper left-hand corner) lose the least amount of their information during the quantization step.
Following the quantization step, the frequency matrix is sparse—containing more zero than nonzero entries—in the lower right-hand corner. Large blocks of identical values can be compressed easily using run-length coding.
Run-length coding is a simple compression method where instead of coding XXXXX, we code 5,X to indicate a run of five Xs. When we store 5,X instead of XXXXX, we save three bytes, not including any delimiters that the method might require. Clearly, the most effective way of doing this is to try to align everything so that we get as many of the zero values adjacent to each other as we can. JPEG achieves this by doing a zig-zag scan of the frequency matrix. The result of this step is a one-dimensional matrix (a vector) that usually contains a long run of zeros. Figure 7.31 illustrates how the zig-zag scan works.
Each of the AC coefficients in the vector are compressed using run-length coding. The DC coefficient is coded as the arithmetic difference between its original value and the DC coefficient of the previous block, if there is one.
The resulting run-length encoded vector is further compressed using either Huffman or arithmetic coding. Huffman coding is the preferred method owing to a number of patents on the arithmetic algorithms.
Figure 7.32 summarizes the steps that we have just described for the JPEG algorithm. Decompression is achieved by reversing this process.
JPEG2000 offers a number of improvements over the JPEG standard of 1997. The underlying mathematics are more sophisticated, which permits greater flexibility with regard to quantization parameters and the incorporation of multiple images into one JPEG file. One of the most striking features of JPEG2000 is its ability to allow user definition of regions of interest. A region of interest is an area within an image that serves as a focal point, and would not be subjected to the same degree of lossy compression as the rest of the image. If, for example, you had a photograph of a friend standing on the shore of a lake, you would tell JPEG2000 that your friend is a region of interest. The background of the lake and the trees could be compressed to a great degree before they would lose definition. The image of your friend, however, would remain clear—if not enhanced—by a lower-quality background.
JPEG2000 replaces the discrete cosine transform of JPEG with a wavelet transform. (Wavelets are a different way of sampling and encoding an image or any set of signals.) Quantization in JPEG2000 uses a sine function rather than the simple division of the earlier version. These more sophisticated mathematical manipulations require substantially more processor resources than JPEG, causing noticeable performance degradation. Until the performance issues are resolved, JPEG2000 will be used only where the value of its unique features offset the cost of increased computational power. (Equivalently, JPEG2000 will be used when the decreased cost of computational power makes its sluggish performance irrelevant.)
Chapter Summary
This chapter has given you a broad overview of many aspects of computer input/output and storage systems. You have learned that different classes of machines require different I/O architectures. Large systems store and access data in ways that are fundamentally different from the methods used by smaller computers.
This chapter has illustrated how data is stored on a variety of media, including magnetic tape, disk, and optical media. Your understanding of magnetic disk operations will be particularly useful to you if you are ever in a position to analyze disk performance within the context of programming, system design, or problem diagnosis.
Our discussion of RAID systems should help you to understand how RAID can provide both improved performance and increased availability for systems upon which we all depend.
You have also seen a few of the ways in which data can be compressed. Data compression can help economize on disk and tape usage as well as reduce transmission time in data communications. An understanding of the specifics of these compression methods will help you to select the best method for a particular application. Our brief introduction to the ideas of information theory may help to prepare you for further work in computer science.
We hope that throughout our discussions, you have gained an appreciation for the tradeoffs that are involved with virtually every system decision. You have seen how we must often make choices between “better” and “faster,” and “faster” and “cheaper” in so many of the areas that we have just studied. As you assume leadership in systems projects, you must be certain that your customers understand these tradeoffs as well. Often you need the tact of a diplomat to thoroughly convince your clients that there is no such thing as a free lunch.
Review of Essential Terms and Concepts
-
State Amdahl’s Law in words.
-
What is speedup?
-
What is a protocol, and why is it important in I/O bus technology?
-
Name three types of durable storage.
-
Explain how programmed I/O is different from interrupt-driven I/O.
-
What is polling?
-
How are address vectors used in interrupt-driven I/O?
-
How does direct memory access (DMA) work?
-
What is a bus master?
-
Why does DMA require cycle stealing?
-
What does it mean when someone refers to I/O as bursty?
-
How is channel I/O different from interrupt-driven I/O?
-
What is multiplexing?
-
What distinguishes an asynchronous bus from a synchronous bus?
-
What is settle time, and what can be done about it?
-
Why are magnetic disks called direct access devices?
-
Explain the relationship among disk platters, tracks, sectors, and clusters.
-
What are the major physical components of a rigid disk drive?
-
What is zoned-bit recording?
-
What is seek time?
-
What is the sum of rotational delay and seek time called?
-
What is a file allocation table (FAT), and where is it found on a floppy disk?
-
By what order of magnitude does a rigid disk rotate more than a flexible disk?
-
What is the name for robotic optical disk library devices?
-
What is the acronym for computer output that is written directly to optical media rather than paper or microfiche?
-
Magnetic disks store bytes by changing the polarity of a magnetic medium. How do optical disks store bytes?
-
How is the format of a CD that stores music different from the format of a CD that stores data? How are the formats alike?
-
Why are CDs especially useful for long-term data storage?
-
Do CDs that store data use recording sessions?
-
How do DVDs store so much more data than regular CDs?
-
Name the three methods for recording WORM disks.
-
Why is magnetic tape a popular storage medium?
-
Explain how serpentine recording differs from helical scan recording.
-
What are two popular tape formats that use serpentine recording?
-
Which RAID levels offer the best performance?
-
Which RAID levels offer the best economy while providing adequate redundancy?
-
Which RAID level uses a mirror (shadow) set?
-
What are hybrid RAID systems?
-
Who was the founder of the science of information theory?
-
What is information entropy and how does it relate to information redundancy?
-
Name an advantage and a disadvantage of statistical coding.
-
Name two types of statistical coding.
-
The LZ77 compression algorithm falls into which class of data compression algorithms?
Exercises
-
Hints and Answers Your friend has just bought a new personal computer. She tells you that her new system runs at 1GHz, which makes it over three times faster than her old 300MHz system. What would you tell her?
-
Suppose the daytime processing load consists of 60% CPU activity and 40% disk activity. Your customers are complaining that the system is slow. After doing some research, you learn that you can upgrade your disks for $8,000 to make them 2.5 times as fast as they are currently. You have also learned that you can upgrade your CPU to make it 1.4 times as fast for $5,000.
-
Which would you choose to yield the best performance improvement for the least amount of money?
-
Which option would you choose if you don’t care about the money, but want a faster system?
-
What is the break-even point for the upgrades? That is, what price would be charged for both upgrades to make their cost and performance improvement equal?
-
-
Hints and Answers How would you answer Question 2 if the system activity consists of 55% processor time and 45% disk activity?
-
Name the four types of I/O architectures. Where are each of these typically used and why are they used there?
-
A CPU with interrupt-driven I/O is busy servicing a disk request. While the CPU is midway through the disk-service routine, another I/O interrupt occurs.
-
Hints and Answers What happens next?
-
Hints and Answers Is it a problem?
-
Hints and Answers If not, why not? If so, what can be done about it?
-
-
Why are I/O buses provided with clock signals?
-
If an address bus needs to be able to address eight devices, how many conductors will be required? What if each of those devices also needs to be able to talk back to the I/O control device?
-
We pointed out that I/O buses do not need separate address lines. Construct a timing diagram similar to Figure 7.7 that describes the handshake between an I/O controller and a disk controller for a write operation. (Hint: You will need to add a control signal.)
-
Asterisk Mark If each interval shown in Figure 7.7 is 50 nanoseconds, how long would it take to transfer 10 bytes of data? Devise a bus protocol, using as many control lines as you need, that would reduce the time required for this transfer to take place. What happens if the address lines are eliminated and the data bus is used for addressing instead? (Hint: An additional control line may be needed.)
-
Define the terms seek time, rotational delay, and transfer time. Explain their relationship.
-
Hints and Answers Why do you think the term random access device is something of a misnomer for disk drives?
-
Why do differing systems place disk directories in different track locations on the disk? What are the advantages of using each location that you cited?
-
Hints and Answers Verify the average latency rate cited in the disk specification of Figure 7.11. Why is the calculation divided by 2?
-
By inspection of the disk specification in Figure 7.11, what can you say about whether the disk drive uses zoned-bit recording?
-
The disk specification in Figure 7.11 gives a data transfer rate of 6.0MB per second when reading from the disk, and 11.1MB per second when writing to the disk. Why are these numbers different?
-
Do you trust disk drive MTTF figures? Explain.
-
Suppose a disk drive has the following characteristics:
-
4 surfaces
-
1024 tracks per surface
-
128 sectors per track
-
512 bytes/sector
-
Track-to-track seek time of 5 milliseconds
-
Rotational speed of 5000 RPM.
-
Hints and Answers What is the capacity of the drive?
-
Hints and Answers What is the access time?
-
-
Suppose a disk drive has the following characteristics:
-
5 surfaces
-
1024 tracks per surface
-
256 sectors per track
-
512 bytes/sector
-
Track-to-track seek time of 8 milliseconds
-
Rotational speed of 7500 RPM.
-
What is the capacity of the drive?
-
What is the access time?
-
Is this disk faster than the one described in Question 17? Explain.
-
-
What are the advantages and disadvantages of having a small number of sectors per disk cluster?
-
Asterisk Mark Suggest some ways in which the performance of a 1.44MB floppy disk could be improved.
-
What is the maximum number of root directory entries on a 1.44MB floppy? Why?
-
How does the organization of an optical disk differ from the organization of a magnetic disk?
-
Discuss the difference between how DLT and DAT record data. Why would you say that one is better than the other?
-
How would the error-correction requirements of an optical document storage system differ from the error-correction requirements of the same information stored in textual form? What are the advantages offered by having different levels of error correction for optical storage devices?
-
You have a need to archive a large amount of data. You are trying to decide whether to use tape or optical storage methods. What are the characteristics of this data and how it is used that will influence your decision?
-
Asterisk Mark A particular high-performance computer system has been functioning as an e-business server on the Web. This system supports $10,000 per hour in gross business volume. It has been estimated that the net profit per hour is $1,200. In other words, if the system goes down, the company will lose $1,200 every hour until repairs are made. Furthermore, any data on the damaged disk would be lost. Some of this data could be retrieved from the previous night’s backups, but the rest would be gone forever. Conceivably, a poorly timed disk crash could cost your company hundreds of thousands of dollars in immediate revenue loss, and untold thousands in permanent business loss. The fact that this system is not using any type of RAID is disturbing to you.
Although your chief concern is data integrity and system availability, others in your group are obsessed with system performance. They feel that more revenue would be lost in the long run if the system slowed down after RAID is installed. They have stated specifically that a system with RAID performing at half the speed of the current system would result in gross revenue dollars per hour declining to $5,000 per hour.
In total, 80% of the system e-business activity involves a database transaction. The database transactions consist of 60% reads and 40% writes. On average, disk access time is 20ms.
The disks on this system are nearly full and are nearing the end of their expected life, so new ones must be ordered soon. You feel that this is a good time to try to install RAID, even though you’ll need to buy extra disks. The disks that are suitable for your system cost $2,000 for each 10 gigabyte spindle. The average access time of these new disks is 15ms with an MTTF of 20,000 hours and an MTTR of 4 hours. You have projected that you will need 60 gigabytes of storage to accommodate the existing data as well as the expected data growth over the next 5 years. (All of the disks will be replaced.)
-
Are the people who are against adding RAID to the system correct in their assertion that 50% slower disks will result in revenues declining to $5,000 per hour? Justify your answer.
-
What would be the average disk access time on your system if you decide to use RAID-1?
-
What would be the average disk access time on your system using a RAID-5 array with two sets of four disks if 25% of the database transactions must wait behind one transaction for the disk to become free?
-
Which configuration has a better cost-justification, RAID-1 or RAID-5? Explain your answer.
-
-
-
Which of the RAID systems described in this chapter cannot tolerate a single disk failure?
-
Which can tolerate more than one simultaneous disk failure?
-
-
Compute the compression factors for each of the JPEG images in Figure 7.30.
-
Create a Huffman tree and assign Huffman codes for the “Star Bright” rhyme used in Section 7.8.2. Use <ws> for whitespace instead of underscores.
-
Complete the LZ77 data compression illustrated in Section 7.8.2.
-
JPEG is a poor choice for compressing line drawings, such as the one shown in Figure 7.30. Why do you think this is the case? What other compression methods would you suggest? Give justification for your choice(s).
-
-
Name an advantage of Huffman coding over LZ77.
-
Name an advantage of LZ77 over Huffman coding.
-
Which is better?
-
-
State one feature of PNG that you could use to convince someone that PNG is a better algorithm than GIF.

