Introduction to Friction

Friction

Introduction to Friction

When an object, such as a block of wood, is placed on a floor and sufficient force is applied to the block, the force being parallel to the floor, the block slides across the floor. When the force is removed, motion of the block stops; thus there is a force which resists sliding. This force is called dynamic or sliding friction. A force may be applied to the block, which is insufficient to move it. In this case, the force resisting motion is called the static friction or striction. Thus there are two categories into which a frictional force may be split:

(i) dynamic or sliding friction force which occurs when motion is taking place, and

(ii) static friction force which occurs before motion takes place

There are three factors that affect the size and direction of frictional forces:

(i) The size of the frictional force depends on the type of surface (a block of wood slides more easily on a polished metal surface than on a rough concrete surface).

(ii) The size of the frictional force depends on the size of the force acting at right angles to the surfaces in contact, called the normal force; thus, if the weight of a block of wood is doubled, the frictional force is doubled when it is sliding on the same surface.

(iii) The direction of the frictional force is always opposite to the direction of motion. Thus the frictional force opposes motion, as shown in Figure 16.1.

image

Coefficient of Friction

The coefficient of friction, µ, is a measure of the amount of friction existing between two surfaces. A low value of coefficient of friction indicates that the force required for sliding to occur is less than the force required when the coefficient of friction is high. The value of the coefficient of friction is

image

The direction of the forces given in this equation is as shown in Figure 16.2 The coefficient of friction is the ratio of a force to a force, and hence has no units. Typical values for the coefficient of friction when sliding is occurring, i.e. the dynamic coefficient of friction, are:

image

For example, the material of a brake is being tested and it is found that the dynamic coefficient of friction between the material and steel is 0.91. The normal force, when the frictional force is 0.728 kN, is calculated as follows:

image

Applications of Friction

In some applications, a low coefficient of friction is desirable, for example, in bearings, pistons moving within cylinders, on ski runs, and so on. However, for such applications as force being transmitted by belt drives and braking systems, a high value of coefficient is necessary.

Advantages and Disadvantages of Frictional Forces

Instances where frictional forces are an advantage include:

(i) Almost all fastening devices rely on frictional forces to keep them in place once secured, examples being screws, nails, nuts, clips and clamps.

(ii) Satisfactory operation of brakes and clutches rely on frictional forces

being present.

(iii) In the absence of frictional forces, most accelerations along a horizontal surface are impossible; for example, a person’s shoes just slip when

walking is attempted and the tyres of a car just rotate with no forward

motion of the car being experienced.

Disadvantages of frictional forces include:

(i) Energy is wasted in the bearings associated with shafts, axles and gears due to heat being generated.

(ii) Wear is caused by friction, for example, in shoes, brake lining materials

and bearings.

(iii) Energy is wasted when motion through air occurs (it is much easier to cycle with the wind rather than against it).

Design Implications

Two examples of design implications, which arise due to frictional forces and how lubrication may or may not help, are:

(i) Bearings are made of an alloy called white metal, which has a relatively low melting point. When the rotating shaft rubs on the white metal bearing, heat is generated by friction, often in one spot and the white metal may melt in this area, rendering the bearing useless. Adequate lubrication (oil or grease) separates the shaft from the white metal, keeps the coefficient of friction small and prevents damage to the bearing. For very large bearings, oil is pumped under pressure into the bearing and the oil is used to remove the heat generated, often passing through oil coolers before being re- circulated. Designers should ensure that the heat generated by friction can be dissipated.

(ii) Wheels driving belts, to transmit force from one place to another, are used in many workshops. The coefficient of friction between the wheel and the belt must be high, and dressing the belt with a tar-like substance may increase it. Since frictional force is proportional to the normal force, a slipping belt is made more efficient by tightening it, thus increasing the normal and hence the frictional force. Designers should incorporate some belt tension mechanism into the design of such a system.


Simply Supported Beams

Simply Supported Beams

The Moment of a Force

When using a spanner to tighten a nut, a force tends to turn the nut in a clockwise direction. This turning effect of a force is called the moment of a force or more briefly, a moment. The size of the moment acting on the nut depends on two factors:

(a) the size of the force acting at right angles to the shank of the spanner, and

(b) the perpendicular distance between the point of application of the force and the centre of the nut.

In general, with reference to Figure 12.1, the moment M of a force acting about a point P is force ð perpendicular distance between the line of action of the force and P, i.e.

M = F × d

The unit of a moment is the newton metre (Nm). Thus, if force F in Figure 12.1 is 7 N and distance d is 3 m, then the moment M is 7 N ð 3 m, i.e. 21 Nm.

Equilibrium and the Principle of Moments

If more than one force is acting on an object and the forces do not act at a single point, then the turning effect of the forces, that is, the moment of the forces, must be considered.

Figure 12.2 shows a beam with its support (known as its pivot or ful- crum) at P, acting vertically upwards, and forces F1 and F2 acting vertically downwards at distances a and b, respectively, from the fulcrum.

A beam is said to be in equilibrium when there is no tendency for it to move. There are two conditions for equilibrium:

image

(i) The sum of the forces acting vertically downwards must be equal to the sum of the forces acting vertically upwards, i.e. for Figure 12.2,

Rp = F1 +F2

(ii) The total moment of the forces acting on a beam must be zero; for the total moment to be zero:

the sum of the clockwise moments about any point must be equal to the sum of the anticlockwise moments about that point

This statement is known as the principle of moments. Hence, taking moments about P in Figure 12.2,

F2 ð b D the clockwise moment, and F1 ð a D the anticlockwise moment

clip_image006Thus for equilibrium: F1 a = F2b

For example, for the centrally supported uniform beam shown in Figure 12.3, to determine the values of forces F1 and F2 when the beam is in equilibrium:

image

Simply Supported Beams Having Point Loads

A simply supported beam is one that rests on two supports and is free to move horizontally.

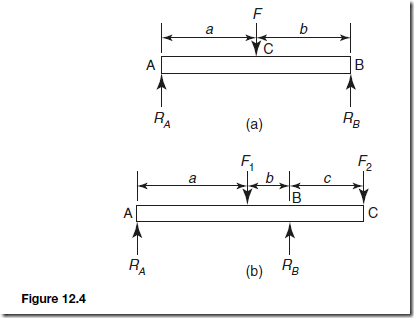
Two typical simply supported beams having loads acting at given points on the beam, called point loading, are shown in Figure 12.4

A man whose mass exerts a force F vertically downwards, standing on a wooden plank which is simply supported at its ends, may, for example, be represented by the beam diagram of Figure 12.4(a) if the mass of the plank is neglected. The forces exerted by the supports on the plank, RA and RB, act vertically upwards, and are called reactions.

When the forces acting are all in one plane, the algebraic sum of the moments can be taken about any point.

For the beam in Figure 12.4(a) at equilibrium:

image

Typical practical applications of simply supported beams with point loadings include bridges, beams in buildings, and beds of machine tools.

For example, for the beam shown in Figure 12.5, the force acting on support A, RA, and distance d, neglecting any forces arising from the mass of the beam, are calculated as follows:

image

image


Simply Supported Beams

Simply Supported Beams

The Moment of a Force

When using a spanner to tighten a nut, a force tends to turn the nut in a clockwise direction. This turning effect of a force is called the moment of a force or more briefly, a moment. The size of the moment acting on the nut depends on two factors:

(a) the size of the force acting at right angles to the shank of the spanner, and

(b) the perpendicular distance between the point of application of the force and the centre of the nut.

In general, with reference to Figure 12.1, the moment M of a force acting about a point P is force ð perpendicular distance between the line of action of the force and P, i.e.

M = F × d

The unit of a moment is the newton metre (Nm). Thus, if force F in Figure 12.1 is 7 N and distance d is 3 m, then the moment M is 7 N ð 3 m, i.e. 21 Nm.

Equilibrium and the Principle of Moments

If more than one force is acting on an object and the forces do not act at a single point, then the turning effect of the forces, that is, the moment of the forces, must be considered.

Figure 12.2 shows a beam with its support (known as its pivot or ful- crum) at P, acting vertically upwards, and forces F1 and F2 acting vertically downwards at distances a and b, respectively, from the fulcrum.

A beam is said to be in equilibrium when there is no tendency for it to move. There are two conditions for equilibrium:

image

(i) The sum of the forces acting vertically downwards must be equal to the sum of the forces acting vertically upwards, i.e. for Figure 12.2,

Rp = F1 +F2

(ii) The total moment of the forces acting on a beam must be zero; for the total moment to be zero:

the sum of the clockwise moments about any point must be equal to the sum of the anticlockwise moments about that point

This statement is known as the principle of moments. Hence, taking moments about P in Figure 12.2,

F2 ð b D the clockwise moment, and F1 ð a D the anticlockwise moment

clip_image006Thus for equilibrium: F1 a = F2b

For example, for the centrally supported uniform beam shown in Figure 12.3, to determine the values of forces F1 and F2 when the beam is in equilibrium:

image

Simply Supported Beams Having Point Loads

A simply supported beam is one that rests on two supports and is free to move horizontally.

Two typical simply supported beams having loads acting at given points on the beam, called point loading, are shown in Figure 12.4

A man whose mass exerts a force F vertically downwards, standing on a wooden plank which is simply supported at its ends, may, for example, be represented by the beam diagram of Figure 12.4(a) if the mass of the plank is neglected. The forces exerted by the supports on the plank, RA and RB, act vertically upwards, and are called reactions.

When the forces acting are all in one plane, the algebraic sum of the moments can be taken about any point.

For the beam in Figure 12.4(a) at equilibrium:

image

Typical practical applications of simply supported beams with point loadings include bridges, beams in buildings, and beds of machine tools.

For example, for the beam shown in Figure 12.5, the force acting on support A, RA, and distance d, neglecting any forces arising from the mass of the beam, are calculated as follows:

image

image


Bending Stress

Bending Stress

A fundamental equation for the bending of beams is:

image

The second moments of area of the beam sections most commonly met with are (about the central axis XX):

image

image

The neutral axis of any section, where bending produces no strain and therefore no stress, always passes through the centroid of the section. For the symmetrical sections listed above this means that for vertical loading the neutral axis is the horizontal axis of symmetry.

For example, let the maximum bending moment on a beam be 120 Nm. If the beam section is rectangular 18 mm wide and 36 mm deep, the maximum

bending stress is calculated as follows:

Second moment of area of section about the neutral axis,

image

Maximum distance from neutral axisimage

image

 In another example, a cantilever is of tubular construction with internal and external diameters of 100 mm and 120 mm. If the length of the cantilever is 800 mm, the maximum load which it can carry at its free end if the maximum stress is not to exceed 50 MPa (assuming the weight of the beam is ignored) is determined as follows:

The second moment of area of the section is

image

If W is the load (in kN) at the free end of the cantilever, the bending moment at a point distance x from the free end is Wx with a maximum value where the cantilever is built into the wall, given by:

W kN x 0.8 m = 0.8 W kNm

Equating this to the calculated maximum permissible bending moment gives:

image


Bending Stress

Bending Stress

A fundamental equation for the bending of beams is:

image

The second moments of area of the beam sections most commonly met with are (about the central axis XX):

image

image

The neutral axis of any section, where bending produces no strain and therefore no stress, always passes through the centroid of the section. For the symmetrical sections listed above this means that for vertical loading the neutral axis is the horizontal axis of symmetry.

For example, let the maximum bending moment on a beam be 120 Nm. If the beam section is rectangular 18 mm wide and 36 mm deep, the maximum

bending stress is calculated as follows:

Second moment of area of section about the neutral axis,

image

Maximum distance from neutral axisimage

image

 In another example, a cantilever is of tubular construction with internal and external diameters of 100 mm and 120 mm. If the length of the cantilever is 800 mm, the maximum load which it can carry at its free end if the maximum stress is not to exceed 50 MPa (assuming the weight of the beam is ignored) is determined as follows:

The second moment of area of the section is

image

If W is the load (in kN) at the free end of the cantilever, the bending moment at a point distance x from the free end is Wx with a maximum value where the cantilever is built into the wall, given by:

W kN x 0.8 m = 0.8 W kNm

Equating this to the calculated maximum permissible bending moment gives:

image


Shearing Force and Bending Moments

Shearing Force

For equilibrium of a beam, the forces to the left of any section such as X in Figure 13.1, must balance the forces to the right. Also, the moment about X of the forces to the left must balance the moments about X of the forces to the right.

Although for equilibrium the forces and moments cancel, the magnitude

and nature of these forces and moments are important as they determine both the stresses at X and the beam curvature and deflection. The resultant force to the left of X and the resultant force to the right of X (forces or components of forces transverse to the beam) constitute a pair of forces tending to shear the beam at this section. Shearing force is defined as the force transverse to the beam at a given section tending to cause it to shear at that section.

By convention, if the tendency is to shear as shown in Figure 13.2(a), the

shearing force is regarded as positive, i.e. CF; if the tendency to shear is as shown in Figure 13.2(b), it is regarded as negative, i.e. ðF.

Bending Moment

The bending moment at a given section of a beam is defined as the resultant moment about that section of either all of the forces to its left — or of all

image

image

of the forces to its right. In Figure 13.1 it is MX or M0 . These moments, clockwise to the left and anticlockwise to the right, will cause the beam to bend concave upwards, called ‘sagging’. By convention this is regarded as positive bending (i.e. bending moments is a positive bending moment). Where the curvature produced is concave downwards, called ‘hogging’, the bending moment is regarded as negative.

The values of shearing force and bending moment will usually vary along a beam. Diagrams showing the shearing force and bending moment for all sections of a beam are called shearing force and bending moment diagrams respectively.

Shearing forces and shearing force diagrams are less important than bending moments, but can be very useful in giving pointers to the more important bending moment diagrams. For example, wherever the shearing force is zero, the bending moment will be a maximum or minimum.

For example, the shearing force and bending moment diagrams for the beam shown in Figure 13.3 are obtained as follows:

It is first necessary to calculate the reactions at A and B. The beam is simply supported at A and B, which means that it rests on supports at these points giving vertical reactions. The general conditions for equilibrium require

that the resultant moment about any point must be zero, and total upward

force must equal total downward force. Therefore, taking moments about A, the moment RB must balance the moment of the load at C:

image

Immediately to the right of A the shearing force is due to RA and is therefore 9 kN. As this force to the left of the section considered is upwards, the shearing force is positive. The shearing force is the same for all points between A and C as no other forces come on the beam between these points.

When a point to the right of C is considered, the load at C as well as RA must be considered, or alternatively, RB on its own. The shearing force is 15 kN, either obtained from RB D 15 kN, or from load at C ð RA D 15 kN. For any point between C and B the force to the right is upwards and the shearing force is therefore negative. It should be noted that the shearing force changes suddenly at C.

image

The bending moment at A is zero, as there are no forces to the left. At a point 1 m to the right of A the moment of the only force RA to the left of the point is RA ð 1 m D 9 kNm. At this moment to the left is clockwise the bending moment is positive, i.e. it is C9 kNm. At points 2 m, 3 m, 4 m and 5 m to the right of A the bending moments are respectively:

image

All are positive bending moments.

For points to the right of C, the load at C as well as RA must be considered or, more simply, RB alone can be used. At points 5 m, 6 m and 7 m from A, the bending moments are respectively:

image

As these moments to the right of the points considered are anticlock- wise they are all positive bending moments. At B the bending moment is zero as there is no force to its right. The results are summarised in the table below:

image

image

Making use of the above values, the diagrams are as shown in Figure 13.4. A stepped shearing force diagram, with horizontal and vertical lines only, is always obtained when the beam carries concentrated loads only. A sudden change in shearing force occurs where the concentrated loads, including the reactions at supports, occur. For this type of simple loading the bending moment diagram always consists of straight lines, usually sloping. Sudden changes of bending moment cannot occur except in the unusual circumstances of a moment being supplied to a beam as distinct from a load.


Forces Acting at a Point

Forces

When forces are all acting in the same plane, they are called coplanar. When forces act at the same time and at the same point, they are called concurrent forces.

Force is a vector quantity and thus has both a magnitude and a direction. A vector can be represented graphically by a line drawn to scale in the direction of the line of action of the force.

To distinguish between vector and scalar quantities, various ways are used, as detailed in chapter 3. The method adopted in this chapter is to denote vector quantities in bold print.

Thus, ab in Figure 11.1 represents a force of 5 newtons acting in a direction due east.

image

The Resultant of Two Coplanar Forces

For two forces acting at a point, there are three possibilities.

(a) For forces acting in the same direction and having the same line of action, the single force having the same effect as both of the forces, called the resultant force or just the resultant, is the arithmetic sum of the separate forces. Forces of F1 and F2 acting at point P, as shown in Figure 11.2(a), have exactly the same effect on point P as force F shown in Figure 11.2(b),

image

image

where F D F1 C F2 and acts in the same direction as F1 and F2. Thus F is the resultant of F1 and F2

(b) For forces acting in opposite directions along the same line of action, the resultant force is the arithmetic difference between the two forces. Forces of F1 and F2 acting at point P as shown in Figure 11.3(a) have exactly the same effect on point P as force F shown in Figure 11.3(b), where F D F2 Ł F1 and acts in the direction of F2, since F2 is greater than F1 .

Thus F is the resultant of F1 and F2

(c) When two forces do not have the same line of action, the magnitude and direction of the resultant force may be found by a procedure called vector addition of forces. There are two graphical methods of performing vector addition, known as the triangle of forces method and the parallelogram of forces method.

Triangle of Forces Method

A simple procedure for the triangle of forces method of vector addition is as follows:

(i) Draw a vector representing one of the forces, using an appropriate scale and in the direction of its line of action.

(ii) From the nose of this vector and using the same scale, draw a vector representing the second force in the direction of its line of action.

(iii) The resultant vector is represented in both magnitude and direction by the vector drawn from the tail of the first vector to the nose of the second vector.

For example, to determine the magnitude and direction of the resultant of a force of 15 N acting horizontally to the right and a force of 20 N inclined at an angle of 60° to the 15 N force using the triangle of forces method:

Using the above procedure and with reference to Figure 11.4

(i) ab is drawn 15 units long horizontally

(ii) from b, bc is drawn 20 units long, inclined at an angle of 60° to ab (Note, in angular measure, an angle of 60° from ab means 60° in an anticlockwise direction)

image

(iii) by measurement, the resultant ac is 30.5 units long inclined at an angle of 35° to ab.

Hence, the resultant force is 30.5 N, inclined at an angle of 35° to the 15 N force.

The Parallelogram of Forces Method

A simple procedure for the parallelogram of forces method of vector addition is as follows:

(i) Draw a vector representing one of the forces, using an appropriate scale and in the direction of its line of action.

(ii) From the tail of this vector and using the same scale draw a vector representing the second force in the direction of its line of action.

(iii) Complete the parallelogram using the two vectors drawn in (i) and (ii) as two sides of the parallelogram.

(iv) The resultant force is represented in both magnitude and direction by the vector corresponding to the diagonal of the parallelogram drawn from the tail of the vectors in (i) and (ii)

For example, to find the magnitude and direction of the resultant of a force of 250 N acting at an angle of 135° and a force of 400 N acting at an angle of Ł120° using the parallelogram of forces method:

From the above procedure and with reference to Figure 11.5:

(i) ab is drawn at an angle of 135° and 250 units in length

(ii) ac is drawn at an angle of Ł120° and 400 units in length

(iii) bd and cd are drawn to complete the parallelogram

(iv) ad is drawn. By measurement, ad is 413 units long at an angle of Ł156° .

Hence, the resultant force is 413 N at an angle of −156°

image

Resultant of Coplanar Forces by Calculation

An alternative to the graphical methods of determining the resultant of two coplanar forces is by calculation. This can be achieved by trigonometry using the cosine rule and the sine rule, or by resolution of forces (see later).

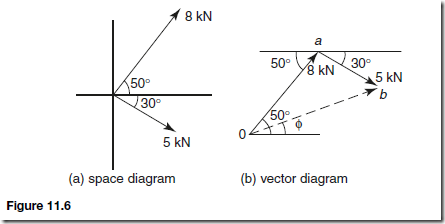
For example, to determine the magnitude and direction of the resultant of a force of 8 kN acting at an angle of 50° to the horizontal and a force of 5 kN acting at an angle of Ł30° to the horizontal using the cosine and sine rules:

The space diagram is shown in Figure 11.6(a). A sketch is made of the vector diagram, oa representing the 8 kN force in magnitude and direction and ab representing the 5 kN force in magnitude and direction. The resultant is given by length ob. By the cosine rule,

image

image

Hence the resultant of the two forces is 10.14 kN acting at an angle of 20.95° to the horizontal

Resultant of more than Two Coplanar Forces

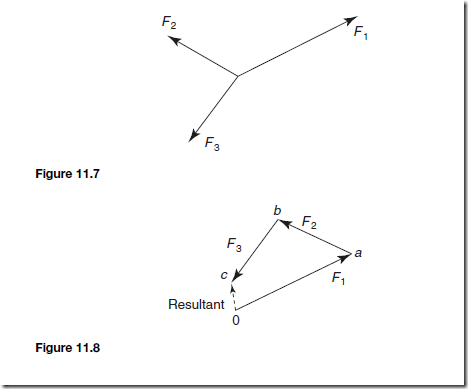
For the three coplanar forces F1, F2 and F3 acting at a point as shown in Figure 11.7, the vector diagram is drawn using the nose-to-tail method.

The procedure is:

(i) Draw oa to scale to represent force F1 in both magnitude and direction (see Figure 11.8)

(ii) From the nose of oa, draw ab to represent force F2
image

(iii) From the nose of ab, draw bc to represent force F3

(iv) The resultant vector is given by length oc in Figure 11.8. The direction

of resultant oc is from where we started, i.e. point o, to where we fin- ished, i.e. point c. When acting by itself, the resultant force, given by oc, has the same effect on the point as forces F1, F2 and F3 have when acting together. The resulting vector diagram of Figure 11.8 is called the polygon of forces.

For example, three coplanar forces acting at a point are: force A, 12 N acting horizontally to the right, force B, 7 N inclined at 60° to force A, and force C, 15 N inclined at 150° to force A. The magnitude and direction of their resultant is determined graphically as follows:

The space diagram is shown in Figure 11.9. The vector diagram, shown in Figure 11.10, is produced as follows:

(i) oa represents the 12 N force in magnitude and direction

(ii) From the nose of oa, ab is drawn inclined at 60° to oa and 7 units long

(iii) From the nose of ab, bc is drawn 15 units long inclined at 150° to oa

(i.e. 150° to the horizontal)

(iv) oc represents the resultant; by measurement, the resultant is 13.8 N inclined at ¢ D 80° to the horizontal

Thus the resultant of the three forces, FA, FB and FC is a force of 13.8 N at 80° to the horizontal

image

image

Coplanar Forces in Equilibrium

When three or more coplanar forces are acting at a point and the vector diagram closes, there is no resultant. The forces acting at the point are in equilibrium.

For example, five coplanar forces are acting on a body and the body is in equilibrium. The forces are: 12 kN acting horizontally to the right, 18 kN acting at an angle of 75°, 7 kN acting at an angle of 165°, 16 kN acting from the nose of the 7 kN force, and 15 kN acting from the nose of the 16 kN force. To determine the directions of the 16 kN and 15 kN forces relative to the 12 kN force:

With reference to Figure 11.11, oa is drawn 12 units long horizontally to the right. From point a, ab is drawn 18 units long at an angle of 75°. From b, bc is drawn 7 units long at an angle of 165° . The direction of the 16 kN force is not known, thus arc pq is drawn with a compass, with centre at c, radius 16 units. Since the forces are at equilibrium, the polygon of forces must close.

Using a compass with centre at 0, arc rs is drawn having a radius 15 units.

The point where the arcs intersect is at d.

By measurement, angle

image

Thus the 16 kN force acts at an angle of 198° (or −162° ) to the 12 kN force, and the 15 kN force acts at an angle of 291° (or −69°) to the 12 kN force.

Resolution of Forces

A vector quantity may be expressed in terms of its horizontal and vertical components.

For example, a vector representing a force of 10 N at an angle of 60° to the horizontal is shown in Figure 11.12. If the horizontal line oa and the vertical line ab are constructed as shown, then oa is called the horizontal component of the 10 N force, and ab the vertical component of the 10 N force.

image

This process is called finding the horizontal and vertical components of a vector or the resolution of a vector, and can be used as an alternative to graphical methods for calculating the resultant of two or more coplanar forces acting at a point.

For example, to calculate the resultant of a 10 N force acting at 60° to the horizontal and a 20 N force acting at Ł30° to the horizontal (see Figure 11.13) the procedure is as follows:

image

image

Hence the resultant of the 10 N and 20 N forces shown in Figure 11.13 is 22.36 N at an angle of −3.44° to the horizontal.

The above example demonstrates the use of resolution of forces for calculating the resultant of two coplanar forces acting at a point. However, the method may also be used for more than two forces acting at a point.

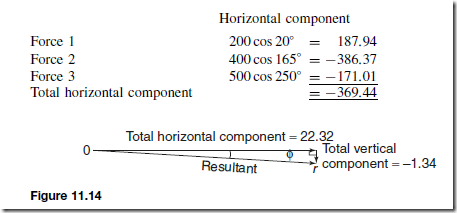
For example, three coplanar forces acting at a point are: 200 N acting at 20° to the horizontal, 400 N acting at 165° to the horizontal, and 500 N acting at 250° to the horizontal. To determine by resolution of forces the resultant of the forces:

A tabular approach using a calculator may be made as shown below.
image

image

Summary

(a) To determine the resultant of two coplanar forces acting at a point, four methods are commonly used. They are:

by drawing:

(1) triangle of forces method, and

(2) parallelogram of forces method, and

by calculation:

(3) use of cosine and sine rules, and

(4) resolution of forces

(b) To determine the resultant of more than two coplanar forces acting at a point, two methods are commonly used. They are:

by drawing:

(1) polygon of forces method, and

by calculation:

(2) resolution of forces


Forces Acting at a Point

Forces

When forces are all acting in the same plane, they are called coplanar. When forces act at the same time and at the same point, they are called concurrent forces.

Force is a vector quantity and thus has both a magnitude and a direction. A vector can be represented graphically by a line drawn to scale in the direction of the line of action of the force.

To distinguish between vector and scalar quantities, various ways are used, as detailed in chapter 3. The method adopted in this chapter is to denote vector quantities in bold print.

Thus, ab in Figure 11.1 represents a force of 5 newtons acting in a direction due east.

image

The Resultant of Two Coplanar Forces

For two forces acting at a point, there are three possibilities.

(a) For forces acting in the same direction and having the same line of action, the single force having the same effect as both of the forces, called the resultant force or just the resultant, is the arithmetic sum of the separate forces. Forces of F1 and F2 acting at point P, as shown in Figure 11.2(a), have exactly the same effect on point P as force F shown in Figure 11.2(b),

image

image

where F D F1 C F2 and acts in the same direction as F1 and F2. Thus F is the resultant of F1 and F2

(b) For forces acting in opposite directions along the same line of action, the resultant force is the arithmetic difference between the two forces. Forces of F1 and F2 acting at point P as shown in Figure 11.3(a) have exactly the same effect on point P as force F shown in Figure 11.3(b), where F D F2 Ł F1 and acts in the direction of F2, since F2 is greater than F1 .

Thus F is the resultant of F1 and F2

(c) When two forces do not have the same line of action, the magnitude and direction of the resultant force may be found by a procedure called vector addition of forces. There are two graphical methods of performing vector addition, known as the triangle of forces method and the parallelogram of forces method.

Triangle of Forces Method

A simple procedure for the triangle of forces method of vector addition is as follows:

(i) Draw a vector representing one of the forces, using an appropriate scale and in the direction of its line of action.

(ii) From the nose of this vector and using the same scale, draw a vector representing the second force in the direction of its line of action.

(iii) The resultant vector is represented in both magnitude and direction by the vector drawn from the tail of the first vector to the nose of the second vector.

For example, to determine the magnitude and direction of the resultant of a force of 15 N acting horizontally to the right and a force of 20 N inclined at an angle of 60° to the 15 N force using the triangle of forces method:

Using the above procedure and with reference to Figure 11.4

(i) ab is drawn 15 units long horizontally

(ii) from b, bc is drawn 20 units long, inclined at an angle of 60° to ab (Note, in angular measure, an angle of 60° from ab means 60° in an anticlockwise direction)

image

(iii) by measurement, the resultant ac is 30.5 units long inclined at an angle of 35° to ab.

Hence, the resultant force is 30.5 N, inclined at an angle of 35° to the 15 N force.

The Parallelogram of Forces Method

A simple procedure for the parallelogram of forces method of vector addition is as follows:

(i) Draw a vector representing one of the forces, using an appropriate scale and in the direction of its line of action.

(ii) From the tail of this vector and using the same scale draw a vector representing the second force in the direction of its line of action.

(iii) Complete the parallelogram using the two vectors drawn in (i) and (ii) as two sides of the parallelogram.

(iv) The resultant force is represented in both magnitude and direction by the vector corresponding to the diagonal of the parallelogram drawn from the tail of the vectors in (i) and (ii)

For example, to find the magnitude and direction of the resultant of a force of 250 N acting at an angle of 135° and a force of 400 N acting at an angle of Ł120° using the parallelogram of forces method:

From the above procedure and with reference to Figure 11.5:

(i) ab is drawn at an angle of 135° and 250 units in length

(ii) ac is drawn at an angle of Ł120° and 400 units in length

(iii) bd and cd are drawn to complete the parallelogram

(iv) ad is drawn. By measurement, ad is 413 units long at an angle of Ł156° .

Hence, the resultant force is 413 N at an angle of −156°

image

Resultant of Coplanar Forces by Calculation

An alternative to the graphical methods of determining the resultant of two coplanar forces is by calculation. This can be achieved by trigonometry using the cosine rule and the sine rule, or by resolution of forces (see later).

For example, to determine the magnitude and direction of the resultant of a force of 8 kN acting at an angle of 50° to the horizontal and a force of 5 kN acting at an angle of Ł30° to the horizontal using the cosine and sine rules:

The space diagram is shown in Figure 11.6(a). A sketch is made of the vector diagram, oa representing the 8 kN force in magnitude and direction and ab representing the 5 kN force in magnitude and direction. The resultant is given by length ob. By the cosine rule,

image

image

Hence the resultant of the two forces is 10.14 kN acting at an angle of 20.95° to the horizontal

Resultant of more than Two Coplanar Forces

For the three coplanar forces F1, F2 and F3 acting at a point as shown in Figure 11.7, the vector diagram is drawn using the nose-to-tail method.

The procedure is:

(i) Draw oa to scale to represent force F1 in both magnitude and direction (see Figure 11.8)

(ii) From the nose of oa, draw ab to represent force F2

image

(iii) From the nose of ab, draw bc to represent force F3

(iv) The resultant vector is given by length oc in Figure 11.8. The direction

of resultant oc is from where we started, i.e. point o, to where we fin- ished, i.e. point c. When acting by itself, the resultant force, given by oc, has the same effect on the point as forces F1, F2 and F3 have when acting together. The resulting vector diagram of Figure 11.8 is called the polygon of forces.

For example, three coplanar forces acting at a point are: force A, 12 N acting horizontally to the right, force B, 7 N inclined at 60° to force A, and force C, 15 N inclined at 150° to force A. The magnitude and direction of their resultant is determined graphically as follows:

The space diagram is shown in Figure 11.9. The vector diagram, shown in Figure 11.10, is produced as follows:

(i) oa represents the 12 N force in magnitude and direction

(ii) From the nose of oa, ab is drawn inclined at 60° to oa and 7 units long

(iii) From the nose of ab, bc is drawn 15 units long inclined at 150° to oa

(i.e. 150° to the horizontal)

(iv) oc represents the resultant; by measurement, the resultant is 13.8 N inclined at ¢ D 80° to the horizontal

Thus the resultant of the three forces, FA, FB and FC is a force of 13.8 N at 80° to the horizontal

image

image

Coplanar Forces in Equilibrium

When three or more coplanar forces are acting at a point and the vector diagram closes, there is no resultant. The forces acting at the point are in equilibrium.

For example, five coplanar forces are acting on a body and the body is in equilibrium. The forces are: 12 kN acting horizontally to the right, 18 kN acting at an angle of 75°, 7 kN acting at an angle of 165°, 16 kN acting from the nose of the 7 kN force, and 15 kN acting from the nose of the 16 kN force. To determine the directions of the 16 kN and 15 kN forces relative to the 12 kN force:

With reference to Figure 11.11, oa is drawn 12 units long horizontally to the right. From point a, ab is drawn 18 units long at an angle of 75°. From b, bc is drawn 7 units long at an angle of 165° . The direction of the 16 kN force is not known, thus arc pq is drawn with a compass, with centre at c, radius 16 units. Since the forces are at equilibrium, the polygon of forces must close.

Using a compass with centre at 0, arc rs is drawn having a radius 15 units.

The point where the arcs intersect is at d.

By measurement, angle

image

Thus the 16 kN force acts at an angle of 198° (or −162° ) to the 12 kN force, and the 15 kN force acts at an angle of 291° (or −69°) to the 12 kN force.

Resolution of Forces

A vector quantity may be expressed in terms of its horizontal and vertical components.

For example, a vector representing a force of 10 N at an angle of 60° to the horizontal is shown in Figure 11.12. If the horizontal line oa and the vertical line ab are constructed as shown, then oa is called the horizontal component of the 10 N force, and ab the vertical component of the 10 N force.

image

This process is called finding the horizontal and vertical components of a vector or the resolution of a vector, and can be used as an alternative to graphical methods for calculating the resultant of two or more coplanar forces acting at a point.

For example, to calculate the resultant of a 10 N force acting at 60° to the horizontal and a 20 N force acting at Ł30° to the horizontal (see Figure 11.13) the procedure is as follows:

image

image

Hence the resultant of the 10 N and 20 N forces shown in Figure 11.13 is 22.36 N at an angle of −3.44° to the horizontal.

The above example demonstrates the use of resolution of forces for calculating the resultant of two coplanar forces acting at a point. However, the method may also be used for more than two forces acting at a point.

For example, three coplanar forces acting at a point are: 200 N acting at 20° to the horizontal, 400 N acting at 165° to the horizontal, and 500 N acting at 250° to the horizontal. To determine by resolution of forces the resultant of the forces:

A tabular approach using a calculator may be made as shown below.

image

image

Summary

(a) To determine the resultant of two coplanar forces acting at a point, four methods are commonly used. They are:

by drawing:

(1) triangle of forces method, and

(2) parallelogram of forces method, and

by calculation:

(3) use of cosine and sine rules, and

(4) resolution of forces

(b) To determine the resultant of more than two coplanar forces acting at a point, two methods are commonly used. They are:

by drawing:

(1) polygon of forces method, and

by calculation:

(2) resolution of forces


Force, Mass and Acceleration.

Force, Mass and Acceleration

Introduction

When an object is pushed or pulled, a force is applied to the object. This force is measured in newtons (N). The effects of pushing or pulling an object are:

(i) to cause a change in the motion of the object, and

(ii) to cause a change in the shape of the object.

If a change occurs in the motion of the object, that is, its velocity changes from u to v, then the object accelerates. Thus, it follows that acceleration results from a force being applied to an object. If a force is applied to an object and it does not move, then the object changes shape, that is, deformation of the object takes place. Usually the change in shape is so small that it cannot be detected by just watching the object. However, when very sensitive measuring instruments are used, very small changes in dimensions can be detected.

A force of attraction exists between all objects. The factors governing the size of this force F are the masses of the objects and the distances between their centres:

image

Thus, if a person is taken as one object and the earth as a second object, a force of attraction exists between the person and the earth. This force is called the gravitational force and is the force that gives a person a certain weight when standing on the earth’s surface. It is also this force that gives freely falling objects a constant acceleration in the absence of other forces.

Newton’s Laws of Motion

To make a stationary object move or to change the direction in which the object is moving requires a force to be applied externally to the object. This concept is known as Newton’s first law of motion and may be stated as:

An object remains in a state of rest, or continues in a state of uniform motion in a straight line, unless it is acted on by an externally applied force

Since a force is necessary to produce a change of motion, an object must have some resistance to a change in its motion. The force necessary to give a stationary pram a given acceleration is far less than the force necessary to give a stationary car the same acceleration. The resistance to a change in motion is called the inertia of an object and the amount of inertia depends on the mass of the object. Since a car has a much larger mass than a pram, the inertia of a car is much larger than that of a pram.

Newton’s second law of motion may be stated as:

The acceleration of an object acted upon by an external force is pro- portional to the force and is in the same direction as the force Thus, force ˛ acceleration, or force D a constant ð acceleration, this constant of proportionality being the mass of the object, i.e.

force = mass × acceleration

The unit of force is the newton (N) and is defined in terms of mass and acceleration. One newton is the force required to give a mass of 1 kilogram an acceleration of 1 metre per second squared. Thus

F = ma

where F is the force in newtons (N), m is the mass in kilograms (kg) and a is the acceleration in metres per second squared (m/s2), i.e.

image

It follows that 1 m/s2 D 1 N/kg. Hence a gravitational acceleration of 9.8 m/s2 is the same as a gravitational field of 9.8 N/kg

Newton’s third law of motion may be stated as:

For every force, there is an equal and opposite reacting force

Thus, an object on, say, a table, exerts a downward force on the table and the table exerts an equal upward force on the object, known as a reaction force or just a reaction.

For example, to calculate the force needed to accelerate a boat of mass 20 tonne uniformly from rest to a speed of 21.6 km/h in 10 minutes:

image

In another example, if the moving head of a machine tool requires a force of 1.2 N to bring it to rest in 0.8 s from a cutting speed of 30 m/min, then from Newton’s second law, F D ma, from which, the mass of the moving head,

image

The law of motion v D u C at can be used to find acceleration a, where

image

Centripetal Acceleration

When an object moves in a circular path at constant speed, its direction of motion is continually changing and hence its velocity (which depends on both magnitude and direction) is also continually changing. Since acceleration is the (change in velocity)/(time taken) the object has an acceleration.

Let the object be moving with a constant angular velocity of ω and a tangential velocity of magnitude v and let the change of velocity for a small change of angle of ˛ˇD ωt) be V (see Figure 9.1(a)). Then, v2 – v1 D V.

The vector diagram is shown in Figure 9.1(b) and since the magnitudes of v1 and v2 are the same, i.e. v, the vector diagram is also an isosceles triangle.

Bisecting the angle between v2 and v1 gives:

image

image

That is, the acceleration a is image and is towards the centre of the circle of  motion (along V). It is called the centripetal acceleration. If the mass of the rotating object is m, then by Newton’s second law, the centripetal force isimage, and its direction is towards the centre of the circle of motion.

For example, if a vehicle of mass 750 kg travels round a bend of radius

image